After the Fake ETF News, How Did Pyth Handle the Bitcoin Price Volatility
TechFlow Selected TechFlow Selected
After the Fake ETF News, How Did Pyth Handle the Bitcoin Price Volatility
This case study demonstrates how Pyth Network handled the sudden price surge and subsequent crash.
Bitcoin prices experienced another brief spike this week following a fake post from the U.S. Securities and Exchange Commission (SEC) official account at 21:11 UTC on January 9, 2024. Approximately 15 minutes after the false statement was posted, Gary Gensler issued an official statement from his personal account, confirming that the SEC's account had been compromised.
This case study demonstrates how Pyth Network handled the sudden price surge and subsequent drop.
Another Volatile Price Move
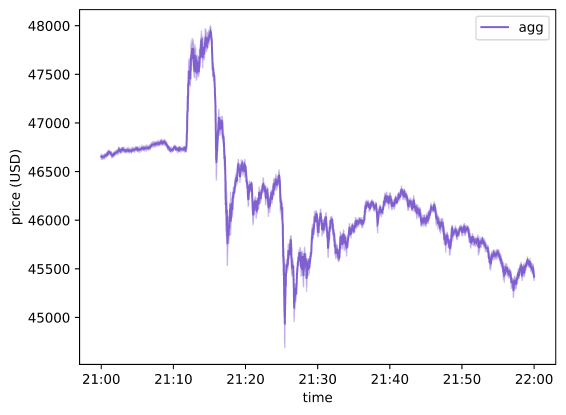
In the chart below, you can see the Pyth aggregate price between 21:11 and 21:26 UTC on January 9, 2024, along with the confidence interval shown in purple shading.
At the peak of the price movement, BTC hovered around $48,000 on most exchanges. The Pyth confidence interval widened accordingly to reflect uncertainty across different Bitcoin markets.
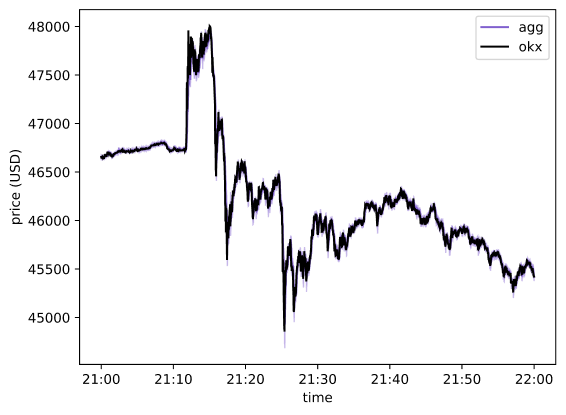
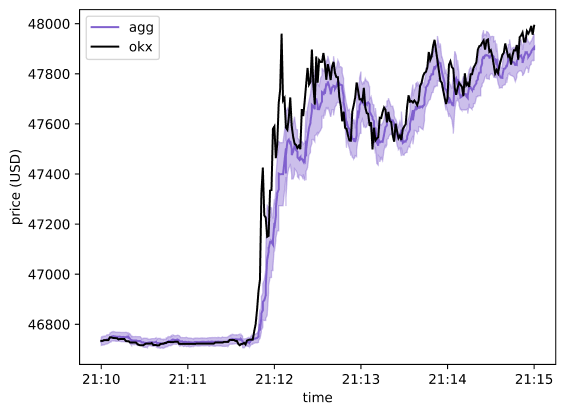
We compare the Pyth BTC/USD aggregate price series against the market price on OKX for BTC/USDT—a highly liquid trading pair and thus a strong proxy for real-time Bitcoin pricing. As seen in the chart below, the Pyth aggregate price (purple) closely tracks the OKX price (black). Even during abrupt price movements, the Pyth oracle accurately reflects price activity across multiple genuine markets at high resolution.
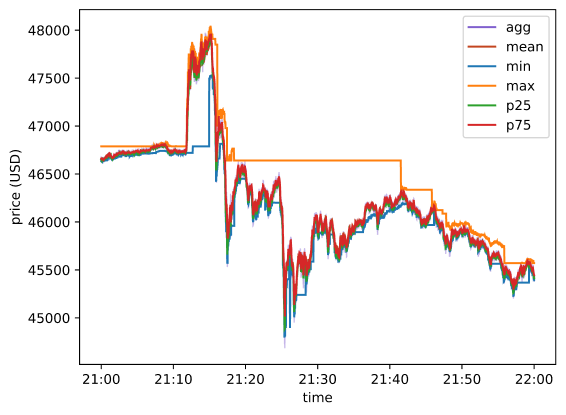
Let’s take a closer look at the composition of the Pyth BTC/USD aggregate price.
The chart below shows the aggregate price and its confidence interval. It also displays the minimum and maximum prices reported by active publishers (or data providers), as well as the 25th and 75th percentile values among those active publishers.
The narrow range between the 25th and 75th percentiles indicates that most data publishers reliably tracked the Bitcoin price surge on major centralized exchanges. While there were some outliers in both directions (e.g., the maximum value among active publishers), the Pyth aggregation algorithm successfully filtered them out.
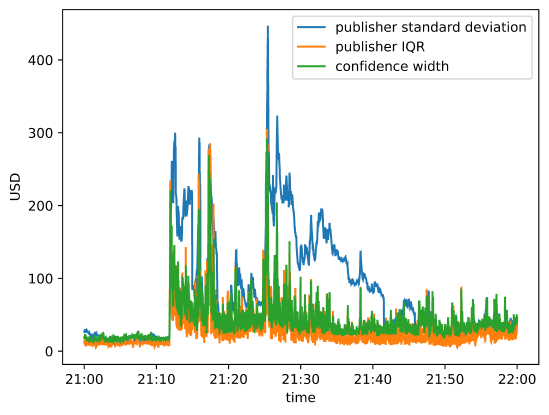
The next chart shows the standard deviation of prices among active publishers, the interquartile range (difference between the 75th and 25th percentiles), and the width of the aggregate confidence interval.
The Pyth aggregation algorithm’s ability to filter outliers is clearly visible here: the standard deviation across publishers significantly exceeds the interquartile range, primarily due to the influence of a few outliers. Notably, the publisher reporting the highest price between 21:20 and 21:45 may have had issues with their data source during that period. However, thanks to typically having around 30 active publishers for the BTC/USD feed and the built-in outlier resistance of the aggregation algorithm, the final aggregate price effectively filtered out these anomalies. The Pyth confidence interval aligns closely with the interquartile range rather than the full outlier range.
An interesting observation: over a one-hour window, the price on one of the major CEXs fell within one Pyth confidence interval 73% of the time, and within two confidence intervals 93% of the time.
This outcome reflects well-calibrated processes: when discrepancies exist among traders and liquidity venues, data publishers widen their confidence intervals; when consensus emerges, the intervals tighten. This behavior is exactly what the Pyth confidence interval mechanism is designed for, providing downstream protocols with robust, actionable insights using Pyth BTC/USD price feed data.
Deep Dive: The Fake SEC Tweet
Let’s examine a specific moment at 21:12:30 GMT on that day.
The aggregate price was $47,673.93. The lowest publisher price was $46,720.02, with only two publishers reporting below $47,000. The highest reported price was $47,826.18. The total confidence interval width was $105.77, with 23 active publishers quoting prices within a relatively tight $350 range—only five publishers fell outside this band.
Now zooming into the initial surge period between 21:12–21:15 GMT, we can visually observe the confidence interval widening amid increased volatility and uncertainty.
Indeed, during this three-minute window, the average total confidence interval width exceeded $77, approximately 0.15%.
For the remainder of that hour, the average total confidence interval width was about $45, or roughly 0.1%.

Deep Dive: The Gensler Statement
After Gensler tweeted confirmation that the SEC’s official account had falsely announced ETF approval, Bitcoin prices predictably reacted downward on many centralized exchanges. During this one-hour window, prices on some exchanges dropped to as low as $44,750.
Pyth data publishers immediately reflected the decline in real-time prices, causing the reported aggregate price to fall rapidly. The Pyth confidence interval widened significantly to capture price dislocations across different liquidity venues.
As Bitcoin prices on these platforms recovered to around $45,600, publisher quotes converged again, and the overall confidence interval width decreased accordingly.
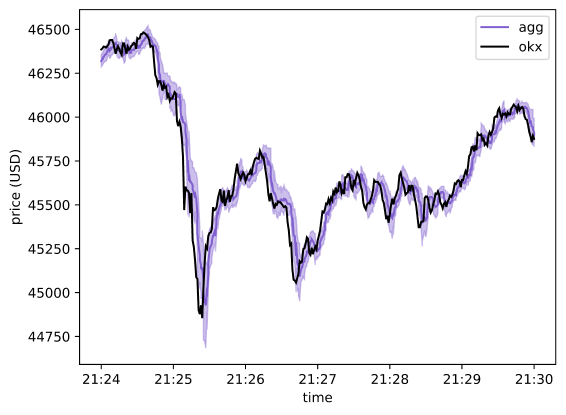
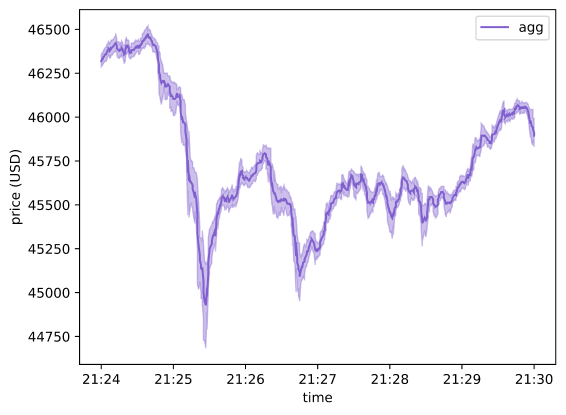
The confidence interval before the news announcement (approximately $46, or 0.1%) was narrower than after the news (approximately $71, or 0.15%).
Ongoing uncertainty surrounding the news event and its aftermath increased Bitcoin price uncertainty, leading to greater volatility and wider divergence among publisher quotes.
Over time, as uncertainty diminished, the overall confidence interval narrowed accordingly. This case study reaffirms that the Pyth confidence interval once again functioned effectively, maintaining resilience amidst market unpredictability.
Join TechFlow official community to stay tuned
Telegram:https://t.me/TechFlowDaily
X (Twitter):https://x.com/TechFlowPost
X (Twitter) EN:https://x.com/BlockFlow_News