Exploring Causality in the Crypto Market: What's Really Driving the Crypto Bull Run?
TechFlow Selected TechFlow Selected
Exploring Causality in the Crypto Market: What's Really Driving the Crypto Bull Run?
Using the Analytic Hierarchy Process, this paper establishes a development activity index GDAI for individual tokens, as well as an overall industry GitHub development activity index IGDAI for the entire sector.
In the previous article “Does 'Team Activity' Really Affect Token Prices?”, we analyzed the correlation between GitHub development activity across the industry and token price changes, concluding that all six GitHub factors positively correlate with price movements in both bull and bear markets.
This article further explores the causal relationship behind this "correlation"—specifically, “Does technological advancement drive price increases, or do rising prices stimulate technical development?”—to help investors and developers better understand the role of “technical development” as a fundamental factor influencing price fluctuations.
The overall structure of the article is as follows:
First, we construct a GitHub Development Activity Index (GDAI) for individual tokens to measure their development activity.
Second, based on GDAI and considering factors such as market capitalization rankings and the evolving number of GitHub projects over time, we build an Industry GitHub Development Activity Index (IGDAI) to reflect overall industry-wide GitHub development activity.
Third, by comparing trends in IGDAI and token price changes over the past six years, we assess the causal relationship between technology development and price movements.
Finally, we apply the GDAI metric to tokens that have maintained continuous development over the past six years, comparing their development activity and price performance against BTC and ETH to validate our earlier conclusions about causality between technology and price.
Step 1. Constructing the GitHub Development Activity Index (GDAI) for Individual Projects Using the Analytic Hierarchy Process (AHP)
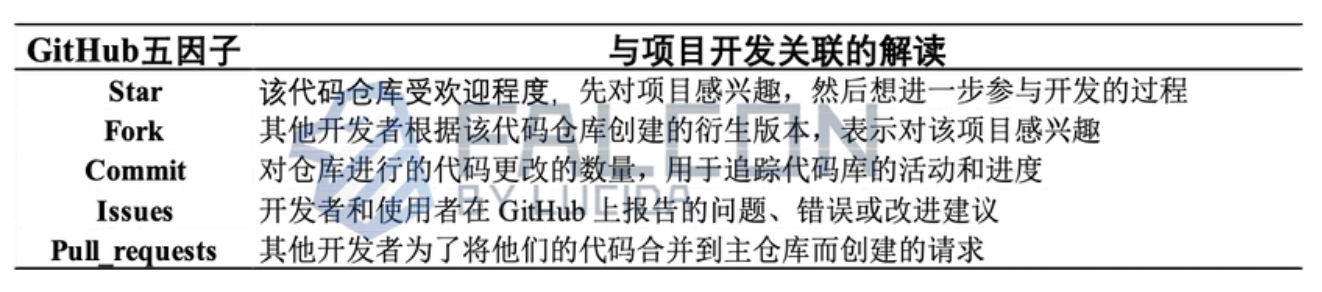
Table 1: Interpretation of the Relationship Between Five GitHub Factors and Project Development
The specific GDAI formula is as follows:
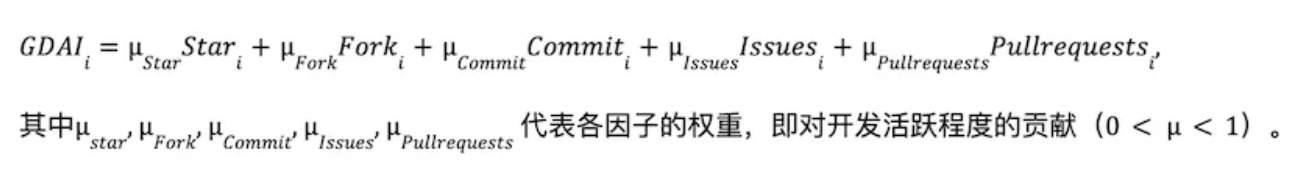
The Analytic Hierarchy Process (AHP) is a systematic decision-making and evaluation method that decomposes complex decisions into hierarchical layers: objective, criteria, and alternatives. Based on this decomposition, qualitative and quantitative analyses are conducted efficiently through simple calculations.
(1) Analyze relationships among system elements and establish a hierarchical structure
Decompose the GDAI objective layer into five criteria:
μStar, μFork, μCommit, μIssues, μPullRequests.
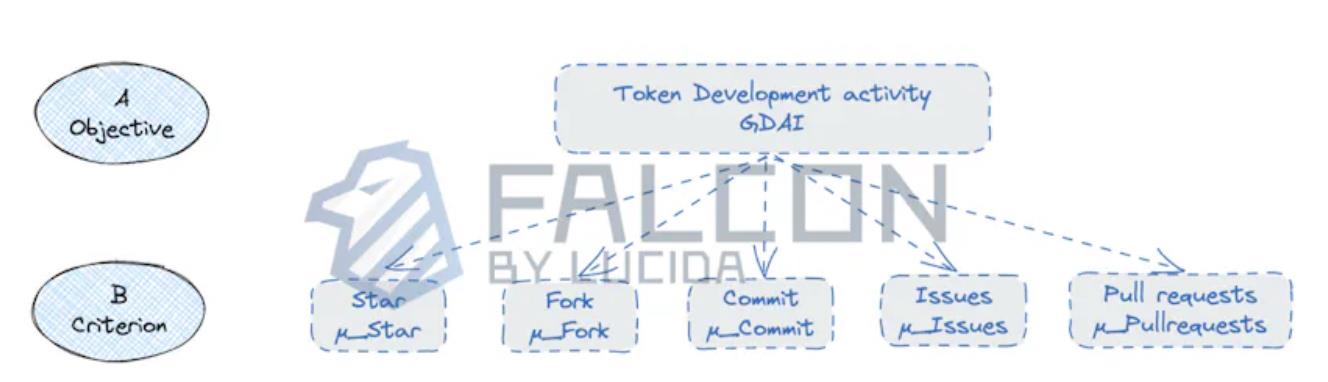
Figure 1: GDAI Metric Decomposition Diagram
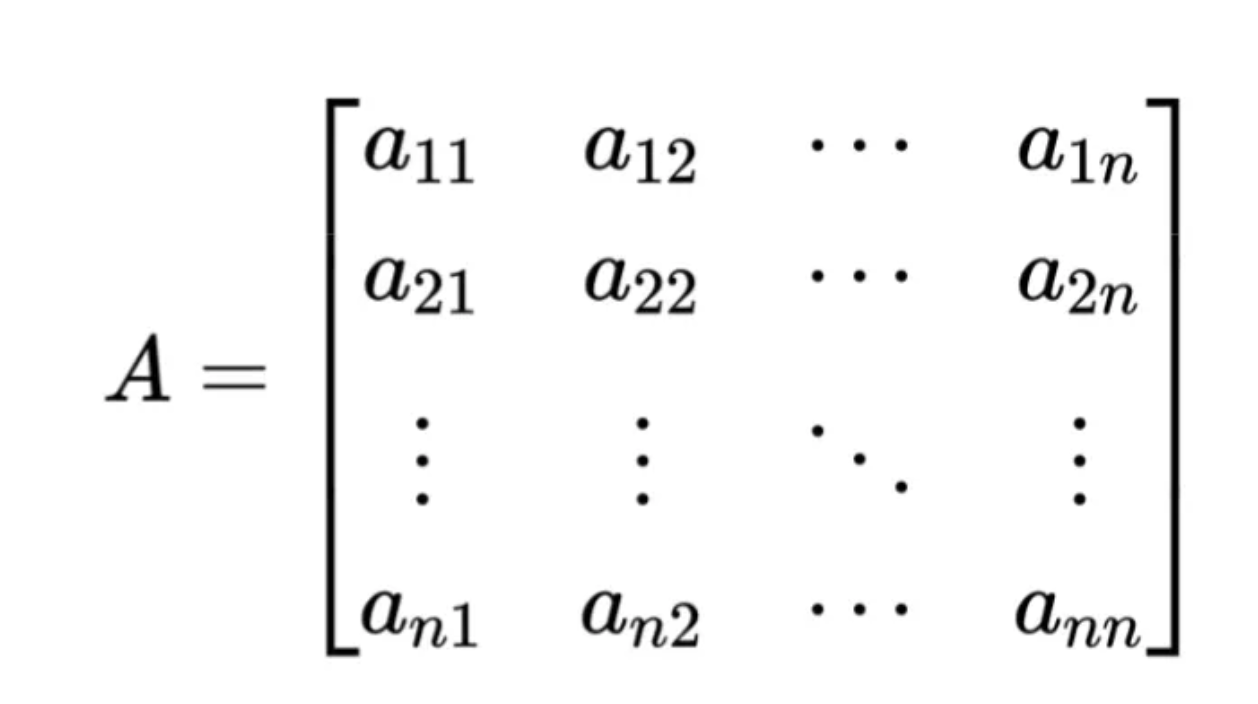
(2) Establish Judgment Matrix
For each element at the same level, pairwise comparisons are made regarding their importance relative to a higher-level criterion, forming a judgment matrix. Table 2 defines different levels of importance.
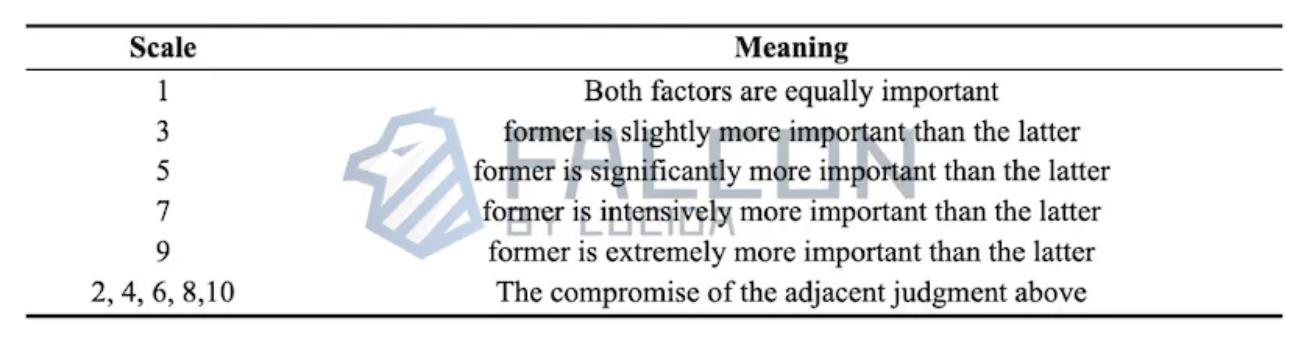
Table 2: Scale of Relative Importance
We create the following judgment matrix B for the criteria layer. Based on experience and indicator characteristics, the priority of contribution to GitHub development activity is Commit > Pull Requests > Issues > Fork > Star. Since Star and Fork have less direct connection to actual development activities, they are assigned relatively lower weights.
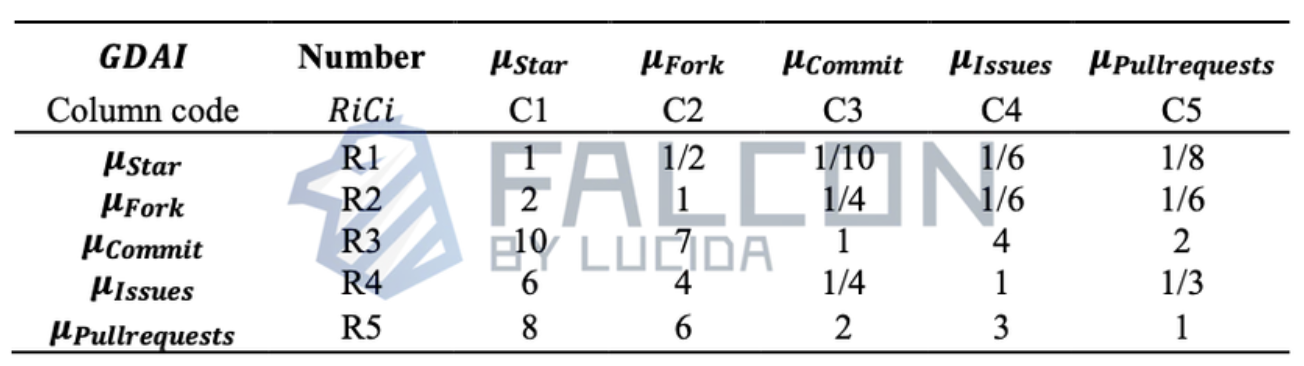
Table 3: Judgment Matrix B
(3) Consistency Check (CI)
Characteristic equation of matrix B:
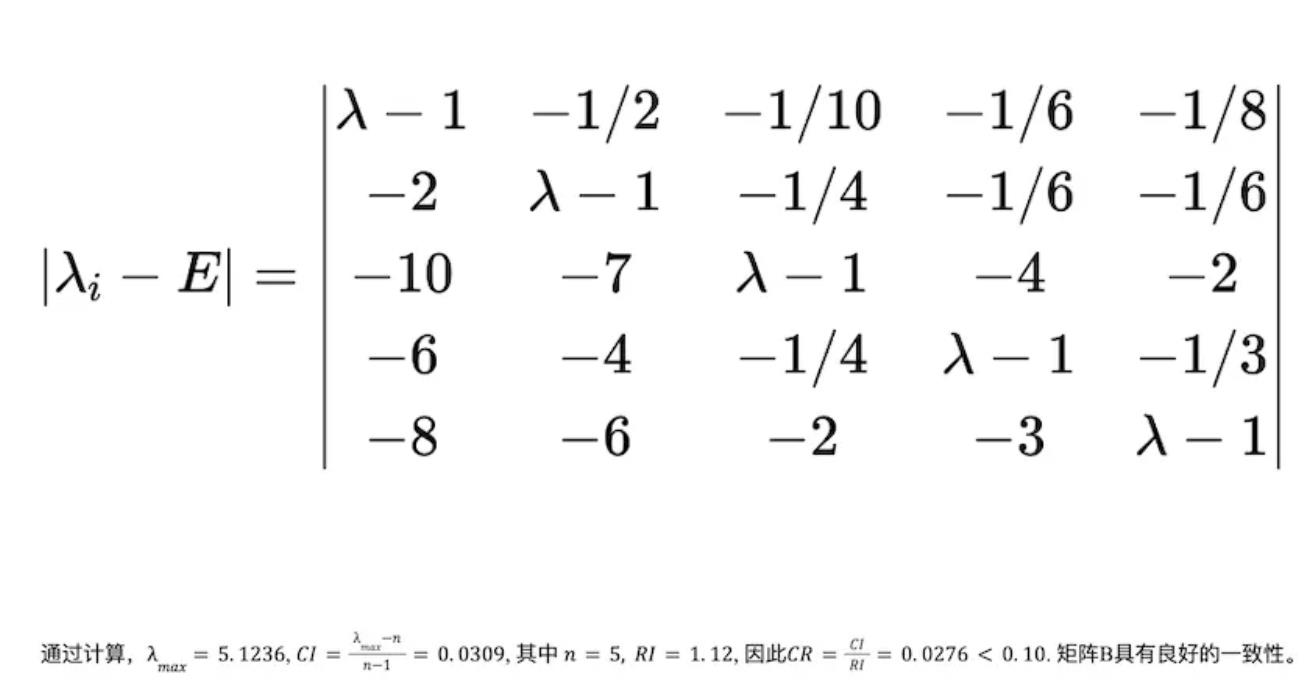
(4) Three Methods to Calculate Weights
Method 1: Arithmetic Mean Method
The derived weight vector formula is:
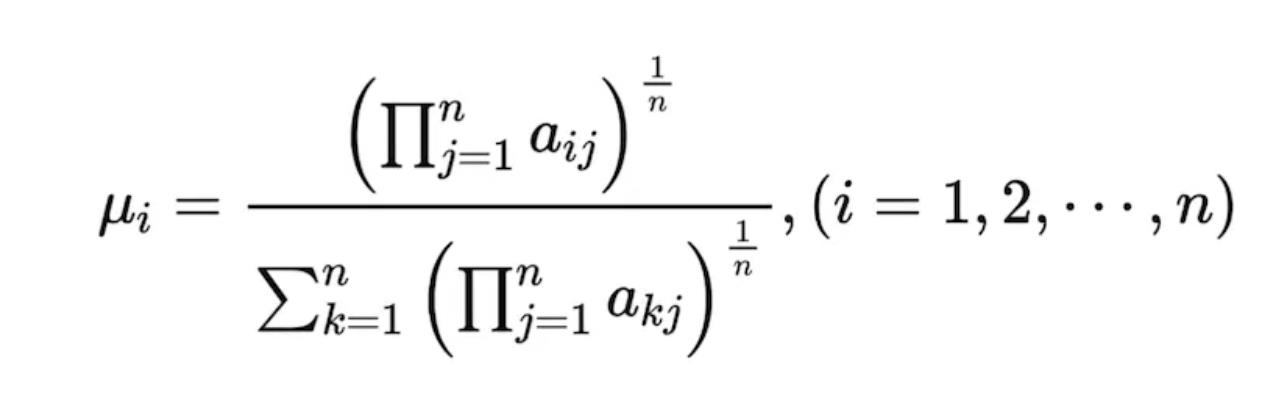 Method 2: Geometric Mean Method
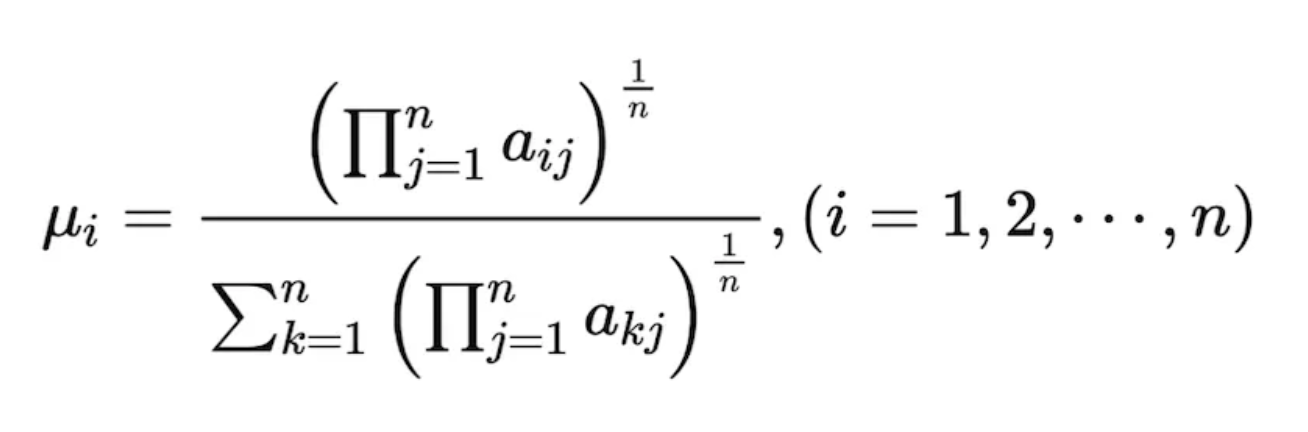
Method 3: Use the eigenvalue method to determine the maximum eigenvalue of matrix A and its corresponding eigenvector, then normalize the eigenvector to obtain the required weights.
We take the average of the weights calculated by these three methods as the final weight values. The detailed results are shown in Table 4:
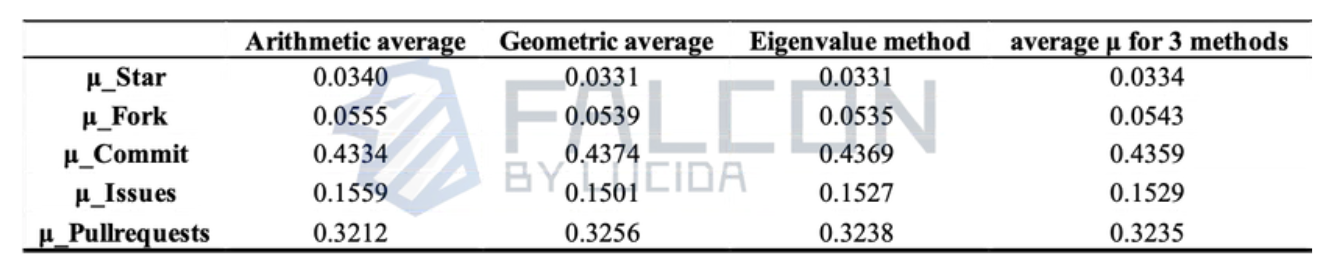
Table 4: Specific Weights of the Five Factors
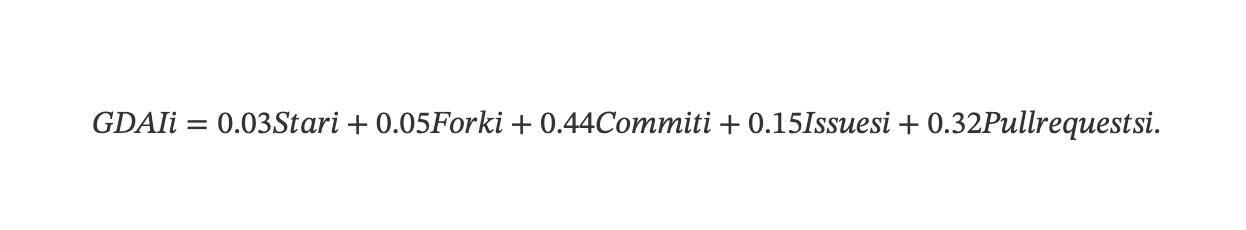
Therefore, the specific form of the GDAI index can be expressed as:
Step 2. Optimized Industry-Wide GitHub Development Activity Index (IGDAI) Based on GDAI
In Step 1, we constructed the GDAI metric for individual tokens. Now, building upon GDAI, we consider all cryptocurrency tokens listed in the market and open-sourced on GitHub. By aggregating the GDAI values of all such tokens, we derive the Industry GitHub Development Activity Index (IGDAI). The specific IGDAI calculation formula is as follows:

IGDAI Calculation Formula
Here, n represents the total number of tokens circulating in the cryptocurrency market and open-sourced on GitHub during a given period.
There are typically two approaches to constructing an index reflecting the entire industry:
1. Select representative samples and calculate their performance;
2. Comprehensively consider the entire industry.
Regarding approach 1, we note that the current cryptocurrency ecosystem is not fully mature—many tokens with strong market performance remain closed-source, making third-party access to their development data impossible, thus questioning the representativeness of selected samples. Additionally, the crypto space remains a blue ocean with vast growth potential, where any token could rapidly evolve within a short timeframe. Furthermore, the 24/7 high liquidity nature of crypto markets leads to significant short-term volatility in market caps. If we follow practices like those in the A-share market of periodically replacing sample assets, we risk missing crucial information about market cap shifts.
Therefore, this paper adopts a comprehensive approach by aggregating development data from all industry tokens to compute IGDAI.
Step 3. What Comes First: "Technological Revolution" or "Price Surge"? Price Changes Unidirectionally Influence GitHub Development Activity
We apply the Granger Causality Test to analyze the causal relationship between the industry's development activity (IGDAI) and BTC price changes using daily time-series data from 2015 to October 31, 2023. After determining a lag order of 4 and confirming stationarity of both datasets via Unit Root Tests (a prerequisite for Granger causality), we obtain the following results:
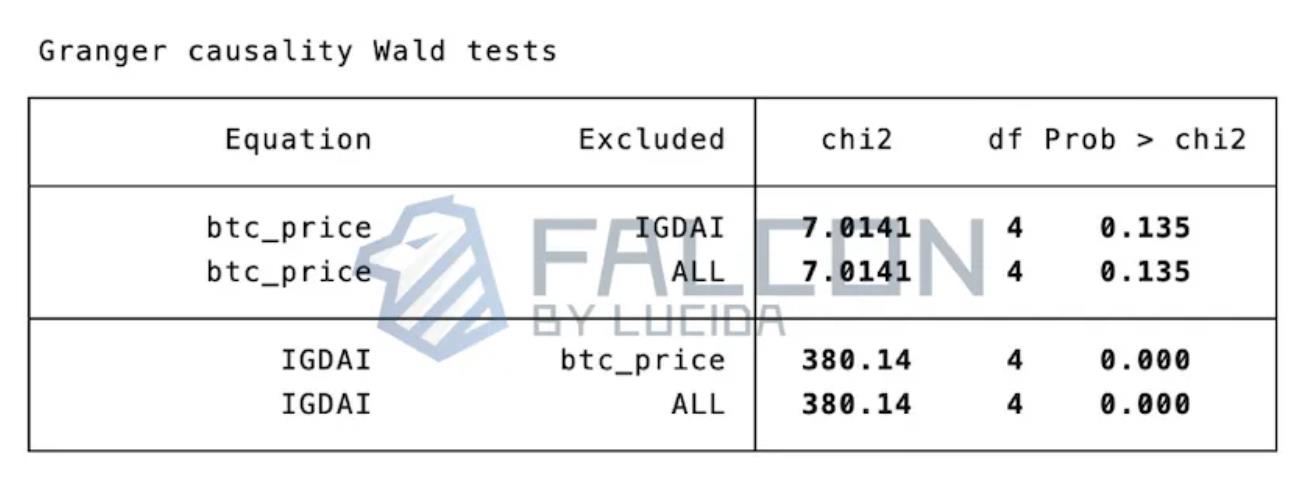
Table 5: Results of Granger Causality Test
Since 0.000 < 0.05, the F-test rejects the null hypothesis (H₀: no Granger causality), indicating that BTC_price Granger-causes IGDAI—i.e., industry-wide GitHub development activity (IGDAI) is influenced by lagged changes in token prices.
However, 0.135 > 0.05 means the test fails to reject the null hypothesis—IGDAI does not Granger-cause BTC_price. In summary, price changes unidirectionally influence development activity.
To provide more intuitive insights, we also visualize the data. Given that daily development activity exhibits high volatility due to random noise, we apply exponential smoothing and aggregate data weekly. Figure 2 shows monthly trends in IGDAI and BTC price from 2015 to present:
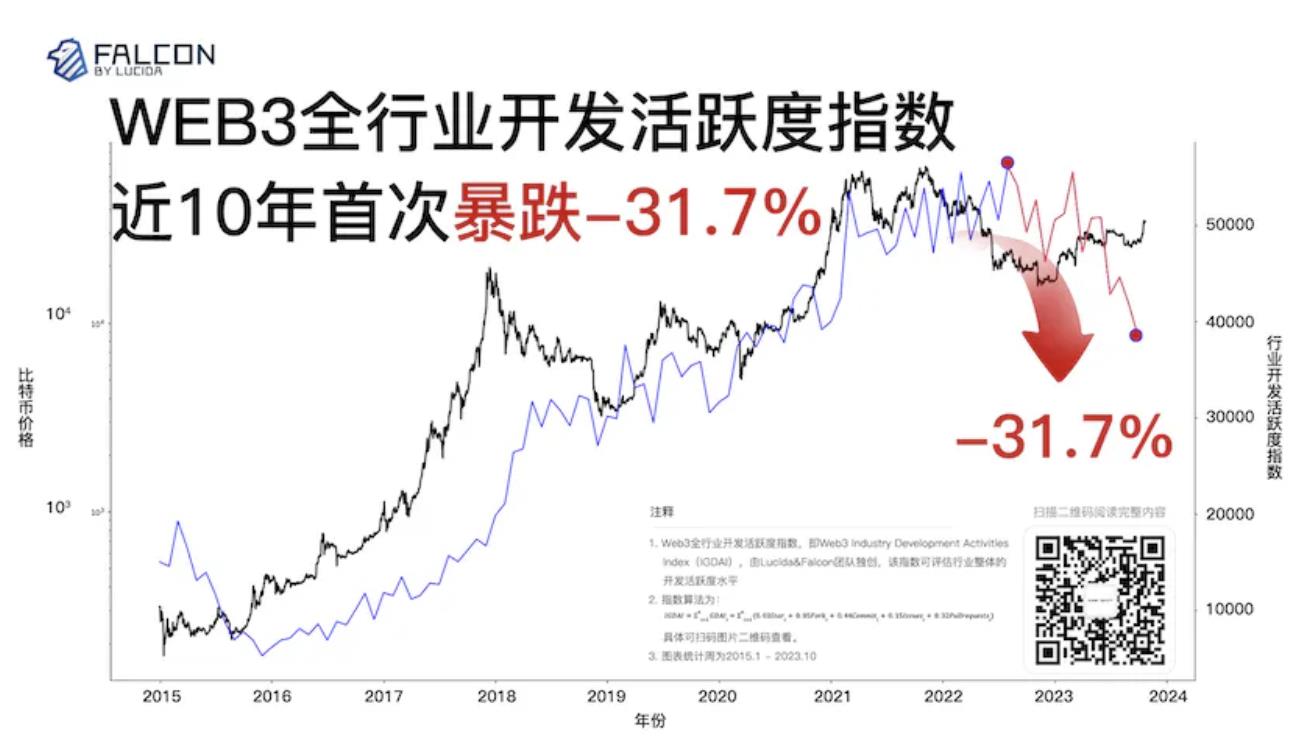
Figure 2: IGDAI Index and BTC Price Changes from 2015–October 2023
The chart clearly shows that changes in industry development activity consistently lag behind BTC price movements, while mirroring similar fluctuation patterns—further supporting the conclusion that IGDAI is unidirectionally driven by price changes.
Moreover, the figure reveals that in recent months, the industry’s development activity index plummeted by 31.7%, marking the largest drop in nearly a decade!
Step 4. Does Continuous Development Ensure Strong Post-Bear-Market Performance? No!
In Step 3, the Granger Causality Test confirmed that prices unidirectionally influence technical development. However, we now explore whether there exists a special case: even if development activity isn’t a leading indicator of price gains, could persistent development—without team abandonment—ensure decent post-bear-market performance? Considering variations in project maturity and diversity, we identify tokens that have continuously developed since 2018 and compare their GDAI and price performance against BTC.
We define “continuous development” as having non-zero weekly values for core GitHub metrics—commits, issues, and pull requests—from 2018 to October 2023. Price return is defined as (highest price – lowest price) / lowest price during this period. After extensive data scraping and analysis, we find approximately 1,400 tokens that were both open-sourced and listed since 2018. Among them, 38 meet our continuity criteria (including BTC and ETH). Given the maturity and representativeness of BTC and ETH, and due to space constraints, this article focuses on the remaining 36 tokens. The full list is shown in Table 6:
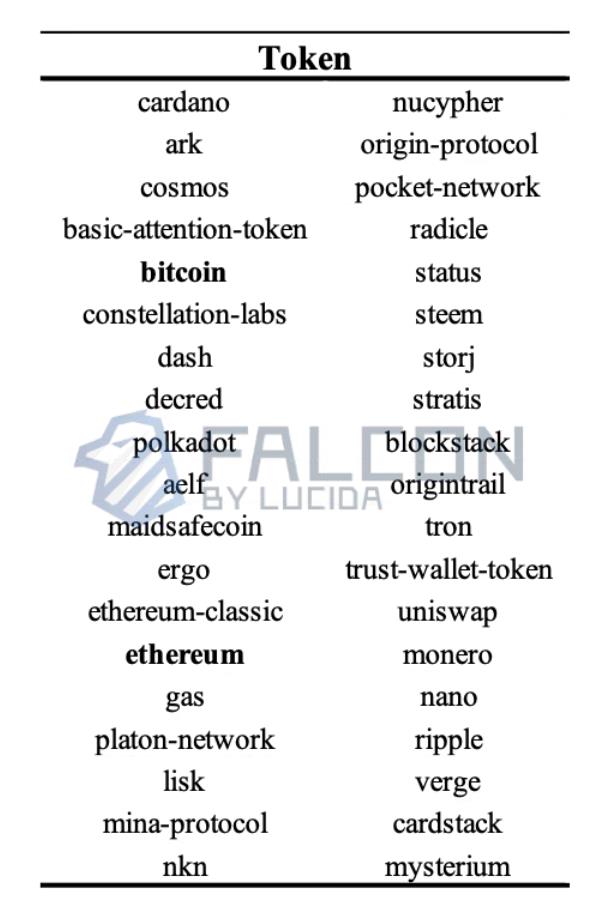
Table 6: Tokens with Continuous GitHub Development Since 2018
Regarding GitHub development activity (GDAI), Figure 3 displays the status of the 38 tokens:
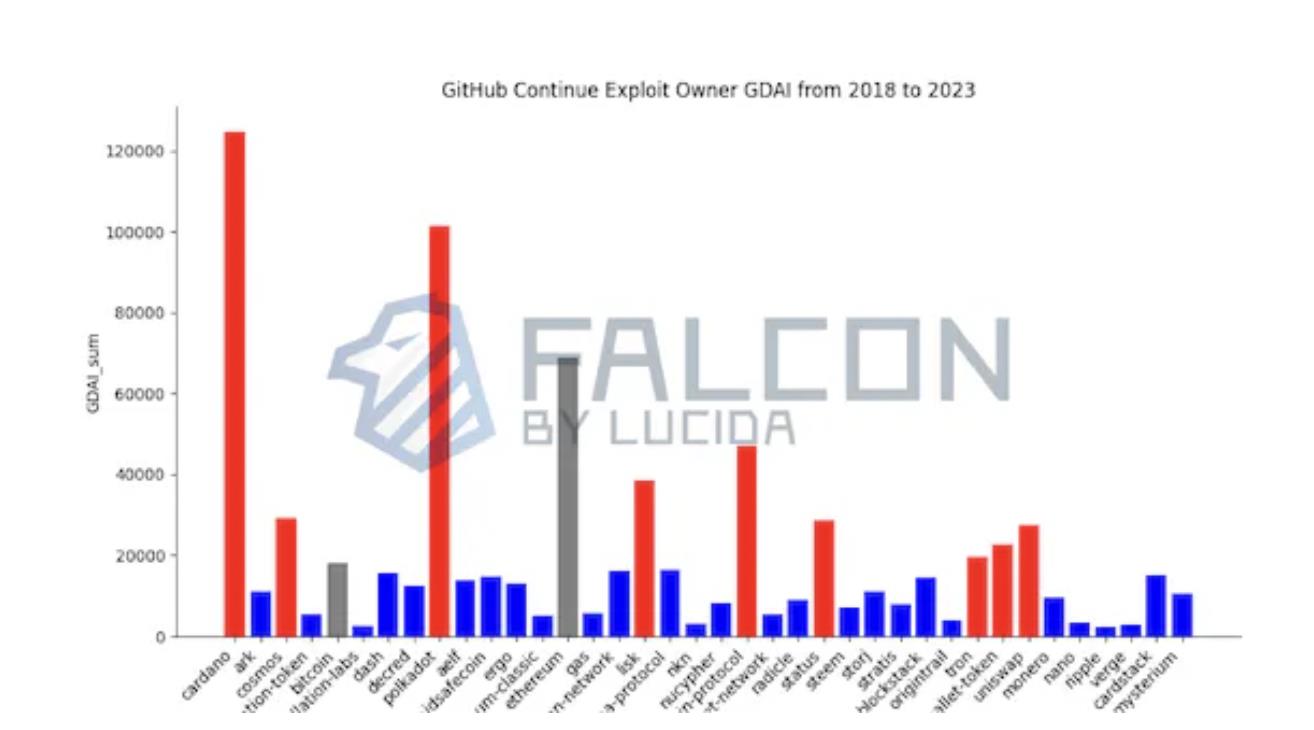
Figure 3: GDAI of Tokens with Continuous GitHub Development (2018–2023)
Red bars indicate tokens whose GDAI exceeds BTC; blue bars indicate otherwise. Among continuously developed tokens, 9 outperform BTC in development activity.
Regarding price returns, see Figure 4:
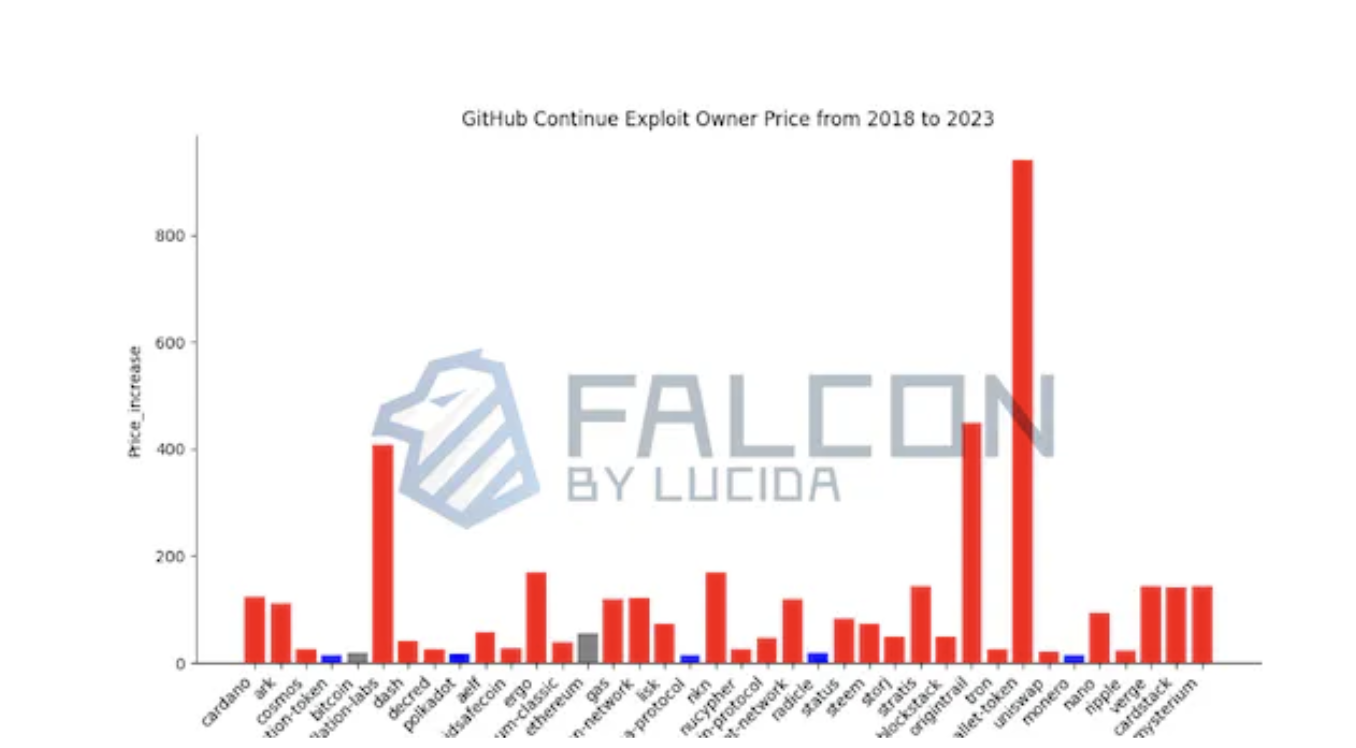
Figure 4: Price Returns of Tokens with Continuous GitHub Development (2018–2023)
Red bars indicate tokens whose price returns exceed BTC; blue bars indicate otherwise. Among continuously developed tokens, 31 outperformed BTC in price appreciation.
Combining both figures, only 8 tokens appear in red in both charts—meaning that since 2018, only 8 tokens simultaneously outperformed BTC in both GDAI and price returns (BTC being the industry benchmark), accounting for just 22% of all continuously developed tokens. These tokens are listed in Table 7:
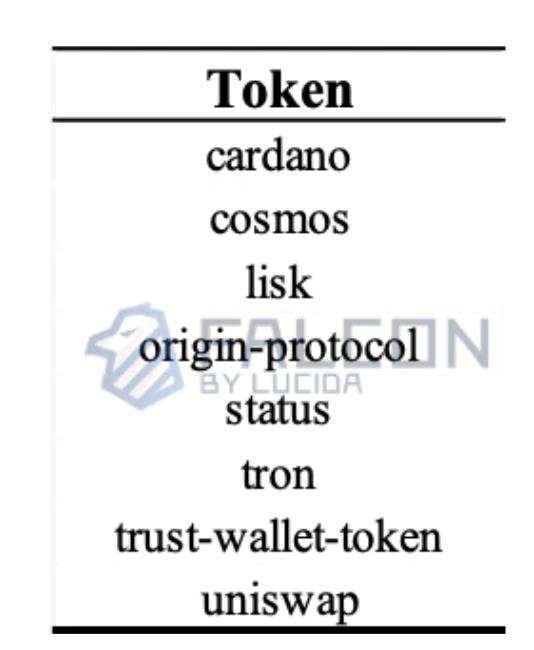
Table 7: Tokens Outperforming BTC in Both GDAI and Price Return (2018–2023)
The 22% overlap rate is low, suggesting that while continuous development has some impact on price, it does not guarantee strong positive price effects. This finding aligns with the Granger causality results from Step 3.
Conclusion
To summarize, Falcon draws the following conclusions:
-
Using the Analytic Hierarchy Process, this paper establishes a GitHub Development Activity Index (GDAI) for individual tokens and an Industry GitHub Development Activity Index (IGDAI) for the broader sector.
-
By analyzing IGDAI and BTC price data from 2015 to October 2023, we find that token prices unidirectionally influence GitHub development activity. Moreover, in recent months, the industry’s development activity index dropped sharply by 31.7%, the largest decline in nearly a decade.
-
“Continuous team development without abandonment” is not a core driver of post-bear-market price recovery. Investors should consider multiple factors when evaluating price potential.
Join TechFlow official community to stay tuned
Telegram:https://t.me/TechFlowDaily
X (Twitter):https://x.com/TechFlowPost
X (Twitter) EN:https://x.com/BlockFlow_News