

A Brief Analysis of ETH's Recent Price Performance and Direct Influencing Factors
TechFlow Selected TechFlow Selected
A Brief Analysis of ETH's Recent Price Performance and Direct Influencing Factors
In the long term, compared to the previous bear market, ETH has been on an overall upward trend relative to BTC due to ecosystem development.
Author: duoduo, LD Capital
Recently, Bitcoin has shown strong upward momentum, repeatedly testing the resistance zone between 28,000 and 28,500. In contrast, ETH has been relatively weak, only once approaching the 1,750 resistance level. This article briefly analyzes ETH's recent price performance and potential influencing factors.
1. Price Performance
ETH/BTC: In a downtrend since MERGE in 2022
Over the past year, ETH has underperformed relative to BTC. Looking at the ETH/BTC ratio from early 2022 to present: from the beginning of 2022 to June, it declined from 0.081 to around 0.050. Following the Merge upgrade, there was a rebound, bringing the ratio back to approximately 0.08 by September 2022. After the Merge was completed, the ratio resumed its overall downward trend and currently stands at 0.058, approaching the weekly EMA200 level.
However, from a long-term perspective, ETH/BTC is in an uptrend. Extending the time frame, during the 2018 bear market, ETH/BTC hit a low of 0.01. In the current bear market since 2022, the lowest point reached only 0.05. This improvement is primarily due to the growth of the Ethereum ecosystem and the accumulation of significant on-chain value compared to the previous bear market.

Source: tradingview
Technical Indicators
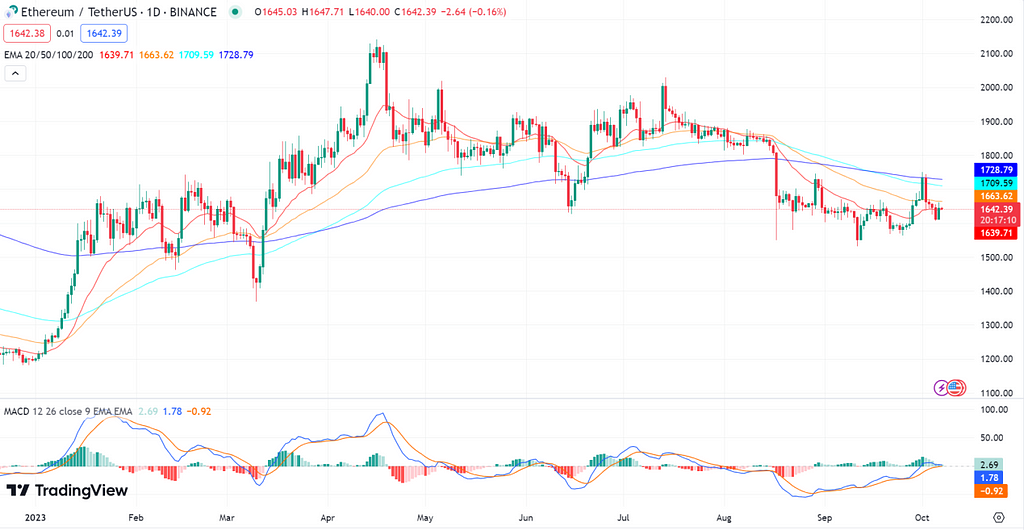
On the daily chart, ETH has remained below the EMA200 since its decline on August 18. The MACD has just approached the zero line. In comparison, BTC moved above the EMA200 on October 1, with its MACD crossing above the zero line into positive territory.
2. Influencing Factors
The strength or weakness of ETH is influenced by many complex factors. Macro-level influences include changes in the Federal Reserve’s interest rate policy and shifts in SEC regulatory attitudes. Micro-level factors include the development of the ETH ecosystem, the rise of Layer 2 solutions, token burning versus issuance, and market sentiment. This section focuses only on recently changed factors.
Significant drop in gas consumption leads to renewed ETH inflation
In August and September 2023, on-chain transaction activity entered a quiet period. On one hand, there were no new trending projects driving engagement; on the other, several major potential airdrop projects experienced large-scale hacks and rug pulls, reducing user interaction.
Ethereum’s on-chain gas fees have mostly stayed below 10 gwei. Reduced on-chain activity and lower gas fees have led to ETH supply exceeding burn over the past 30 days, resulting in inflation. The annualized inflation rate stands at 0.275%, with 27,000 new ETH issued in the last month.
Nonetheless, overall, ETH remains deflationary post-Merge. Since the Merge, the net issuance rate has been -0.217%, with a total reduction of 277,000 ETH.

Source: ultrasound.money
Slower staking growth and shrinking queue for staking deposits
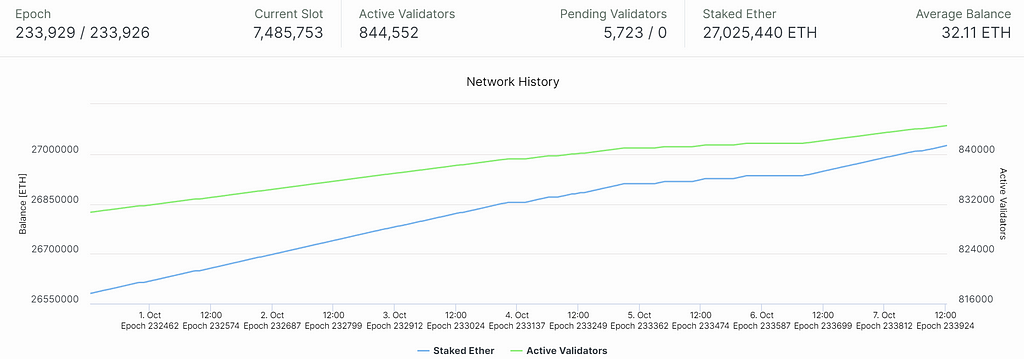
Currently, Ethereum has 844,000 active staking validators, securing approximately 27 million ETH, representing a staking rate of 25.33%.
Overall, the number of new staking deposits has significantly decreased compared to Q2 2023.

Source: OKlink
Currently, there are 5,723 validators waiting to join the staking queue. With Ethereum allowing up to 2,700 new validators per day, the backlog could be cleared within 2–3 days if no additional deposits are added. This marks the shortest staking queue period since the Shanghai upgrade.
Source: beaconcha.in
Founders continuously selling ETH over the past two months
Addresses associated with founder Vitalik have shown ongoing transfers of ETH to exchanges. On October 7, 1,000 ETH (worth about $1.64 million) were transferred to Bitstamp. Over the past two months, this address has deposited a total of 4,400 ETH (worth about $7.23 million) into Bitstamp.
In terms of volume and value, these sales are not large enough to significantly impact ETH’s price. However, they may negatively affect investor confidence.
FTX hacker selling ETH creates short-term selling pressure
The most significant recent event affecting ETH occurred starting October 1, when the FTX hacker began selling ETH and buying BTC.
In November 2022, shortly after FTX filed for bankruptcy, hundreds of millions of dollars started flowing out of exchange balances into hacker-controlled addresses. On November 21, 2022, the hacker分散 185,000 ETH (valued at $308 million) across 13 addresses and then went dormant. After 10 months of inactivity, the hacker resumed moving and selling ETH from these addresses starting September 30.
From September 30 to October 6, 75,000 ETH (worth $120 million) were moved from five addresses. Of this, 71,000 ETH were swapped for BTC via THOR Chain. 2,700 ETH were converted into 165 tBTC and bridged back to the Bitcoin network through Threshold Network. Another 1,500 ETH were transferred via the privacy-focused RAILGUN_Project. This activity even caused THOR Chain to temporarily enter maintenance mode on the afternoon of October 6.
Currently, the hacker still holds 110,000 ETH (worth $176 million) across eight Ethereum addresses. Five of the original 13 addresses have already been emptied.

Source: mest.io
Futures Data
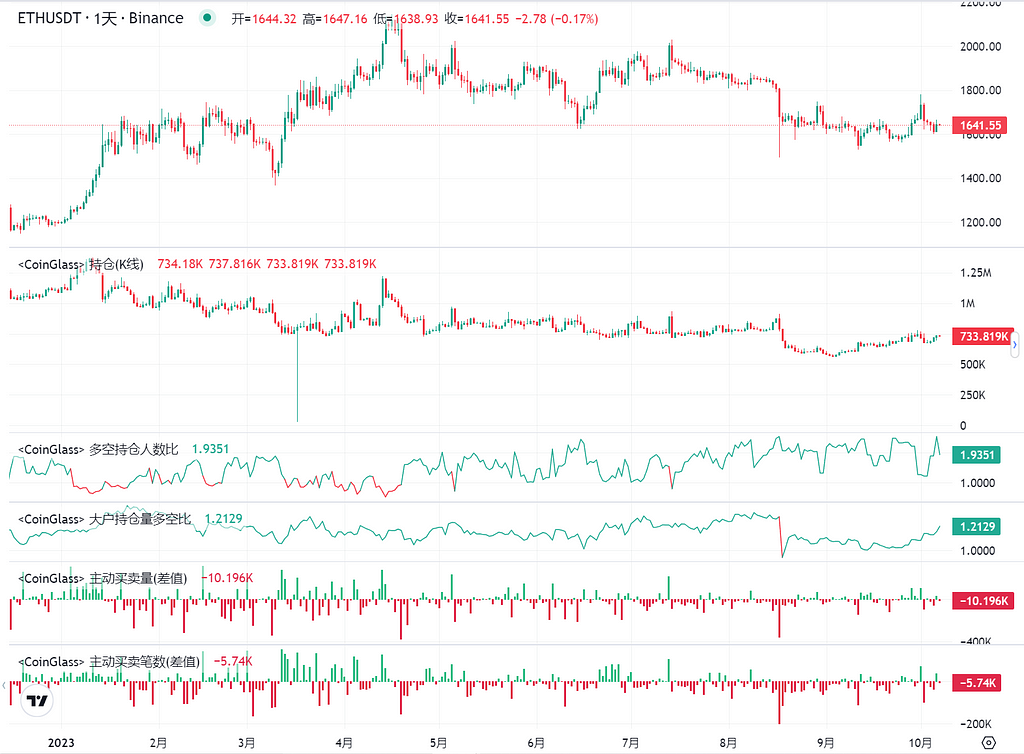
Focusing on open interest trends, ETH futures positions have been generally declining. When ETH rose to $1,600 in January 2023, open interest peaked at around 2.37 million ETH—the highest level of the year. During the April rally near $2,000, open interest reached 1.22 million ETH, the second-highest point. Before the August 18 downturn, open interest stood at 890,000 ETH. The current level is 730,000 ETH.
Compared to the年初 peak, open interest has dropped 45%. Compared to the second-highest point, it’s down 37%. And compared to pre-August 18 levels, it has declined by 17%.
Source: coinglass
3. Summary
In the long term, compared to the previous bear market, ETH has strengthened against BTC due to ecosystem growth, rising from an ETH/BTC ratio of 0.01 to over 0.05. However, over the past year, ETH has underperformed BTC, with the exchange rate in a downtrend.
Fundamentally, since the Merge, ETH has remained deflationary overall, with a net issuance rate of -0.217%. However, in the past two months, reduced on-chain activity and lower gas revenues have pushed ETH into inflationary territory, with a 30-day annualized inflation rate of 0.275%.
On staking metrics, since the Shanghai upgrade, ETH staking has grown steadily, reaching a current staking rate of 25.33%. Recently, however, the pace of new staking deposits has slowed. New deposits are clearly lower than in Q2 2023, and the number of validators waiting to stake is at its lowest since the Shanghai upgrade.
Regarding selling pressure, ongoing ETH sales by the founder, while small in volume, may negatively impact holder confidence. Additionally, the FTX hacker’s sale of ETH for BTC has introduced significant short-term selling pressure.
In terms of futures data, ETH open interest has been on a downward trend throughout the year. Compared to the年初 peak, open interest has dropped 45%; compared to the second-highest point, it has fallen 37%; and compared to pre-August 18 levels, it is down 17%.
Note: All data in this article is accurate as of October 7, 2023.
Join TechFlow official community to stay tuned
Telegram:https://t.me/TechFlowDaily
X (Twitter):https://x.com/TechFlowPost
X (Twitter) EN:https://x.com/BlockFlow_News


