Huobi Growth Academy | Crypto Market Macro Report: Fed Leadership Transition, Bond Yields Surge, Liquidity Inflection Point Looms
TechFlow Selected TechFlow Selected
Huobi Growth Academy | Crypto Market Macro Report: Fed Leadership Transition, Bond Yields Surge, Liquidity Inflection Point Looms
Investors should maintain flexible positions at this stage, avoid aggressively chasing rallies or heavily buying the dip, and patiently await the emergence of a macro-level turning point.
Executive Summary
In May 2026, the global crypto market underwent a profound liquidity repricing amid three simultaneous shocks: the U.S. Federal Reserve’s leadership transition, volatility in the bond market, and Bitcoin’s sharp decline. On May 15, Kevin Warsh officially assumed the role of Fed Chair, immediately confronting an acute challenge—April’s Producer Price Index (PPI) surged 6% year-on-year, nearly erasing three years of anti-inflation progress. Warsh’s three major policy shifts—accelerating balance sheet reduction, redefining the inflation target, and downplaying forward guidance—fundamentally disrupted market pricing logic. Concurrently, the yield on 30-year U.S. Treasury bonds breached the psychological 5% threshold, triggering an unprecedented global bond sell-off; the rapid rise in risk-free rates directly compressed valuation tolerance for risk assets. Under this confluence of pressures, Bitcoin plunged from $82,000 to approximately $76,000, with ETF funds registering net outflows exceeding $1.5 billion—making $76,000 a critical near-term support level. This report analyzes the core logic underpinning this correction through the lens of these three pivotal variables and outlines market trajectories under three distinct scenarios.
I. Warsh’s Ascension: Fed Leadership Transition and Policy Logic Restructuring
On May 15, 2026, Jerome Powell formally stepped down as Fed Chair at the conclusion of his term, handing over to Kevin Warsh—a Hoover Institution fellow at Stanford University and former Fed governor. Warsh’s nomination was confirmed by the Senate with a relatively narrow 54–45 vote, signaling from the outset that his policy stance would face sustained pressure from multiple quarters. On his first day in office, Wall Street superficially “wrapped up with dignity,” as the Nasdaq Composite rose over 1%; yet beneath the surface, deep-seated reform currents were already reshaping market pricing.
Warsh’s policy agenda centers on three pillars. First, accelerating the reduction of the Fed’s balance sheet. With the current balance sheet standing at roughly $6.7 trillion, Warsh has voiced criticism and advocates a more aggressive pace of quantitative tightening (QT). Accelerated QT effectively drains liquidity directly from the financial system, pushing up long-term interest rates and tightening overall monetary conditions—imposing systemic pressure on risk assets, including crypto. Second, redefining the inflation targeting framework. Warsh questions the authority of the rigid 2% numerical target, favoring instead the vaguer concept of “price stability.” This implies potentially higher de facto inflation tolerance—but also introduces greater policy discretion and heightened difficulty for market forecasting. Third, weakening forward guidance and the dot plot. Warsh proposes reducing or eliminating tools like forward guidance and the dot plot to enhance the Fed’s policy flexibility. However, this will also amplify information friction between markets and the central bank, exacerbating short-term volatility.
For the crypto market, Warsh’s position exhibits a nuanced duality. Prior to his nomination as Fed Chair in January 2026, Warsh publicly described Bitcoin as an “important asset” and “a good cop for policy,” reflecting an overall openness toward crypto. Yet this moderate stance stands in structural tension with his immediate, urgent mandate: within his first month in office, he confronted April’s PPI surge of 6% y/y—and must therefore prioritize establishing credibility on inflation control over advancing crypto-friendly policies. Thus, in the short term, Warsh’s anti-inflation mandate exerts liquidity pressure on crypto markets; longer term, his attitude toward digital assets may foster a more institutionally welcoming regulatory environment. Weighing both sides, markets are currently focused far more on the timing of liquidity tightening than on distant regulatory dividends.
II. Bond Market Volatility: The Global Liquidity Turning Point Alert
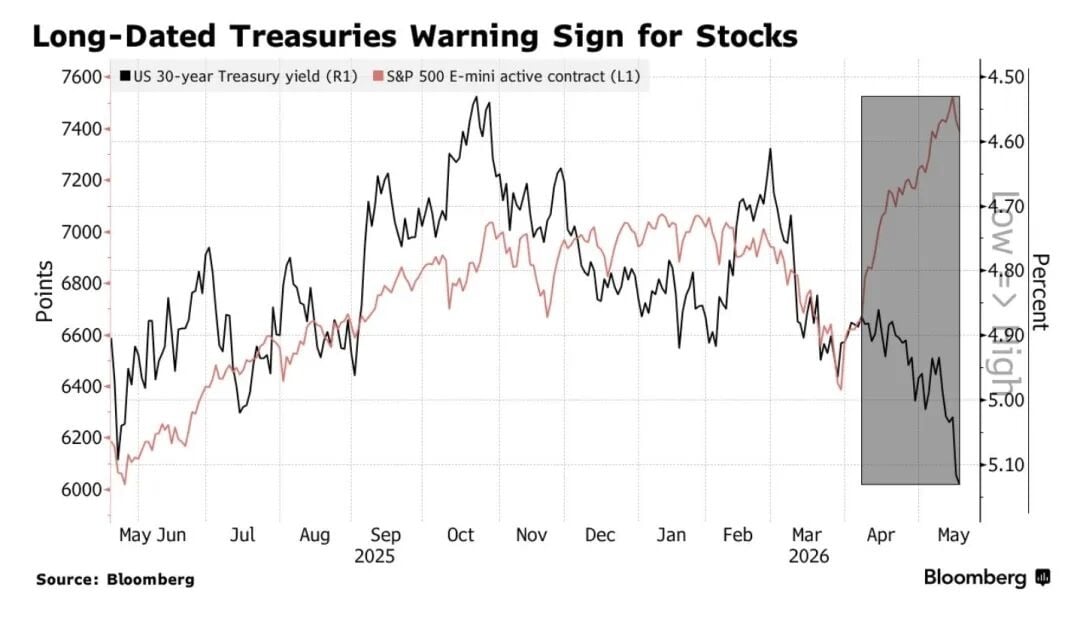
If the Fed’s leadership change merely disturbed market expectations, then concurrent bond market volatility delivered a far more direct, real-world shock to risk assets. In May 2026, global bond markets experienced a rare wave of selling, with sovereign bond yields surging in tandem to multi-year—or even multi-decade—highs. The yield on 30-year U.S. Treasuries broke above the psychological 5% threshold in mid-May, peaking at 5.12%—the highest since 2007; the 10-year yield concurrently climbed to 4.63%, a rare high in recent years. Japan’s 10-year JGB yield hit a 30-year high of 2.797%; the UK’s 30-year gilt yield rose to 5.86%; France’s 30-year yield reached 4.675%; and even Germany’s 30-year Bund yield—long hovering near negative territory—rose to 3.704%.
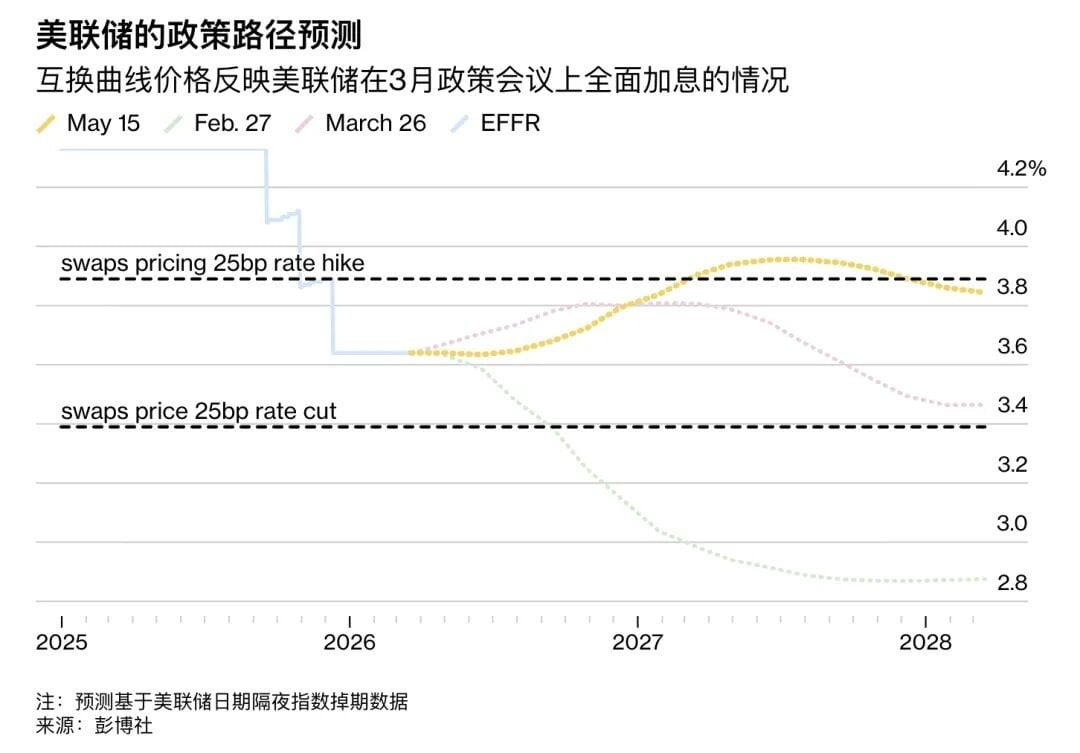
The immediate catalyst for this global bond selloff was the surprise strength of U.S. April PPI data. Month-on-month PPI rose 1.4%, vastly exceeding consensus expectations of 0.3% and marking the largest monthly increase since 2022; year-on-year PPI hit 6%, nearly wiping out the Fed’s three-year anti-inflation gains. As a leading indicator for CPI, the PPI spike signaled to markets that inflation is unlikely to recede smoothly toward the 2% target—prompting immediate global repricing. Crucially, the anticipated rate-cut path was completely upended: before the plunge, markets widely expected two cuts in 2026, with the first cut in June seen as virtually certain; afterward, the probability of any cut dropped sharply to just 15%, while modest rate hikes began entering pricing—by July 2027, the market priced in a 25-basis-point hike with 60% probability. The “higher for longer” narrative made a forceful comeback.
Rising bond yields transmit pressure to crypto markets through multiple channels. First, rising opportunity cost: higher risk-free rates diminish Bitcoin’s relative appeal versus cash and short-term Treasuries—assets offering no yield. Second, declining risk appetite: tightening liquidity expectations trigger systematic selling of high-beta assets. Third, dollar strength: rising real yields typically accompany a stronger U.S. Dollar Index, imposing additional downward pressure on dollar-denominated risk assets. Fourth, the leverage accelerator effect: as of early May 2026, markets held substantial leveraged long positions; margin calls triggered forced liquidations, setting off cascading deleveraging. Data shows that on the day Bitcoin breached its $78,704 low, over $304 million in leveraged long positions were liquidated globally—including ~$94 million in Bitcoin longs. This chain of transmission forms the macro foundation behind Bitcoin’s recent plunge.
III. Bitcoin’s Plunge: The $76K Support Battle and Triple-Squeeze Selling Pressure
In mid-May 2026, Bitcoin underwent a fresh, sharp correction amid the confluence of multiple macro headwinds—the steepest since the start of 2026. It fell from near $82,000 to $76,800, a roughly 6% decline, with over $304 million in leveraged long positions liquidated across the market. Notably, this downturn’s uniqueness lies in the simultaneous emergence of three distinct selling signals—making it difficult for market participants to dismiss it as mere technical correction.
The first source of selling pressure came from persistent outflows from ETF institutional funds. Starting May 7, 2026, U.S. spot Bitcoin ETFs recorded consecutive daily net outflows; a single-day outflow of $648 million marked the highest since January 29. Cumulative net outflows since May 7 exceeded $1.5 billion. This scale of institutional capital flight signals a fundamental shift in how institutions price Bitcoin—not as an asset benefiting from loose monetary conditions, but rather as a traditional risk asset subject to conventional hedging frameworks. ETF outflows are both a consequence and cause of falling prices: price declines trigger algorithmic stop-losses, which further intensify selling pressure—creating a self-reinforcing negative feedback loop.
The second source stems from active selling across both spot and perpetual futures markets. Glassnode data shows spot market cumulative volume imbalance plummeted from +$16.9 million to −$126.2 million, while perpetual futures cumulative volume imbalance registered a sharply negative −$368.5 million. Simultaneous negative imbalances across both markets indicate deliberate, proactive selling—not passive liquidations. Historically, such dual-market proactive selling often heralds more prolonged selling pressure, as passive liquidations are one-off events, whereas active selling reflects sellers’ sustained bearish outlook.
The third source arises from a sharp uptick in hedging demand in the options market. The 25-Delta skew surged from 10.9% to 14.4%, indicating significantly increased market demand for downside protection. Higher skew reflects stronger relative demand for put options—an instinctive reaction by institutional investors facing systemic risk exposure. Vikram Subburaj, CEO of India’s Giottus exchange, noted Bitcoin’s first key support level sits near $76,000, with secondary support between $74,000 and $75,000; a break below this zone could trigger deeper corrections. On-chain analysis reveals the $76,000–$75,000 range corresponds to pre-ETF-driven rally levels in 2024 and represents a dense concentration of leveraged positions. A breach here could unleash a cascade of technical stop-loss selling.
IV. Resurgent Stagflation Risk: The Dual Squeeze of Sticky Inflation and Slowing Growth
U.S. April CPI rose 3.8% year-on-year—the highest since June 2023—while PPI surged 6% y/y and jumped 1.4% m/m, the largest monthly gain since 2022. The probability of stagflation (i.e., a stagflation shock occurring before year-end) spiked from 11% to 40% in just one month, signaling rapidly escalating market pricing of stagflation risk. What makes these figures alarming is not only their magnitude, but their fatal compression of the Fed’s policy space: traditionally, slowing growth warrants rate cuts—but elevated inflation prevents them; fighting inflation requires hikes—but emerging signs of economic slowdown constrain hiking room. The Fed finds itself trapped in a “dual dilemma,” and the persistence of this impasse constitutes the market’s greatest source of uncertainty.
The impact of rising stagflation risk on crypto markets is particularly complex. From a nominal-rate perspective, high inflation pushes up nominal rates, raising the risk-free return benchmark and increasing the opportunity cost of zero-yield assets like Bitcoin. From a real-rate perspective, if nominal rates rise less than inflation, real rates could still fall—leaving Bitcoin with some theoretical support. Yet the distinctive feature of this cycle is the Fed’s notably lagging policy response: markets have already begun repricing hikes, while the Fed remains in a transitional phase under its new chair. This “policy vacuum” deprives markets of reliance on the implicit “Fed put”—the central bank’s tacit promise to step in and stabilize markets during sharp declines—thereby amplifying downside volatility.
Meanwhile, global risk assets are experiencing synchronized declines. South Korea’s KOSPI plunged 6.12% in a single day, briefly triggering circuit-breaker mechanisms; Japan’s Nikkei 225 fell 6.22%; the Nasdaq dropped 1.54%; and China’s Shanghai Composite fell 2.5% over two days. This cross-market synchronicity confirms this correction is not isolated to crypto—it is a systemic reflection of global liquidity tightening across all risk assets. The bond market has sounded the alarm—not just for crypto, but for the AI bull run too: when the “safety cushion” of risk-free rates vanishes, all high-valuation assets dependent on discounted future cash flows face repricing pressure.
V. Market Structure Observations: Institutionalization and Internal Divergence
Despite the sharp short-term price drop, the institutionalization of crypto markets has not been interrupted by this correction. Galaxy Digital successfully delivered Phase 1 of its inaugural institutional Bitcoin compute-related investment product, completing timely, on-budget delivery of the first Data Hall to CoreWeave (CRWV)—marking the substantive commercialization of Bitcoin mining infrastructure’s transition into AI/HPC compute leasing. This continued structural trend indicates that institutional capital continues to systematically allocate to crypto’s underlying assets over the long term—not abandoning strategic positioning due to short-term volatility.
Simultaneously, divergence within the crypto mining sector is intensifying. Keel Infrastructure (formerly Bitfarms) reported Q1 2026 results on May 2026, posting a net loss of $145.4 million and a 23% year-on-year revenue decline to $37 million. Yet its stock rose over 8% on the earnings release day. Market focus shifted away from the losses themselves toward whether its 2.2 GW AI/HPC data center development pipeline can convert into formal leases between 2027 and 2028. This narrative—“exchanging Bitcoin mining tail-end assets for long-term AI infrastructure lease contracts”—has emerged as the most market-validated logic driving the mining sector’s transformation.
On-chain data likewise reveals a divergent pattern of “accumulation amid panic.” While ETF funds saw massive outflows, Bitcoin net inflows into exchanges accelerated, with ~$1.68 billion per week flowing into cold wallets—indicating some long-term holders are accumulating opportunistically at lower prices. Supply from long-term holders has stabilized, and selling pressure from high-cost holdings ($100,000–$126,000) has largely subsided—signaling a substantial release of latent selling pressure. Historically, when derivatives markets reach extreme bearish positioning—e.g., 30-day funding rates at the 6th percentile, the lowest since early 2023—they tend to precede sharp rebounds rather than sustained declines. When nearly all participants are short, additional selling pressure is limited—but any positive catalyst can trigger massive short-covering, fueling a “V-shaped reversal.”
VI. Conclusion: Three-Scenario Outlook and Investment Framework
Looking ahead to late May and June 2026, three potential scenarios for crypto markets merit close attention, along with their respective probabilities and triggers. The most probable scenario is “range-bound consolidation”: Bitcoin finds technical support in the $75,000–$77,000 range, allowing markets time to digest macro headwinds while awaiting new catalysts. If bond yields stabilize and $76,000 holds as effective support, the market may enter a 2–4-week consolidation phase before signaling its next directional move. Under this scenario, crypto markets exhibit a “can’t fall further, can’t rise either” dynamic, with alpha opportunities arising more from individual coin selection than from broad-based long exposure.
The bullish scenario requires convergence of two or more positive catalysts: first, explicit dovish signals from the Fed or Warsh (e.g., a dovish tone at the June FOMC meeting); second, tangible de-escalation in Middle East geopolitics (e.g., the Strait of Hormuz issue returning to negotiations); third, confirmation that April’s inflation data marks a peak and begins trending downward. If all three align, renewed rate-cut expectations would propel Bitcoin swiftly back above the $80,000 psychological barrier and potentially challenge the $85,000–$87,000 range. Currently, the probability of this scenario is estimated at ~25%, with the primary obstacle being Warsh’s unlikelihood of pivoting quickly to accommodation early in his tenure.
The bearish scenario is the most pressing risk to monitor: should the 30-year U.S. Treasury yield continue climbing and decisively breach the 5.2%–5.3% range, rapidly rising risk-free rates would open downside space to $74,000–$75,000; an extreme tail risk would see the $54,000–$38,000 channel reopen (per Stifel’s trendline analysis), implying full retracement of the 2025 bull market gains and a dramatically extended bear market. The current probability of this scenario is ~20%, though its risk–reward profile is highly asymmetric—if $74,000 support breaks, algorithmic stop-losses could trigger cascading selling, driving prices well beyond fundamentals.
In summary, markets now sit at a structural inflection point defined by concurrent “macro stress testing” and deepening “institutionalization.” The bond market’s alarm remains unaddressed, and the $76,000–$75,000 support zone faces severe scrutiny. Yet against the backdrop of extreme pessimism, persistent accumulation by long-term holders, and the ongoing evolution of the mining transformation narrative, bottoming signals are gradually coalescing. Investors at this stage should maintain portfolio flexibility—avoiding aggressive chasing of rallies or heavy bottom-fishing—and patiently await the emergence of macro turning points. When the “Fed put” regains credibility and bond yields turn downward, crypto markets will be poised for a new leg up—grounded in far more solid macro foundations.
Join TechFlow official community to stay tuned
Telegram:https://t.me/TechFlowDaily
X (Twitter):https://x.com/TechFlowPost
X (Twitter) EN:https://x.com/BlockFlow_News