Bitcoin’s $78,000 support faces its ultimate test: surging U.S. Treasury yields and inflationary pressures are opening the door to $75,000.
TechFlow Selected TechFlow Selected
Bitcoin’s $78,000 support faces its ultimate test: surging U.S. Treasury yields and inflationary pressures are opening the door to $75,000.
Can 78,000 hold? If not, the next stop is 75,000.
Author: Gino Matos
Translated by: TechFlow
TechFlow Intro: After failing to break above $82,000, Bitcoin declined for two consecutive days, falling into the $78,000 support zone. U.S. 10-year Treasury yields approached 4.6%, while 30-year yields breached 5.13%. Combined with April CPI accelerating to 3.8%, and oil prices surging past $105, the macro environment has turned extremely hostile toward risk assets. ETF fund flows also turned net outflows at this critical juncture. Can $78,000 hold? If not, the next stop is $75,000.
$78,000: Failure Here Leads Straight to $75,000
Bitcoin hit an intraday low of $77,711 before rebounding slightly to around $78,225—marking the second consecutive trading day under macro pressure.
U.S. 10-year Treasury yields rose to 4.599%, while 30-year yields jumped 11.8 basis points to 5.131%, reaching their highest level since May 2025. BTC has fallen 3.9% from its May 15 opening price above $81,000, with U.S. equities and bond markets weakening in tandem.
Once BTC lost $82,000, the $77,700–$78,000 range became the next key support zone. Now, this support is bearing the full weight of macro pressures.
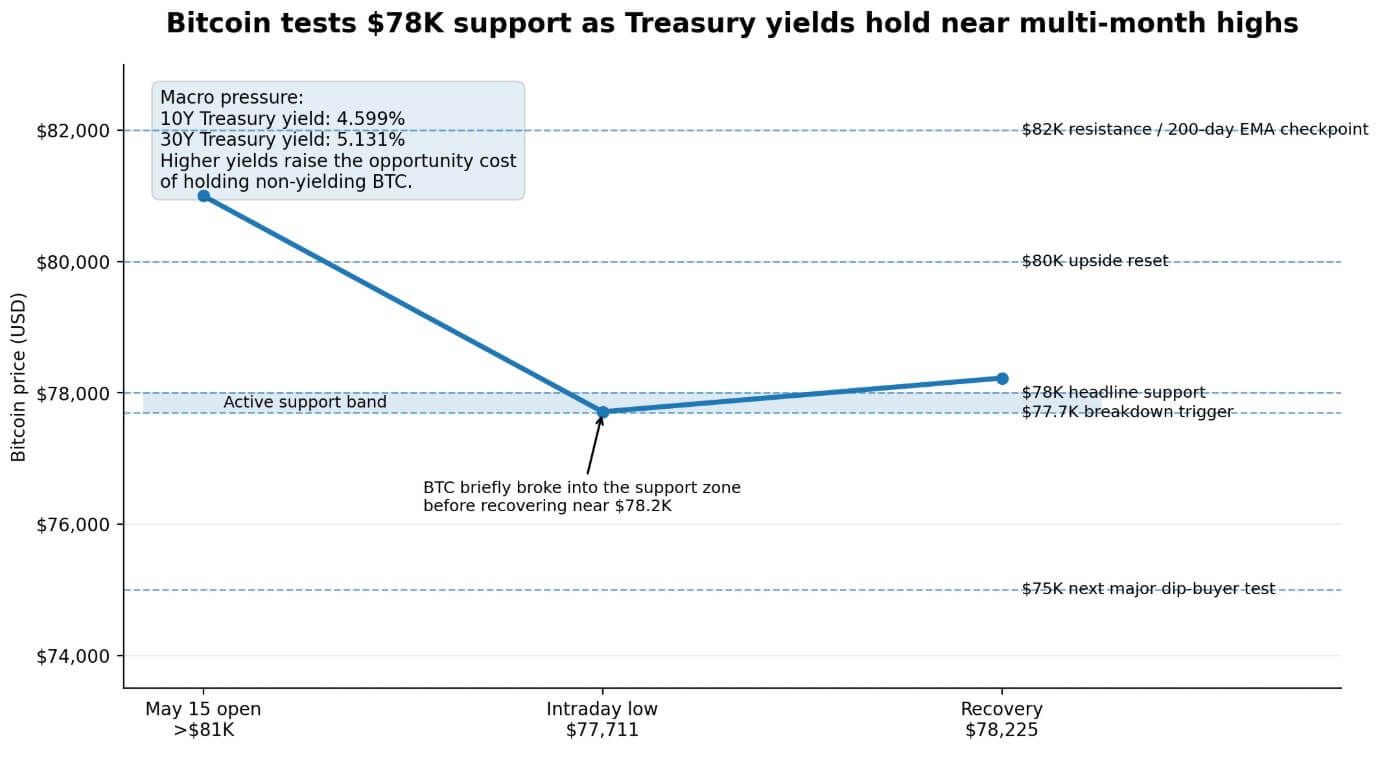
Caption: Bitcoin dropped from its May 15 opening price above $81,000 to an intraday low of $77,711, then rebounded to $78,225—now testing the $77,700–$78,000 support band.
The Weight of Macro
Bitcoin is a zero-yield asset, now competing directly with U.S. Treasuries offering 4.5%–5.1% yields. With the “interest rate floor” raised to this level, the opportunity cost of holding BTC has surged sharply.
Data from K33 shows Bitcoin’s 30-day correlation with Nasdaq futures exceeds 0.7. When the Nasdaq falls sharply, BTC’s beta amplifies further. Both transmission channels are simultaneously active in this sell-off, while the macro environment leaves the Fed almost no room for easing.
April CPI accelerated year-on-year to 3.8%, up from 3.3% in March. Core CPI held steady at 2.8%, while the energy component rose 17.9% over the past 12 months.
WTI crude closed at $105.42 on May 15—up 4.2% that day and 11.33% for the month. Brent crude hit $109.26, rising 3.35%. Trading Economics’ model forecasts Brent to reach $111.28 by quarter-end; HSBC has raised its 2026 Brent forecast to an average of $95 per barrel—and if supply agreements are delayed until late summer, the average could reach $110.
University of Michigan’s May survey shows one-year inflation expectations rose to 4.5%. In its April FOMC statement, the Fed emphasized it would first assess inflation before considering any easing. The bar for policy relief remains exceptionally high.
ETF Flows Falter at a Critical Moment
CoinShares data shows Bitcoin investment products attracted $706.1 million in net inflows for the week ending May 11—indicating continued strong institutional buying.
However, Farside Investors’ daily data reveals a sharp reversal: $630.4 million in net outflows on May 13, a modest $131.3 million inflow on May 14, and another $290.4 million outflow on May 15.
Two out of three days saw outflows. The ETF funding buffer—which had previously absorbed macro headwinds—vanished precisely when the $78,000 support needed defending most.
Support Map
The intraday low of $77,716.09 has already landed within the support zone. If the daily close rebounds above $78,000, this pullback remains technically manageable.
Should $77,700 be decisively breached, the downside path opens: $76,500 becomes the first immediate target; once bears confirm the breakdown, $75,000—the historic round-number threshold where bottom-fishing capital must deploy real capital—comes into focus.
If the decline extends further, the $73,000–$74,000 range enters view. At that point, market narrative shifts from “correction” to “macro-driven de-leveraging across risk assets.”
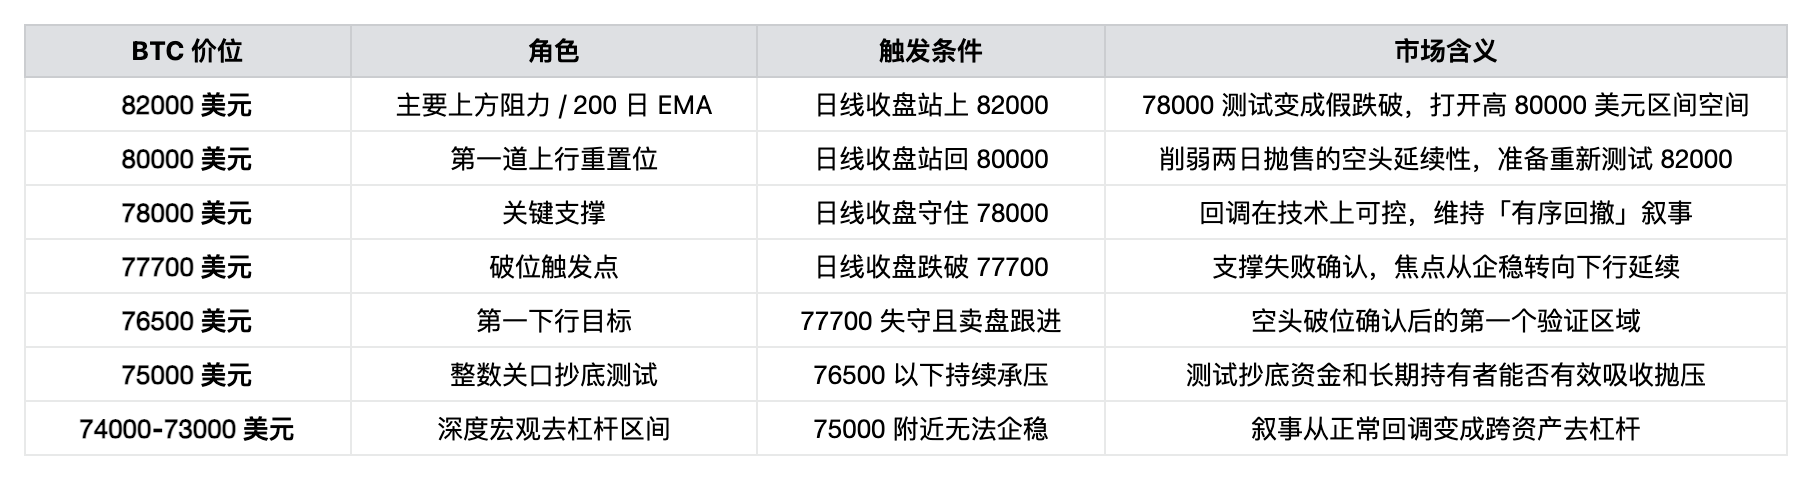
A daily close back above $80,000 would mark the first step in reversing the bearish structure—breaking the sequence of lower lows over the past two trading days and giving bulls a clean technical reset.
The tougher hurdle lies at $82,000. On May 13, BTC broke below its 200-day moving average (roughly near $82,000), making this level both a psychological resistance and a key technical barrier. A daily close above $82,000 would render the recent test of $78,000 a false breakdown.
Four Scenarios

What to Watch Next
If 10-year yields retreat below 4.50%, oil cools from above $105, and ETF flows turn positive again, Bitcoin could reclaim $80,000. That would break the pattern of lower lows over the past two days, paving the way for a retest of $82,000—the 200-day MA level BTC breached on May 13.
A daily close above $82,000 would transform the yield-driven correction into a false breakdown, opening space toward the upper $80,000s. Last week’s decline would then be viewed retrospectively as a shakeout-style pullback, leaving the underlying accumulation thesis intact.
Conversely, if BTC closes daily below $77,700 while Treasury yields remain near 4.60% and ETF outflows persist, the support test is confirmed as failed. $76,500 becomes the first downside target; once bears confirm the breakdown, a new leg down begins. $75,000—the round-number threshold—will demand genuine buying power from bottom-fishing capital.
If weakness continues below $75,000, the $74,000–$73,000 range comes into view. At that point, the narrative ceases to be “crypto market correction” and becomes “cross-asset macro de-leveraging”—with equities and bonds repricing in tandem, and BTC simply along for the ride.
The macro variables currently driving Bitcoin’s short-term direction must first stabilize before a meaningful rebound anchor can form. With 10-year yields at 4.599% and 30-year yields at 5.131%, Treasury holders enjoy a 4.5%–5.1% yield floor. As a zero-coupon asset, BTC faces a structural disadvantage in this interest-rate spread. With one-year inflation expectations at 4.5% and the Fed still in “assessment mode,” rapid easing remains far removed from market pricing.
The $78,000 zone faces a structural test: Can ETF buyers and long-term holders absorb selling pressure fast enough amid rising interest-rate costs—holding the line before the support floor gives way?
Join TechFlow official community to stay tuned
Telegram:https://t.me/TechFlowDaily
X (Twitter):https://x.com/TechFlowPost
X (Twitter) EN:https://x.com/BlockFlow_News