The Final Movement of the Crypto Economy Trilogy: Interest Rates
TechFlow Selected TechFlow Selected
The Final Movement of the Crypto Economy Trilogy: Interest Rates
This round of price increase is more the result of combined market sentiment and safe-haven demand, rather than the sole effect of interest rate cuts.
Author: Musol
"Interest rates, interest rates, and still interest rates!"
Readers who have been following the crypto market for some time are likely aware—cryptocurrency markets are highly sensitive to U.S. interest rate decisions. Bitcoin often acts as a signal reflecting volatility driven by the Federal Reserve, and this phenomenon has intensified amid constant discussions of rate cuts this year. Looking back at previous markets, perhaps since the Federal Reserve began aggressively raising interest rates in 2022 to combat runaway inflation, digital assets have already begun reflecting the volatility of traditional financial markets—the Fed's interest rate decisions have become make-or-break moments for the crypto market.
"This correlation won't disappear anytime soon; if anything, it's becoming the new normal."
There's a common joke circulating in the market—"We've all become U.S. stock traders," because not only does the crypto market closely follow movements in U.S. equities, but traders must also keep a close eye on U.S. economic data.
Foremost among these is the Federal Reserve interest rate, one of the most critical data points. So, why should we care about this data, and what do these figures actually mean?
What Are the Federal Reserve & Interest Rates?
The Federal Reserve is the central bank of the United States, equivalent to China’s People’s Bank of China, responsible for setting interest rate policy. However, the Fed operates with high independence—principally, it makes interest rate decisions independently, without bowing to the U.S. government or even the President. Simply put, the U.S. President has no authority to interfere with the Fed’s decisions.
The Federal Reserve independently sets interest rates based on its assessment of macroeconomic conditions—either raising or lowering the benchmark interest rate, commonly known as rate hikes or cuts.
In general, the Federal Reserve may take one of three actions regarding interest rates:
Holding rates steady: signals market stability, with no significant impact on economic indicators
Rate hikes: curb inflation through contractionary monetary policy
Rate cuts: stimulate the economy through expansionary monetary policy
Typically, when we refer to Federal Reserve rate hikes/cuts, the actual adjustment targets the federal funds rate, which is the interest charged on loans between banks.
Take rate hikes as an example: When the Fed raises rates, it increases the federal funds rate. The cost of interbank borrowing rises, prompting banks to increase their reserves to control costs. The primary way to boost reserves is by raising deposit rates, encouraging people to deposit money into banks. The end result is that dollars flow into banks and the amount of currency in circulation decreases, helping to curb inflation.
Fed rate hikes lead to dollar appreciation (due to higher demand), causing more dollars to flow into banks and less capital to flow into investment markets like stocks—bearish for risk assets.
Conversely, when the Fed cuts rates (commonly referred to as "easing" or "printing money"), more dollars circulate, leading to dollar depreciation and increased capital flowing into stock and other investment markets—bullish.
We’ll pause here on the basics of Fed rates. To help readers better understand their relationship with crypto markets, this article will systematically examine how these rate decisions relate to Treasury yields, the U.S. Dollar Index, gold and oil prices, the yuan exchange rate, and the broader connection between central bank policy and economic growth.
I. The Relationship Between Fed Rate Decisions and U.S. Treasury Yields
U.S. Treasuries, or U.S. government bonds, typically refer to 10-year and 2-year Treasury notes.
Treasury yield refers to the return earned by holding a Treasury bond until maturity. The calculation is simple: total interest received divided by purchase price (Treasury Yield = Total Interest ÷ Purchase Price).
The coupon rate on government bonds is usually fixed—set at issuance and remains unchanged during the bond’s life. This fixed rate determines the interest payments due.
However, Treasury bonds can be traded in capital markets just like stocks, meaning their market price fluctuates. This trading price—not the face value—is what changes. While face value and coupon rate determine repayment amounts, the actual market price is independent.
Because bond prices fluctuate, the denominator in the yield formula changes, which causes Treasury yields to fluctuate as well.
When Treasury prices rise, yields fall. Conversely, when prices fall, yields rise.
Those unfamiliar might mistakenly believe rising Treasury yields indicate strong demand and heavy buying. In reality, rising yields usually reflect widespread selling of Treasuries, driving prices down and thus pushing yields up. Falling yields, on the contrary, suggest investors are buying Treasuries en masse, pushing prices up and yields down.
This applies equally to any national government bond—whether U.S. or Chinese—a rising yield indicates selling pressure, while a falling yield signals strong buying demand.
Government bond yields are inversely related to bond market strength.
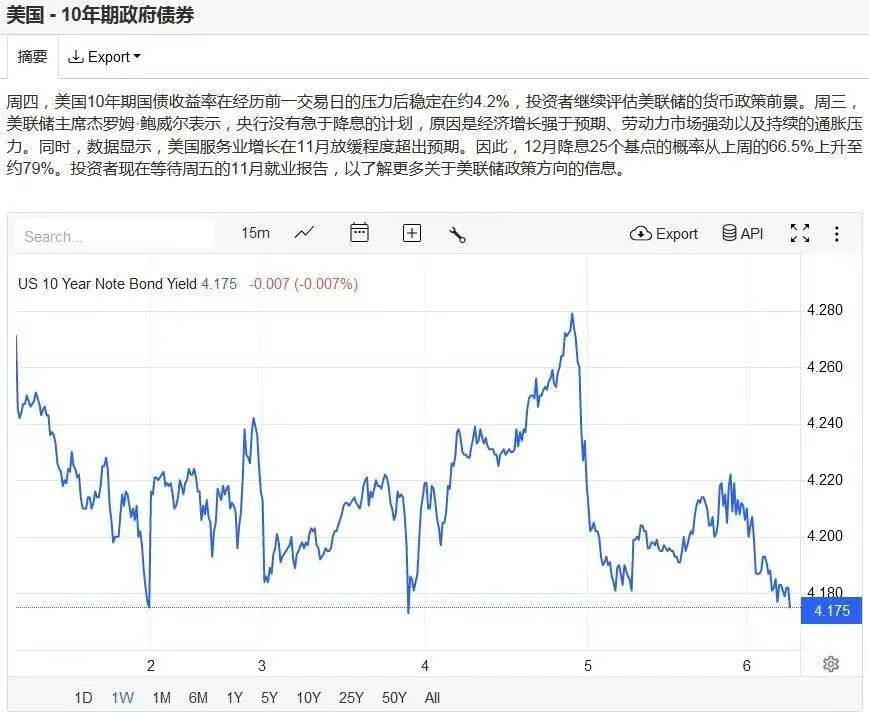
Figure 1: 10-Year U.S. Treasury Yield, December 1–6, 2024
So what is the relationship between Fed rate decisions and Treasury yield fluctuations?
Fed interest rate policy affects bank deposit and lending rates. When the Fed hikes rates, bank deposit rates rise, making deposits more attractive. Since Treasury bond yields are fixed until maturity, higher deposit rates encourage investors to shift funds from bonds to savings or newly issued financial products. This leads to selling of existing Treasuries and reduced demand, causing bond prices to fall and yields to rise. Conversely, rate cuts reduce deposit attractiveness, prompting investors to buy more Treasuries, pushing prices up and yields down.
The two-year Treasury is typically most sensitive to Fed rate moves because its shorter duration makes investors more responsive to near-term interest rate comparisons. In contrast, the 10-year Treasury is less affected by short-term rate changes, as future rate shifts over a decade remain uncertain.
Therefore, Fed rate hikes lead to higher Treasury yields, while rate cuts lead to lower yields.
From 2022 to the second half of 2024, the Fed maintained a hiking cycle, raising rates from 0% to 5.5% (Figure 2). During this period, the 10-year Treasury yield climbed from under 2% to a peak of 5% (Figure 3).
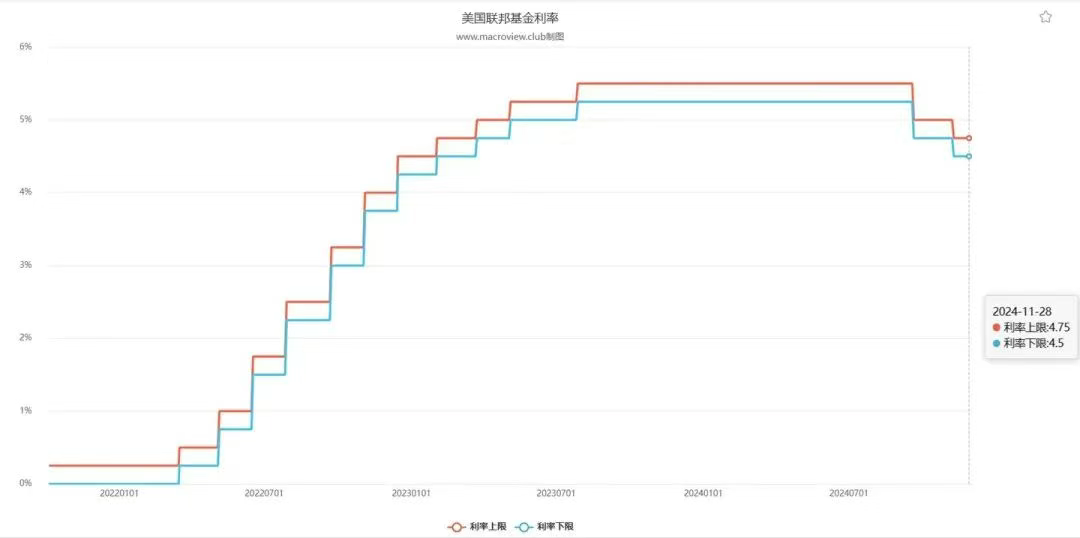
Figure 2: U.S. Benchmark Interest Rate, January 2022 – December 2024
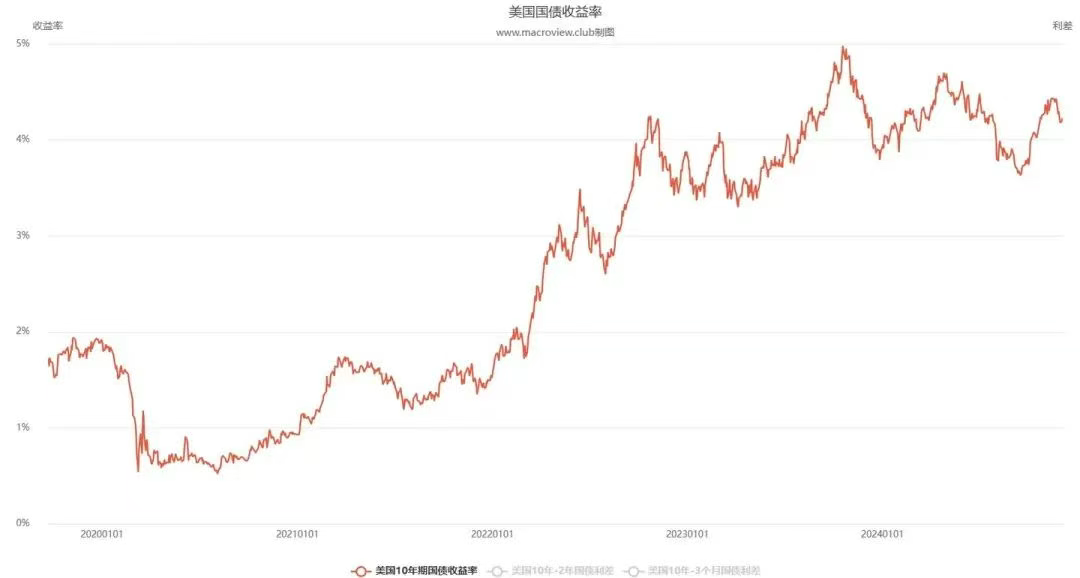
Figure 3: 10-Year U.S. Treasury Yield, January 2020 – December 2024
II. The Relationship Between Fed Rate Decisions and the U.S. Dollar Index
The U.S. Dollar Index measures the dollar’s exchange rate against other major currencies. A higher index means a stronger dollar; a lower index means a weaker dollar.
When the Fed hikes rates, both deposit and lending rates rise. Higher deposit rates attract more funds into banks, reducing money in circulation. Since deposit rates represent the cost of funding for banks, higher rates lead to higher loan rates. Increased borrowing costs discourage loans by businesses, individuals, and governments, further reducing circulating money supply.
In short, Fed rate hikes cause more dollars to be deposited in banks, reducing the amount of dollars in circulation.
In foreign exchange markets, currency strength depends directly on supply and demand. Reduced dollar supply ultimately drives the Dollar Index upward.
Conversely, rate cuts lower deposit and lending rates. Lower deposit returns discourage saving, increasing liquidity. Lower loan rates encourage more borrowing, further increasing money supply.
In short, Fed easing pushes more dollars into circulation and fewer into banks.
In forex markets, increased dollar supply weakens the Dollar Index.
Thus, there is a positive correlation between Fed interest rates and the Dollar Index. This relationship generally holds across countries—higher interest rates tend to strengthen a nation’s currency.
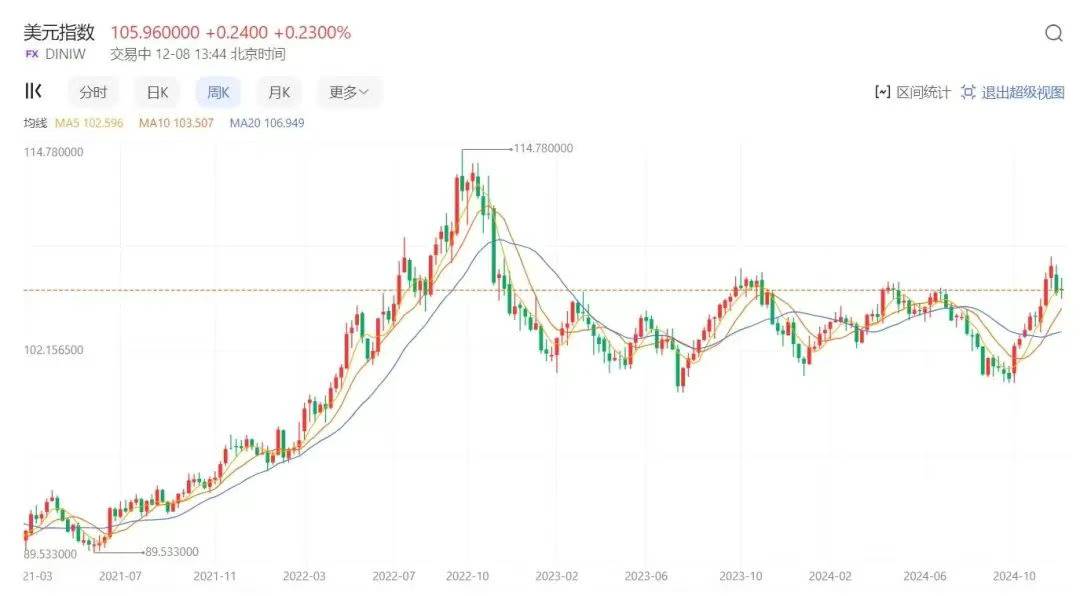
Figure 4: U.S. Dollar Index, July 2021 – December 2024
III. The Relationship Between Fed Rate Decisions, the Dollar Index, and Prices of Gold and Oil
On international markets, gold and crude oil are priced in U.S. dollars. When the dollar strengthens, its purchasing power increases—meaning each dollar can buy more gold and oil, leading to lower commodity prices. Conversely, a weaker dollar reduces purchasing power, pushing prices up.
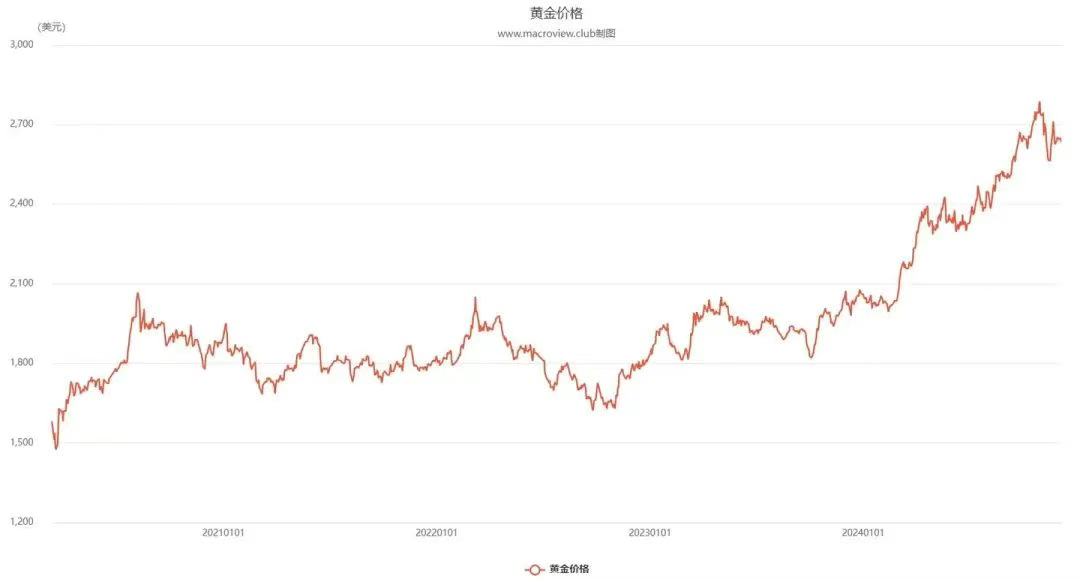
Figure 5: Gold Price, January 2021 – December 2024
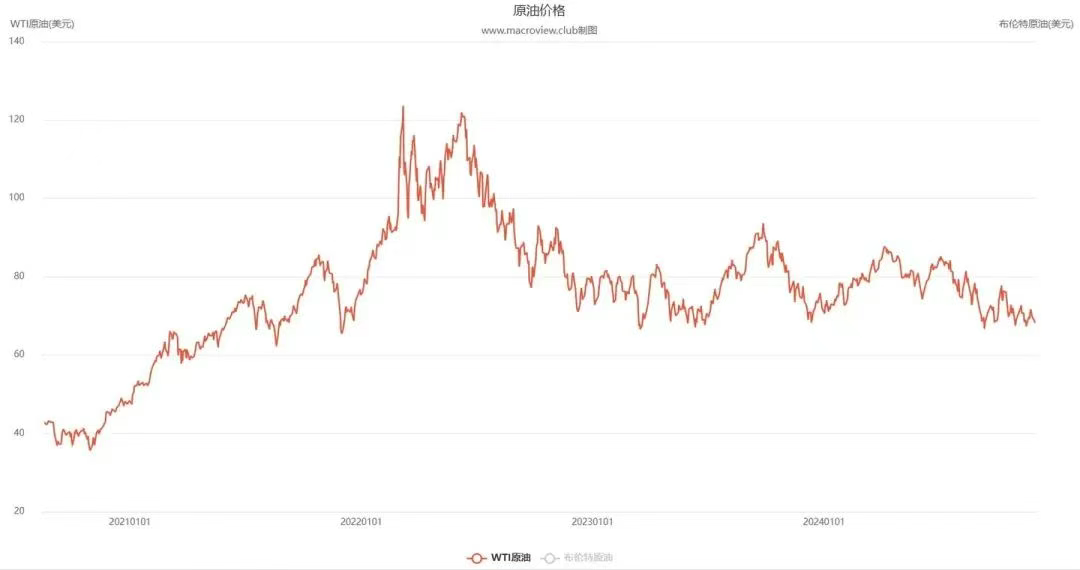
Figure 6: Crude Oil Price, January 2021 – December 2024
Understanding this logic reveals the close link between Fed rate decisions, the Dollar Index, and commodity prices.
When the Fed hikes rates, the Dollar Index strengthens, causing gold and oil prices to fall. When the Fed cuts rates, the Dollar Index weakens, pushing gold and oil prices up.
This describes the theoretical and direct relationship between these variables. However, actual gold and oil price movements may not always follow this pattern, as they are influenced by multiple factors.
IV. The Relationship Between Fed Rate Decisions, the Dollar Index, and RMB Exchange Rate
With the above foundation, this section becomes straightforward. In forex markets, a stronger dollar means other currencies weaken against it—and vice versa.
Therefore, when the dollar appreciates, the RMB depreciates relatively, and when the dollar depreciates, the RMB appreciates relatively.
When the Fed hikes rates, the Dollar Index strengthens and the RMB exchange rate weakens. When the Fed cuts rates, the Dollar Index weakens and the RMB exchange rate strengthens.
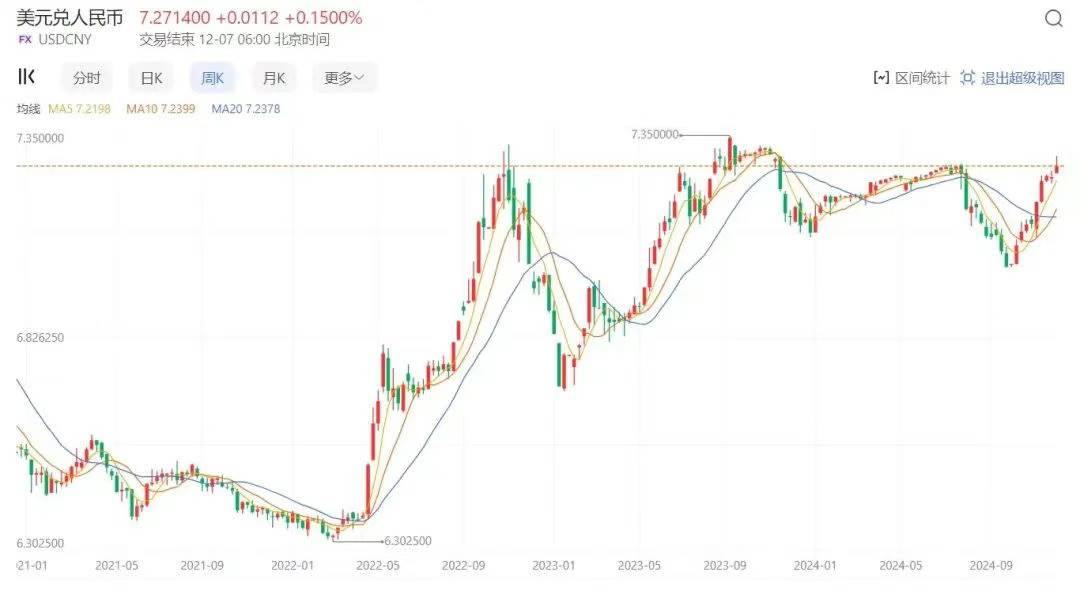
Figure 7: RMB Exchange Rate, January 2021 – December 2024
Note: In forex markets, the RMB exchange rate is commonly quoted as offshore RMB (CNH), not as how many USD one RMB can buy, but rather how many RMB one USD can buy—because the U.S. dollar is the global standard. Thus, when this number rises, the RMB is weakening (each dollar buys more RMB); when it falls, the RMB is strengthening. Don’t confuse this relationship.
Under floating exchange rates with free capital flows, when the Fed hikes rates, other currencies—including the RMB—passively depreciate against the dollar. To prevent such depreciation, other central banks may need to hike rates in tandem to offset the Fed’s move. Conversely, when the Fed cuts rates, other currencies passively appreciate, so central banks may need to cut rates too to counteract the effect.
This undermines independence in domestic monetary policy. Countries like Canada, South Korea, Brazil, Argentina, and Hong Kong either follow the Fed’s lead or accept the exchange rate consequences. This is a manifestation of U.S. dollar hegemony.
This explains why we often hear criticism from various countries about Fed monetary policy—because the Fed’s rate decisions directly affect their own currency values and central bank policies.
As to whether such criticisms are justified, those who understand know the truth: every country’s monetary policy must—and can only—serve its own national interests. It cannot simultaneously consider the interests of others. Even if a country tries to account for others’ interests while pursuing its own, it lacks the power to achieve both.
Therefore, complaints about Fed monetary policy are meaningless and ineffective. Only true strength ensures independence.
V. The Relationship Between Fed or Central Bank Rate Decisions and Economic Growth
The market is an invisible hand guiding economic activity—but this hand has a flaw: it lacks a brake. Like a car without brakes, it cannot anticipate accidents and slow down. Without intervention, the market cannot prevent recessions or crises, resulting in endless cycles of boom and bust.
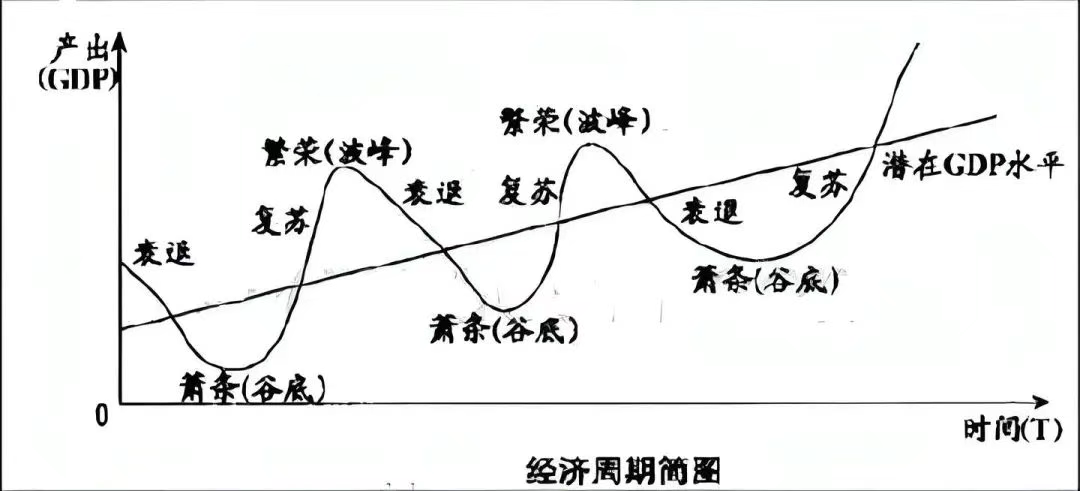
Figure 8: Business Cycle Diagram (An old classic, apologies)
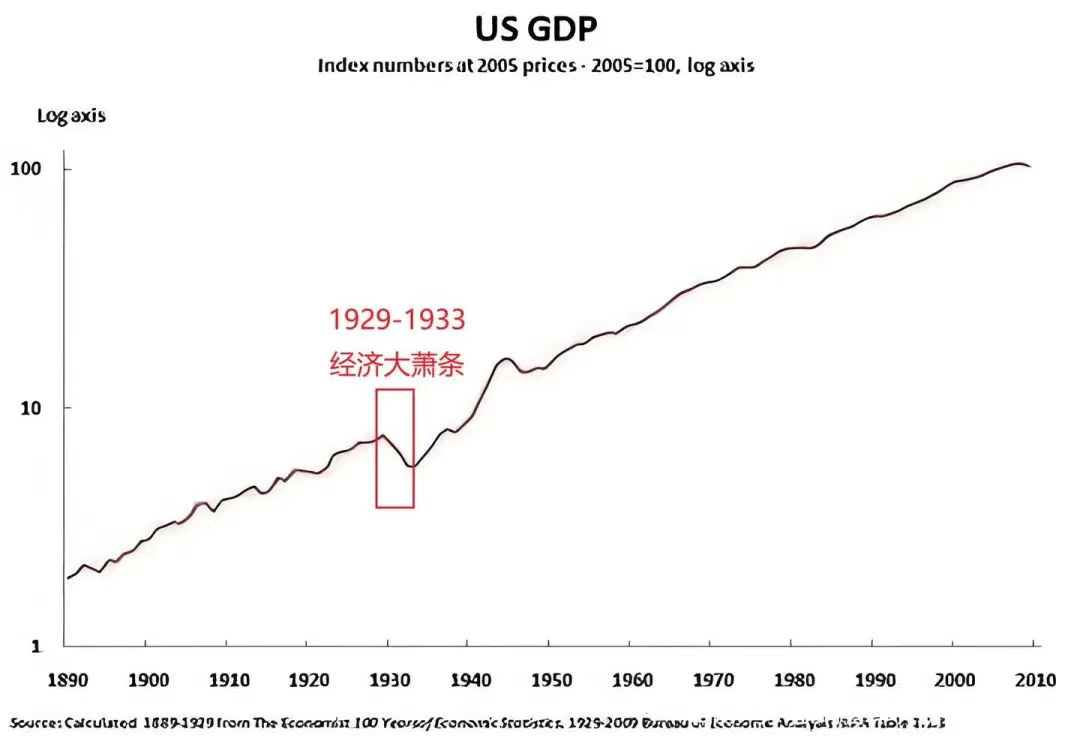
Figure 9: U.S. Economic Boom Preceding the 1929 Great Depression
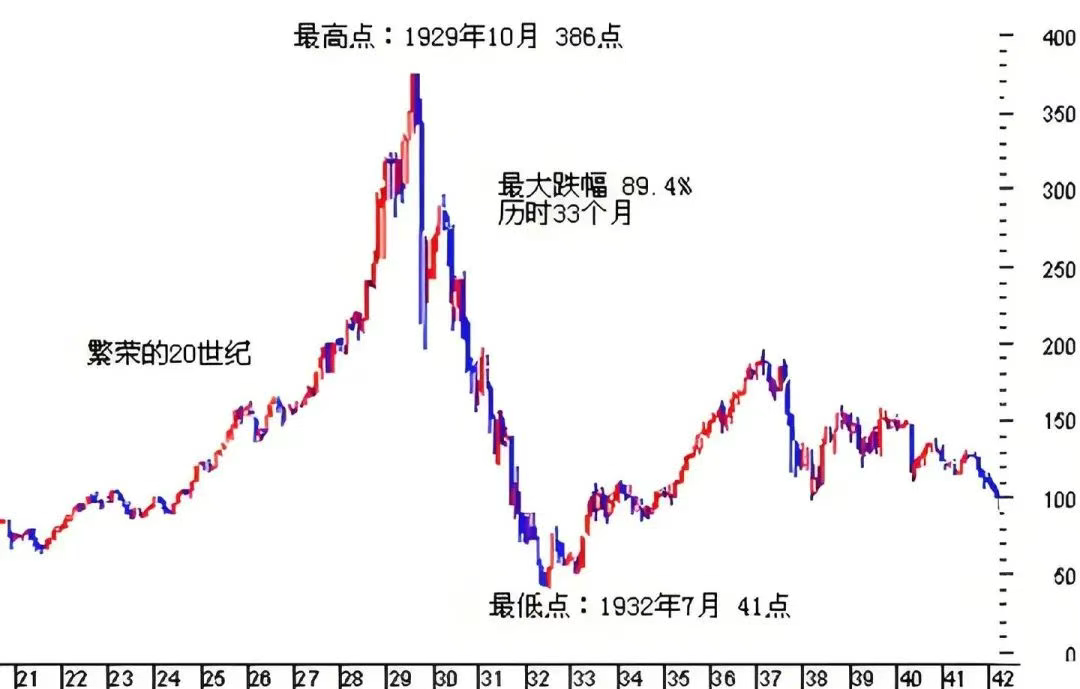
Figure 10: Dow Jones Industrial Average Around 1929
The reason lies in this: capital is the lifeblood of markets, and capital chases profit. Wherever profits exist, capital flows there—this is the rule of the invisible hand.
For example, when a new industry emerges, supply is low and demand high, leading to high prices and profits. Capital floods in, supply increases—from shortage to balance to oversupply—prices drop or crash, profits vanish, and the industry collapses. Only then does the market self-correct as capital exits and supply shrinks, restarting the cycle. This is the market mechanism: from undersupply to equilibrium to oversupply, from growth to saturation to decline and crisis—endlessly repeating.
The entire economy follows this same pattern.
Recognizing this flaw in the invisible hand, we realize we must install a “brake”—we cannot let the market run freely. That brake is “government macroeconomic regulation.”
We must anticipate crises and act early—apply the brakes appropriately.
Interest rate policy is a key tool in macroeconomic management.
When the economy grows strongly, the Fed may raise rates to reduce money supply, encourage saving, reduce consumption, and thereby lower demand. Higher borrowing costs also reduce investment, slowing supply growth.
Conversely, during weak growth or recession, the Fed cuts rates to expand money supply, discouraging saving and boosting spending and investment, increasing both demand and supply.
Thus, the Fed uses interest rates to balance supply and demand, aiming for sustainable, healthy economic growth—avoiding overcapacity, hyperinflation, deflation, recession, depression, and crisis.
The ideal scenario is economic growth with stable prices—or price increases far below income growth. This is optimal growth.
If our incomes grow faster than prices, we can afford more and better goods, companies earn more, and society becomes wealthier—leading to sustained prosperity and rising happiness. This is the virtuous spiral of economic growth.
China’s nearly 40 years of rapid growth since reform and opening-up exemplifies this virtuous spiral: fast GDP growth, rising incomes, and inflation consistently below income growth—continuously increasing purchasing power.
Readers may also reflect on today’s situation.
From 1978 to 2017, China’s economy (GDP) grew at an average annual rate of about 9.5%, per capita disposable income rose about 8.5%, and prices increased about 4.86% annually.
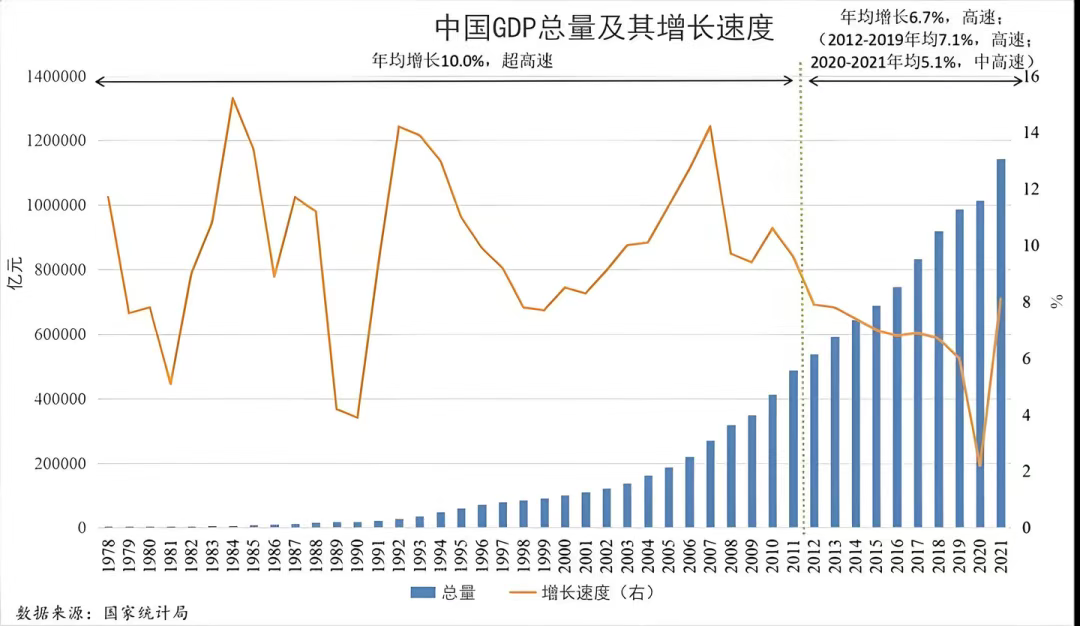
Figure 11: China’s GDP Growth After Reform and Opening-Up
Remember, GDP fundamentally measures total social output—the total volume of goods and services produced. More production means a wealthier society. This output is measured in monetary terms—converted into monetary value, yielding familiar figures like “trillions.” But these numbers alone are meaningless; real wealth depends on the actual goods and services behind them. Hence, we distinguish between nominal and real GDP growth.
Nominal GDP growth calculates GDP using current prices without adjusting for inflation—it doesn’t necessarily reflect real growth. For instance, if prices rise while output stays flat, nominal GDP increases purely due to price changes, not real wealth creation. Real GDP growth removes inflation effects by valuing current and past output at constant prices—only changes under this method reflect true shifts in output and wealth.
We now return to the relationship between interest rate decisions and economic growth.
The Fed bases its rate decisions on assessments of current economic conditions, primarily GDP growth, CPI, and employment data. Among these, the core indicator is CPI—the Consumer Price Index—which is also the main target of Fed policy.
CPI is seen as the best gauge of economic health. During expansion, rising incomes increase demand, pushing prices up. During downturns, falling incomes reduce demand, causing prices to drop.
Therefore, the Fed aims to keep CPI within a reasonable range (around 2%-2.5%).
When CPI exceeds this range, the economy is overheating—risking imbalance, recession, or crisis—so the Fed hikes rates.
When CPI falls below this range, growth is weak or stagnant—so the Fed cuts rates to stimulate the economy.
If CPI stays within range, growth is balanced and sustainable—the Fed holds steady.
Thus, the relationship between Fed rates, economic growth, and CPI is not strictly proportional or inverse.
During healthy, steady growth, rates may stay flat, decline gradually, or even rise slightly to manage inflation. Long-term low rates generally support growth.
The first chart was shown earlier, so we’ll skip detailed repetition. From Q1 2021 to Q2 2022, U.S. CPI surged, reaching 9%, while GDP growth remained strong.

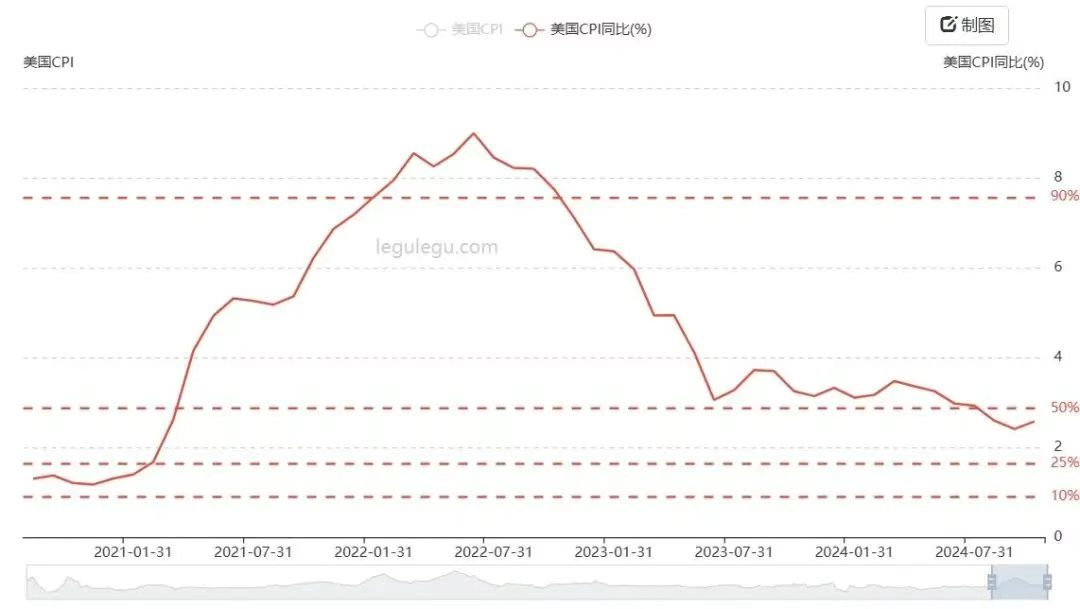
Figure 12: U.S. Year-on-Year CPI, January 2021 – October 2024
To avoid hyperinflation, the Fed maintained rate hikes through the first half of 2024. As rates rose, CPI fell to around 3%, and GDP growth slowed from highs of 6%-7% to 2%-3%. Thus, starting in the second half of 2024, the Fed entered a rate-cutting cycle.
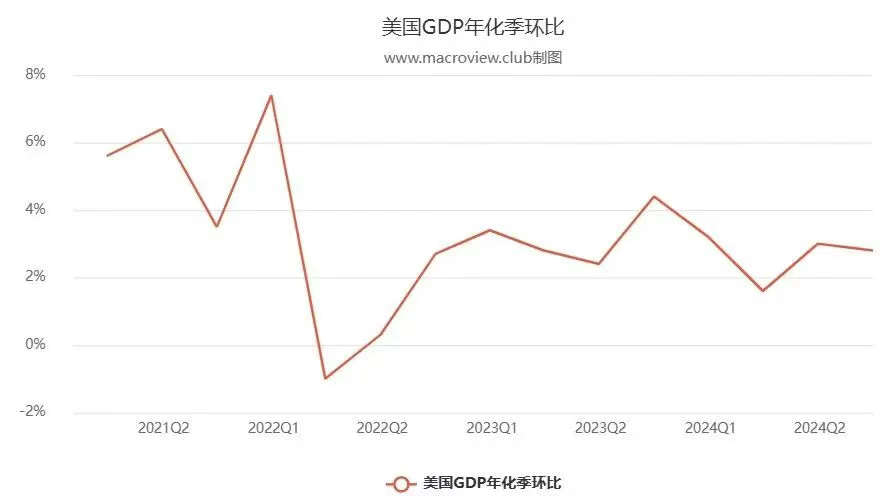
Figure 13: U.S. GDP Growth Rate, Q1 2021 – Q3 2024
The relationship between central bank rate decisions and economic growth is similar across nations.
First, thank you to all readers who made it this far. Reaching this point means you’ve developed a solid understanding of interest rates. Now, let’s discuss the multi-dimensional impacts of Fed rate cuts.
The Multi-Dimensional Impact of Fed Rate Cuts
In today’s deeply interconnected global economy, the Federal Reserve serves as a key global economic barometer. We all know—its rate-cutting policies carry profound international implications.
Rate cuts reduce deposit returns, causing capital to flow out of banks in search of higher-yielding opportunities. This boosts cross-border investments and accelerates signs of global economic recovery.
However, for cryptocurrency markets, the impact of this capital flow is not straightforward—it unfolds across multiple dimensions.
The Market’s Two-Faced Mirror
On one hand, increased liquidity from rate cuts does boost investor risk appetite, making them more willing to allocate funds to high-risk, high-return sectors. Mainstream cryptocurrencies like Bitcoin, with their unique decentralized nature and potential for high returns, have become favorites among new investors.
Additionally, rate cuts often coincide with dollar depreciation, further enhancing the appeal of cryptocurrencies as safe-haven assets (a subtle trend already underway this year), attracting capital seeking preservation of value.
On the other hand, historical data paints a different picture. Despite the theoretical benefits of rate cuts for crypto prices, real-world outcomes are constrained by multiple factors—economic uncertainty, shifting market sentiment, changing policy expectations, and complex investor behavior can all cause crypto markets to move contrary to expectations. For instance, during recessions or periods of high market fear, many investors may actually withdraw funds from high-risk markets, including crypto, to avoid losses.
Looking back at the past 35 years of U.S. rate cycles, the impact of rate cuts on crypto markets is far from consistent. In the 1980s and 1990s, although Fed rate cuts aimed to stimulate growth and fight inflation, asset price rebounds were often delayed and disrupted by economic uncertainty.
In the 21st century, with the rise of crypto markets, the impact of rate cuts has become more complex. During the 2008 financial crisis, the Fed’s rate cuts and quantitative easing provided strong support to risk assets, including cryptocurrencies—but this support was neither unconditional nor permanent. The 2020 rate cuts following the pandemic pushed crypto markets to unprecedented highs, but that surge was driven more by market psychology and safe-haven demand than by rate cuts alone.
The Fed’s rate-cutting policy affects crypto markets in multifaceted, complex, and uncertain ways. Capital isn’t charitable. While rate cuts can boost liquidity, increase risk appetite, and potentially lift crypto prices, this effect is neither one-way nor absolute. In today’s volatile environment, when facing monetary shifts like rate cuts, we must remain calm and cautious, considering the full picture—economic conditions, market sentiment, and policy outlook. Only then can we hope to navigate the ever-changing market successfully.
Mundane affairs flow like tides, people drift like water—how many return from the江湖?
Join TechFlow official community to stay tuned
Telegram:https://t.me/TechFlowDaily
X (Twitter):https://x.com/TechFlowPost
X (Twitter) EN:https://x.com/BlockFlow_News