USDC Supply and Circle Valuation: Deconstructing the Underlying Logic of a $58 Billion Market Cap
TechFlow Selected TechFlow Selected
USDC Supply and Circle Valuation: Deconstructing the Underlying Logic of a $58 Billion Market Cap
This is not merely a capital raise, but also indicates an unmet market demand for stablecoins in the public markets.
Author: Alkimiya
Translation: TechFlow
"Accurate estimation of intrinsic value is the foundation of stable, rational, and potentially profitable investing."
— Howard Marks
Introduction
Circle's landmark public listing highlights growing institutional demand for regulated crypto infrastructure. However, the sustainability of its valuation hinges on the expansion of its core revenue engine—closely tied to the total supply of USDC.
This article shifts from narrative to data measurement. Over 95% of Circle’s revenue comes from channels related to USDC, making it highly sensitive to short-term interest rates and the total circulating supply of USDC. We begin with a structural decomposition of the USDC supply curve, analyzing changes in chain-level concentration, relative capital liquidity, and inflection points under specific market conditions to identify the key variables driving minting activity.
Next, we introduce a recalibrated auto-regressive model capable of forecasting weekly supply within an error margin of approximately ±1.5%, directly translating supply increments into EBITDA sensitivity.
Finally, we demonstrate how this supply metric can serve as a real-time tradable signal, offering market participants a live proxy for Circle’s fundamental dynamics.
Circle Valuation Structure Analysis
With a market capitalization of $58.2 billion, Circle’s price-to-earnings (P/E) multiple exceeds Visa’s by nearly 8 times (Visa trades at ~15x). The strong backing from high-profile institutions like ARK Invest and BlackRock indicates that investors are pricing not just current fundamentals, but also betting on its potential for widespread adoption.
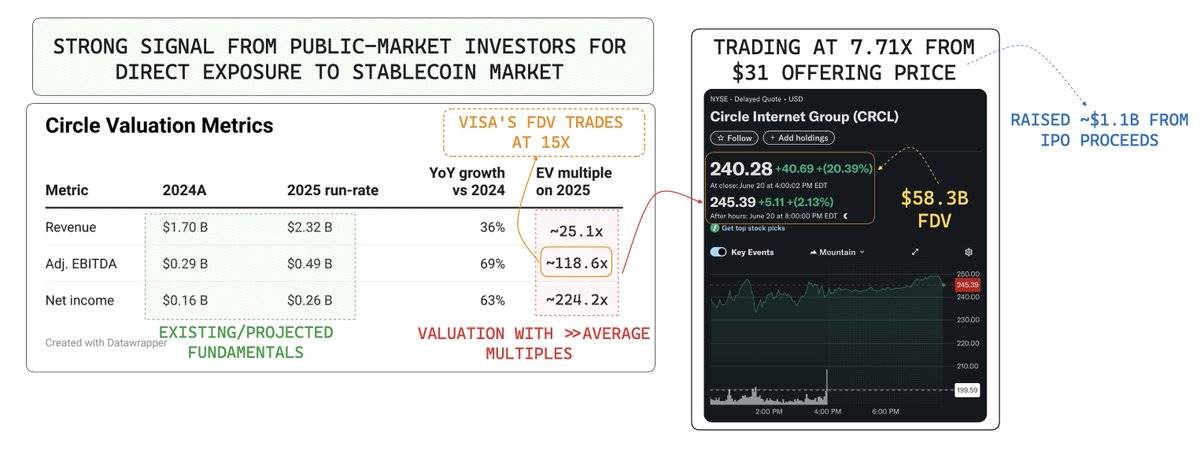
Circle valuation metrics stock ticker screen – Data source: Yahoo Finance
To sustain its current valuation, Circle must continue demonstrating robust profit growth. Historically, over 95% of Circle’s revenue stems from interest and dividends generated by fiat asset reserves backing its stablecoin—such as bank deposits, short-term U.S. Treasuries, and the Circle Reserve Fund managed by BlackRock. As such, its revenue is highly sensitive to short-term interest rates and the circulation volume of USDC.
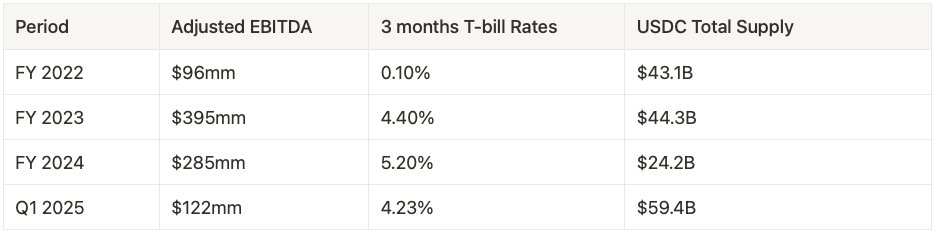
Data source: SEC
EBITDA Sensitivity Decomposition

Where:
-
Net Interest Margin (NIM): Interest income earned from yield-generating assets such as U.S. Treasuries.
-
Supply-driven fees: Fees generated from USDC minting and redemption.
As the Federal Reserve moves toward rate cuts, Net Interest Margin (NIM) will compress. The market is now pricing in a shift where transaction-based revenue growth outpaces the impact of declining interest rates.
This growth depends on continued adoption of USDC as a global payment network, with fee capture expanding alongside transaction velocity, cross-border flows, and ecosystem integration. Therefore, studying USDC supply dynamics is critical—not only as a leading indicator of future revenue, but as a core anchor for valuation, offering real-time insight into the evolution of its business model.
Stablecoin Supply Dynamics Explained
The total stablecoin supply has reached an all-time high of $251 billion, up 34% from the previous cycle peak of $187 billion in 2021, reflecting significant capital inflows and renewed confidence in the crypto ecosystem.
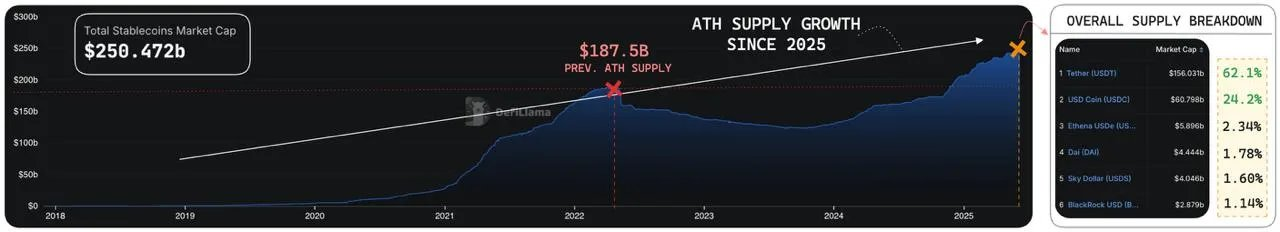
Historical total stablecoin supply – Data source: DefiLlama
Currently, USDT and USDC account for over 86% of the total stablecoin supply, with USDT leading at 62.1% market share and USDC following at 24.2%. These two stablecoins play foundational roles across different ecosystems. USDC, in particular, offers a more transparent lens through which to observe regulated, institutional-grade demand.
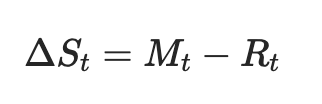
To understand supply behavior across market cycles, we start with a simple supply flow equation:
Where:
-
ΔSt: Net change in total stablecoin supply
-
Mt: Minting volume (fiat → stablecoin)
-
Rt: Redemption volume (stablecoin → fiat)
Translation: TechFlow
This dynamic reveals the core logic of stablecoin supply:
-
Expansion: Supply increases when minting exceeds redemptions.
-
Contraction: Supply decreases when redemptions exceed minting.
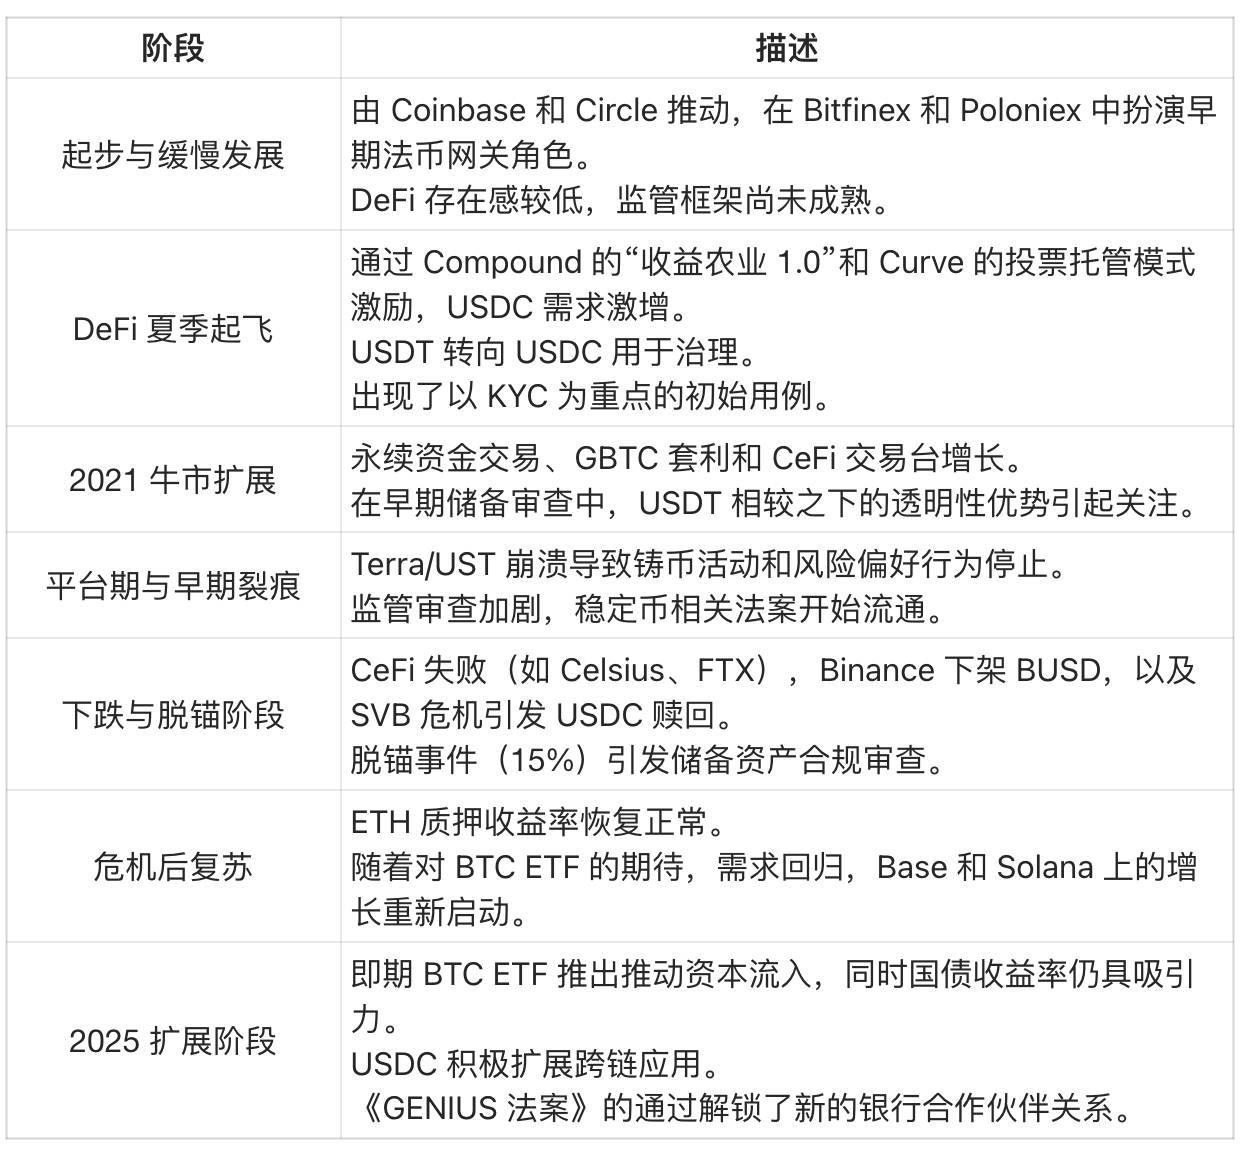
Viewing USDC’s history through the lens of expansion and contraction reveals that its supply shifts closely align with major inflection points across the broader crypto industry timeline.
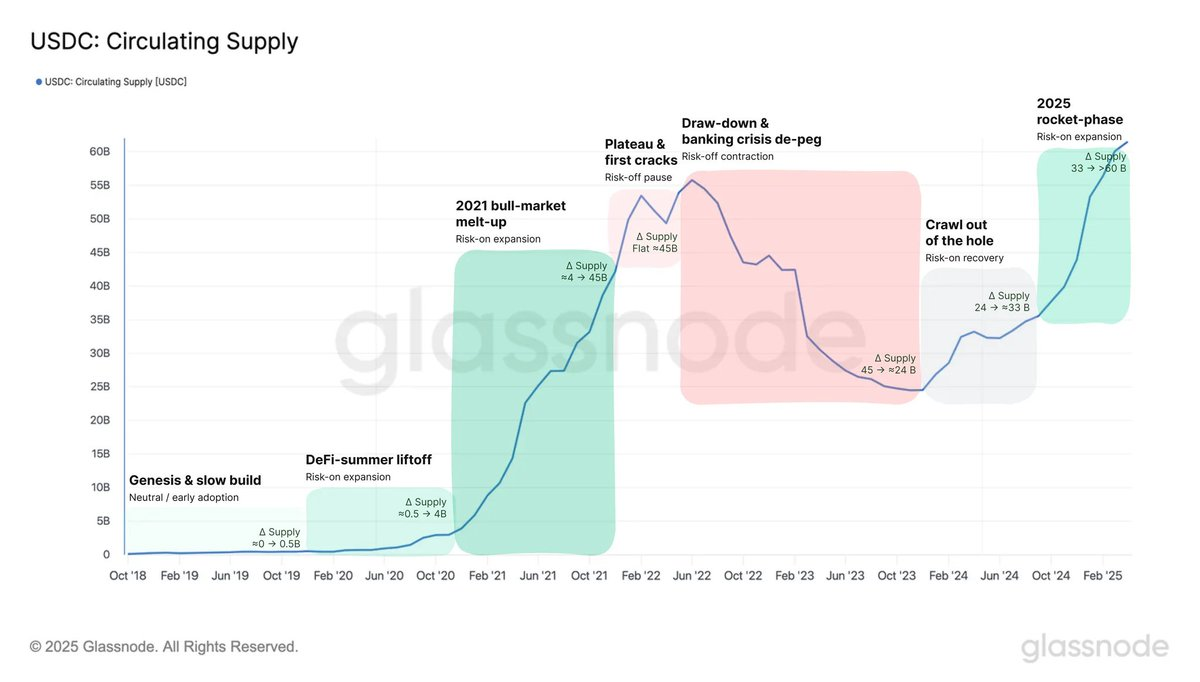
USDC circulating supply – Data source: Glassnode
Translation: TechFlow
Accelerated Expansion (2025 and Beyond)
With Circle’s public listing, USDC’s circulating supply has reached a record high of $61.2 billion. This scale reflects USDC’s evolution from a simple trading-focused stablecoin to a recognized core financial primitive. Since 2021:
-
Daily transaction volume has grown by 406%, rising from $7.77 billion to $31.52 billion.
-
Daily active users have increased at a compound annual growth rate (CAGR) of 142.92% since 2020, signaling rapid adoption across major ecosystems.
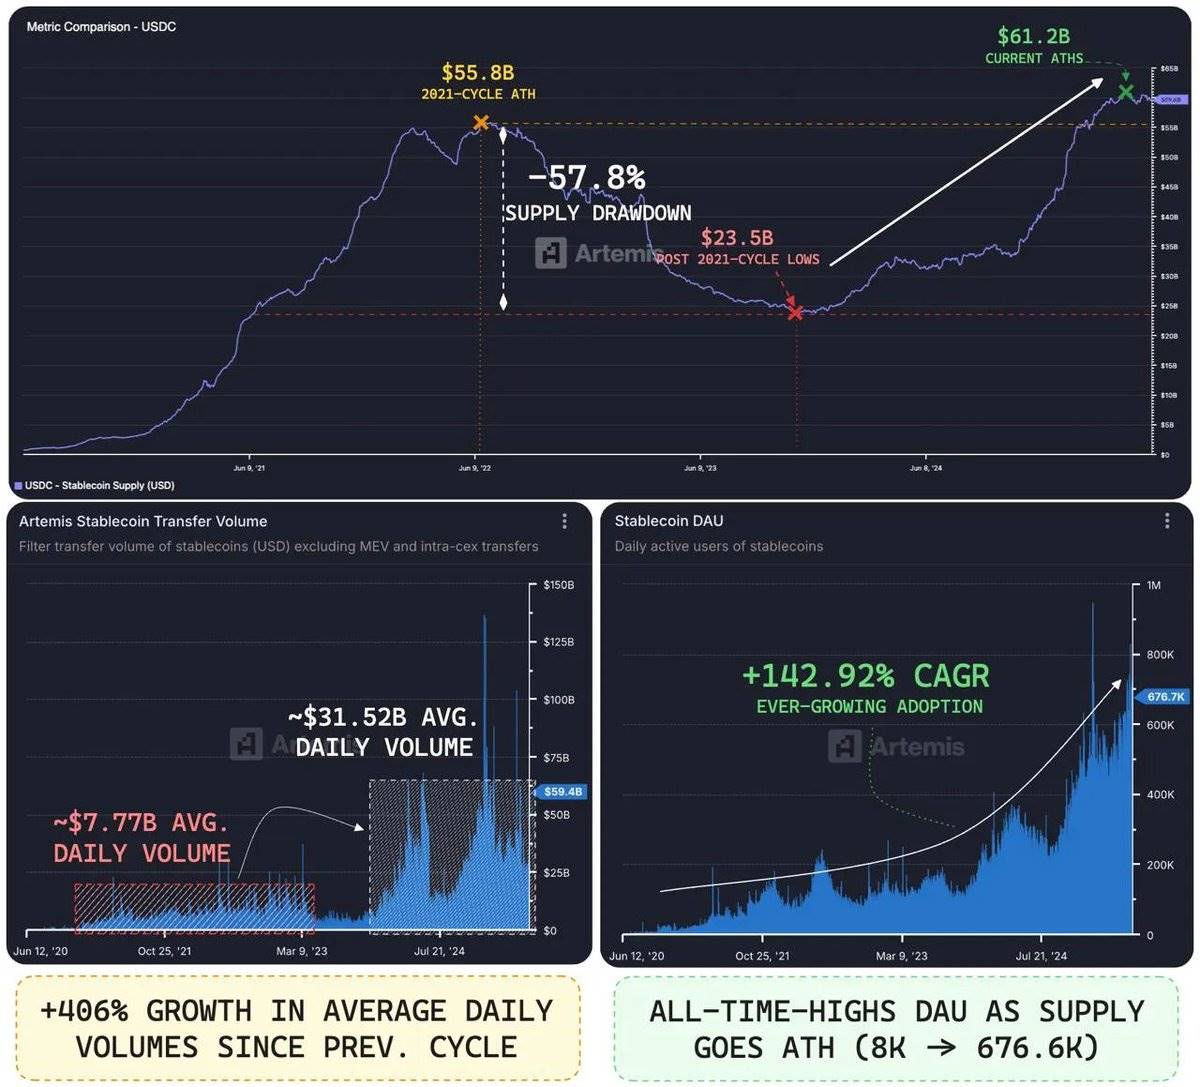
Circle USDC metrics – Data source: Artemisxyz
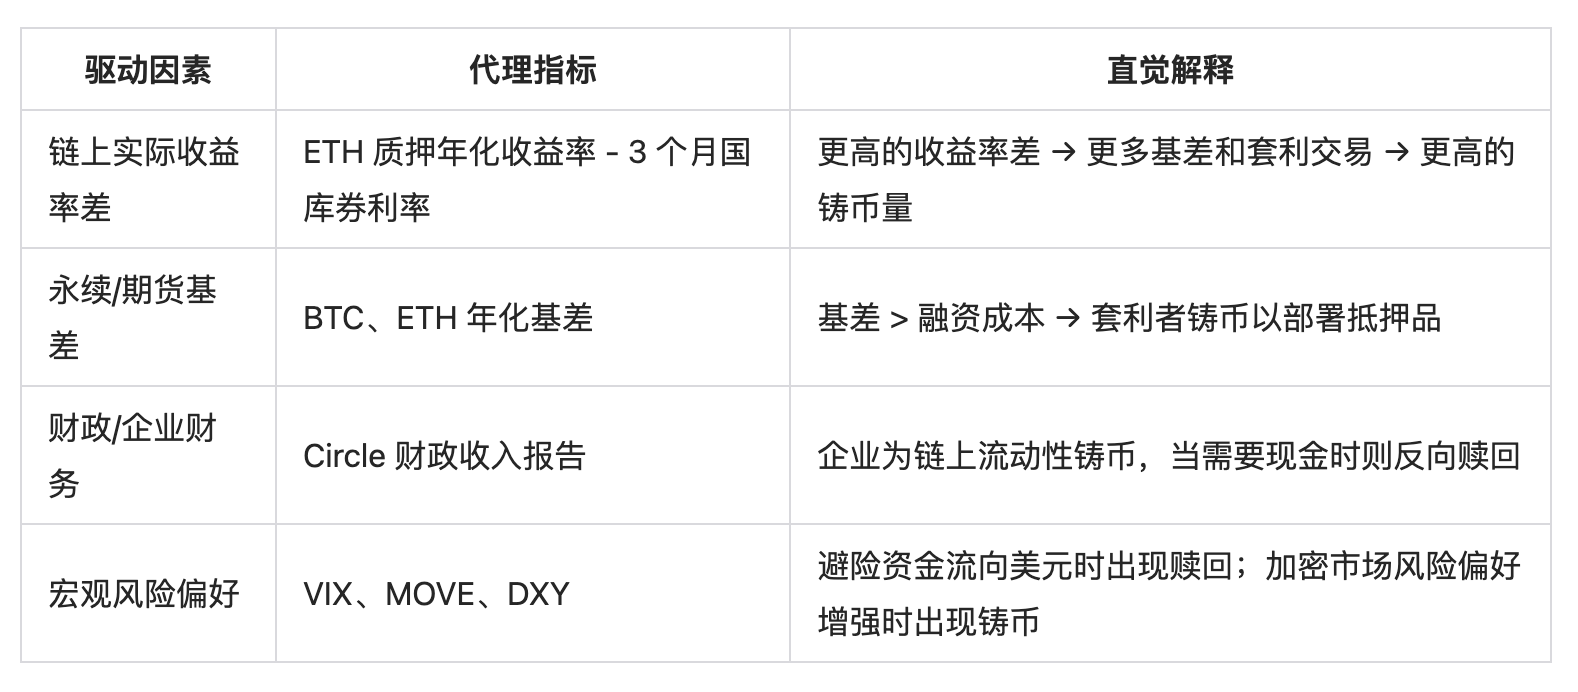
USDC’s growth is primarily driven by three forces:
-
DeFi Revival: Renewed interest and participation from native crypto users.
-
Traditional Finance (TradFi) Adoption: Gradual acceptance by traditional finance audiences in settlement, cash management, and fund allocation.
-
Strategic Partnership with Coinbase: A powerful distribution advantage across retail, institutional, and on-chain ecosystems via collaboration with one of the largest crypto user bases globally.
Capital Efficiency Reveals True Value
Supply alone does not reflect a stablecoin’s actual utility. More importantly, true value lies in the efficiency of capital movement.
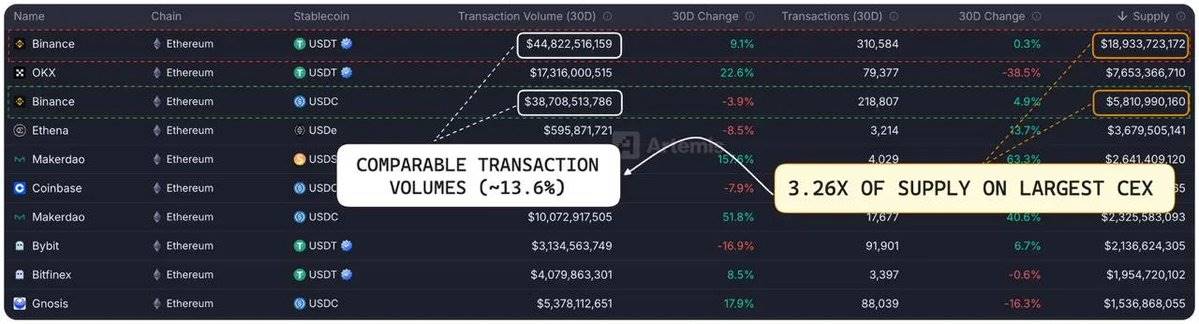
Stablecoin trading volume comparison – Data source: Artemisxyz
On Binance, USDT dominates with $18.9 billion in supply, while USDC stands at $5.81 billion—about one-third of USDT’s level.
However, the gap nearly disappears in trading volume. Over the past 30 days, USDT recorded $44.8 billion in volume versus USDC’s $38.7 billion—a mere 13.6% difference.
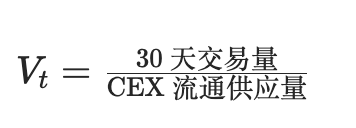
By calculating velocity—the 30-day trading volume divided by circulating supply—we can quantify capital efficiency:
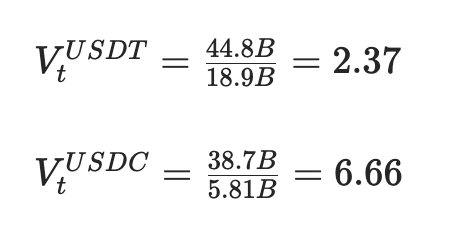
Applied to USDT and USDC:
Data source: DefiLlama, Visaonchain
The results show that USDC’s velocity is 2.81 times that of USDT—each dollar of USDC circulates nearly three times more frequently than USDT. This indicates faster-moving, higher-utility capital and deeper on-chain value creation.
Chain-Level Growth: Expansion into Alt-VMs and Layer 2s
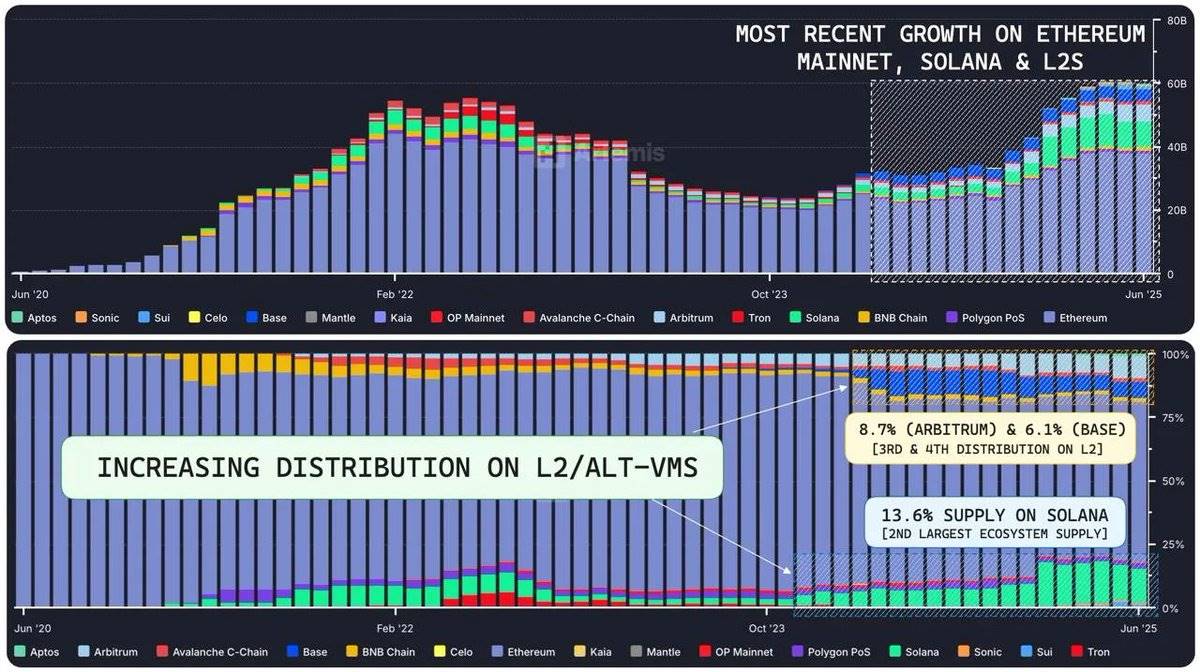
USDC on-chain supply distribution – Data source: Artemisxyz
USDC’s supply growth is shifting from Ethereum-centric deployment to a broader ecosystem, including Solana, Ethereum Layer 2s, and emerging Alt-VM chains.
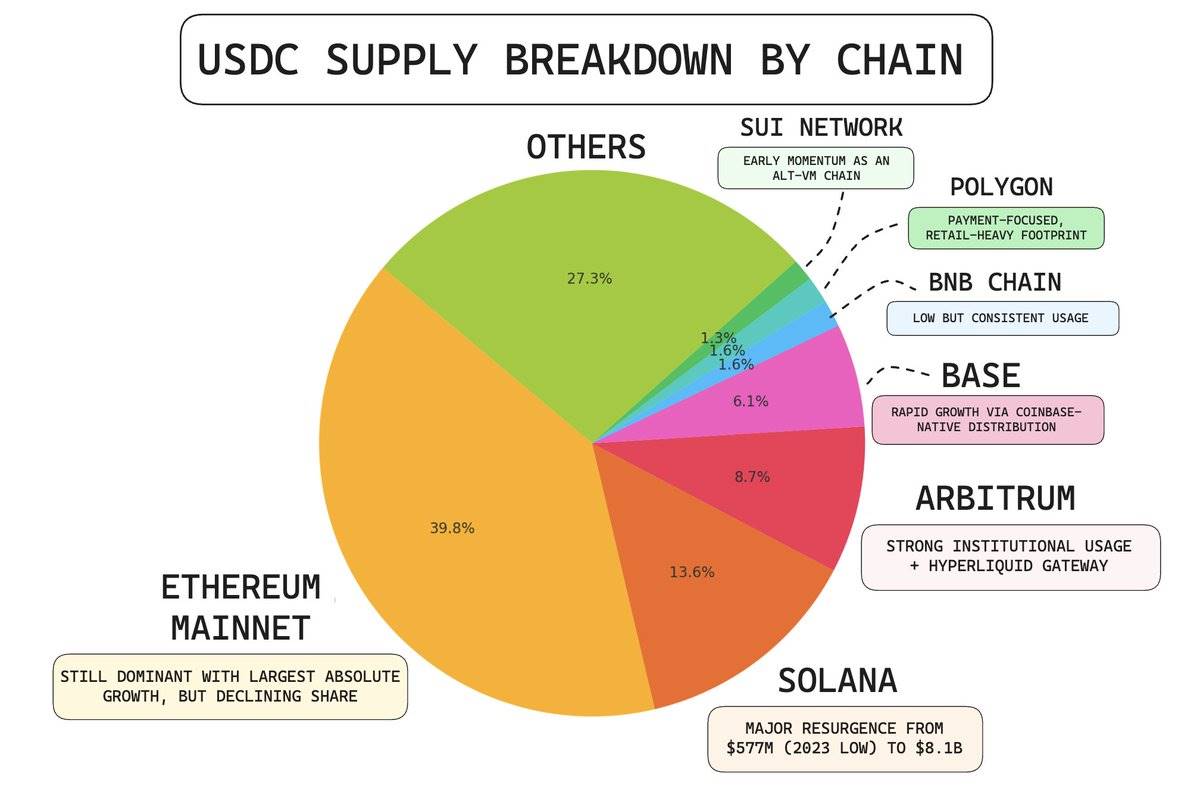
Current Circle USDC supply details – Source: Artemisxyz
Data shows USDC supply is increasingly distributed across diversified ecosystems, aligning with areas experiencing the fastest growth in liquidity, settlement demand, and on-chain utility.
USDC Dominance on Solana
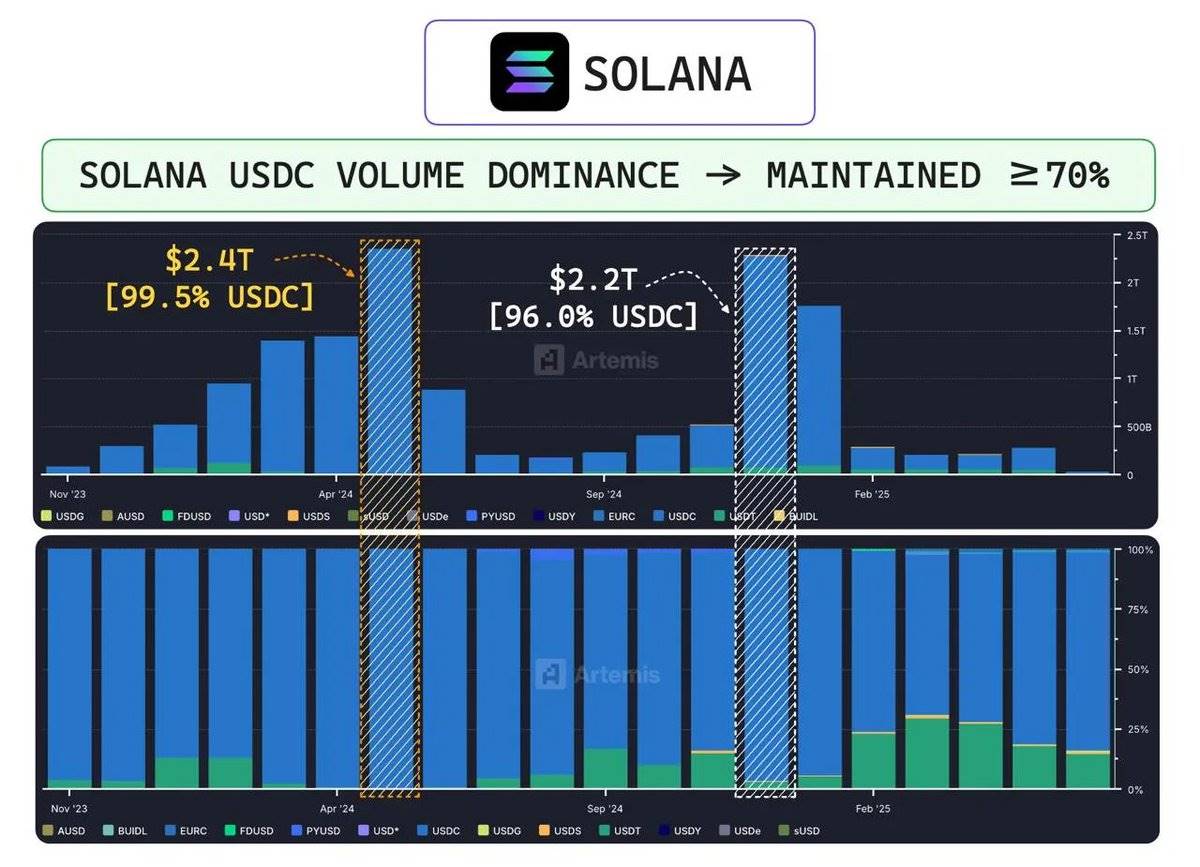
Historical USDC trading volume on Solana – Data source: Artemisxyz
In May 2024, USDC accounted for 99.5% of stablecoin trading volume on Solana. Even as activity diversified by December, USDC maintained a dominant 96% market share.
The Flippening on Arbitrum
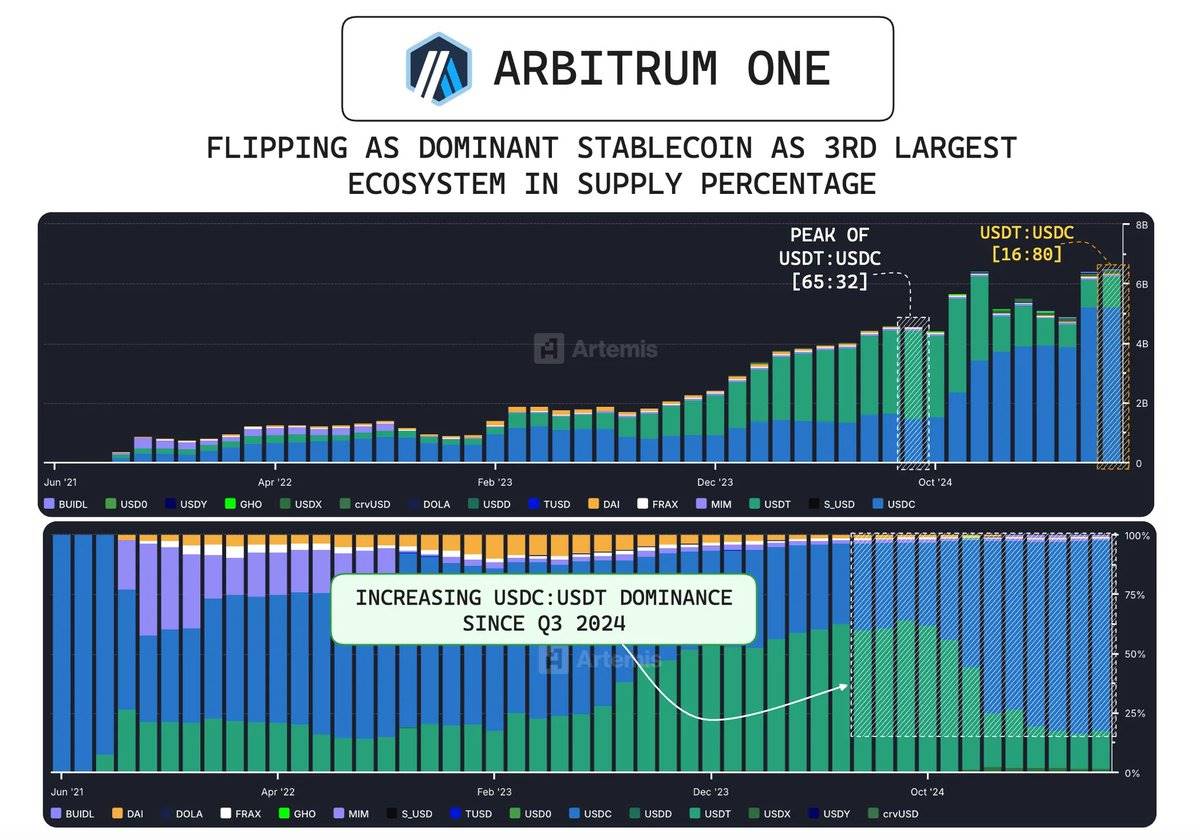
USDC supply trend on ArbitrumOne – Data source: Artemisxyz
In September 2024, USDC quietly surpassed USDT to become the dominant stablecoin on Arbitrum. At its peak, the USDT-to-USDC supply ratio was 2.03 (Tether’s supply more than double that of USDC). Today, that ratio has dropped to 0.2.
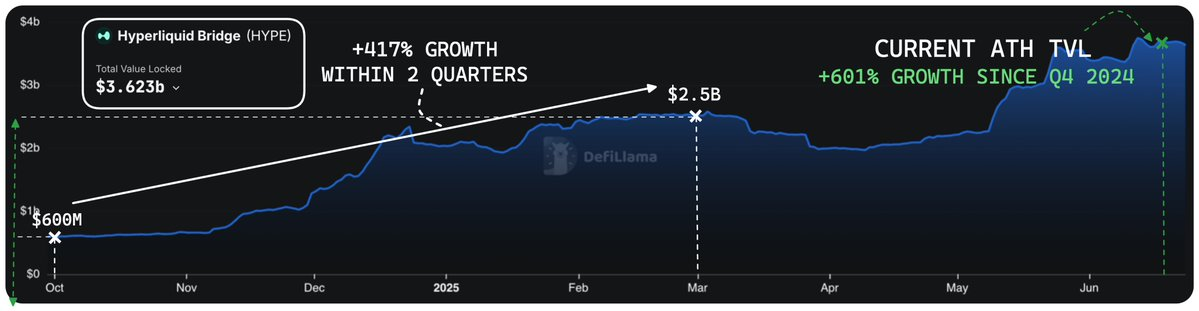
Hyperliquid bridge momentum – Data source: DefiLlama
This reversal was largely driven by Hyperliquid’s explosive growth, whose total value locked (TVL) surged from $600 million in Q4 2024 to $2.5 billion by the end of Q1 2025—an increase of 417%. To date, Hyperliquid’s bridge deposits have hit a record high of $3.62 billion, up 601% from Q4 levels.
This shift reflects a unique structural alignment between Arbitrum’s core ecosystem and its expanding integrations, creating favorable conditions for a stablecoin leadership transition.
Quantitative Model of USDC Supply Curve: Capturing Stablecoin Dynamics
Given the importance of USDC supply dynamics, we built an autoregressive (AR) model to forecast total USDC supply. We chose the AR model for its simplicity, transparency, and strong performance in capturing the locally linear growth pattern of the USDC supply curve.
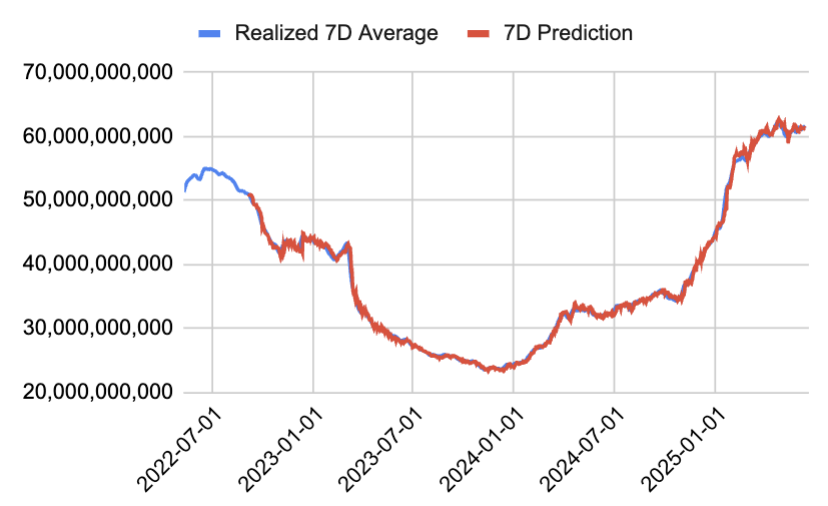
Data source: Internal model
The model is recalibrated every 90 days to capture recent market trends while maintaining a robust sample size for regression and matrix calculations. Each forecast period uses a dedicated model trained on a 90-day rolling window (seven independent regression models, each with a unique set of beta coefficients). The model uses moving averages (1-day, 3-day, 7-day, 14-day, and 30-day) as features to predict the n-day average of USDC supply, where n ranges from 1 to 7. The regression constant is set to zero, ensuring the model is fully signal-driven.
This approach proves highly effective in predicting short-term directional movements in supply. Since 2022, the model’s 7-day average forecast for total USDC supply has landed within ±1.5% of actual values 80% of the time.
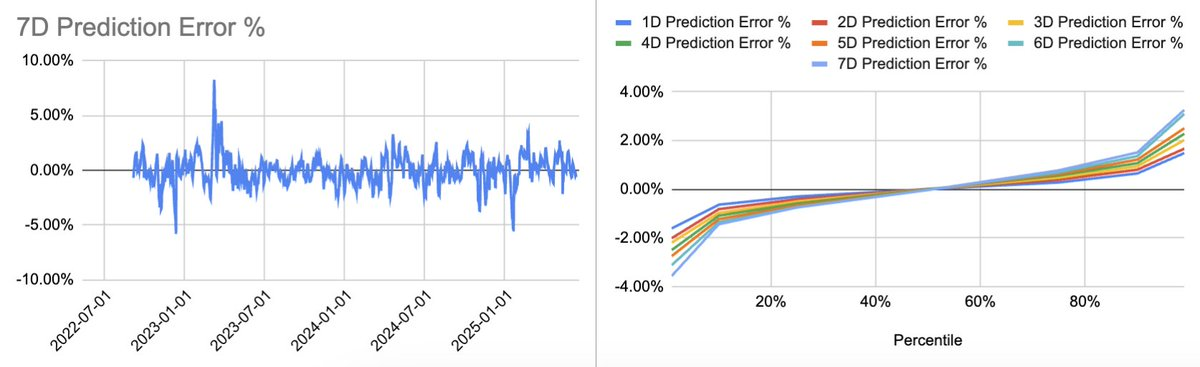
Data source: Internal model
Conclusion
Circle’s public listing marks a pivotal moment for the crypto industry. It is more than a fundraising event—it signals strong, previously unmet demand for stablecoins in public markets. Its performance underscores deep investor interest in compliant digital dollar infrastructure, further cementing Circle’s position as the clearest public representative of this emerging asset class.
With a current valuation of $58.2 billion, Circle has become a gateway for institutions entering regulated digital liquidity, with USDC at the heart of this ecosystem. As USDC becomes more deeply embedded in expanding DeFi ecosystems and traditional financial systems, its role is evolving. It is no longer merely a barometer of adoption, but a real-time global liquidity gauge reflecting capital flows, risk sentiment, and market positioning. So far, the only way to bet on this growth has been through Circle’s stock—but equity-specific factors often obscure the underlying dynamics.
Join TechFlow official community to stay tuned
Telegram:https://t.me/TechFlowDaily
X (Twitter):https://x.com/TechFlowPost
X (Twitter) EN:https://x.com/BlockFlow_News