After Ethereum's sharp rebound: analyzing the data behind value reconstruction and ecosystem disparities
TechFlow Selected TechFlow Selected
After Ethereum's sharp rebound: analyzing the data behind value reconstruction and ecosystem disparities
An Ethereum undergoing value reconfiguration is gradually emerging.
 Navigating Web3 tides with focused insights
Author: Frank, PANews
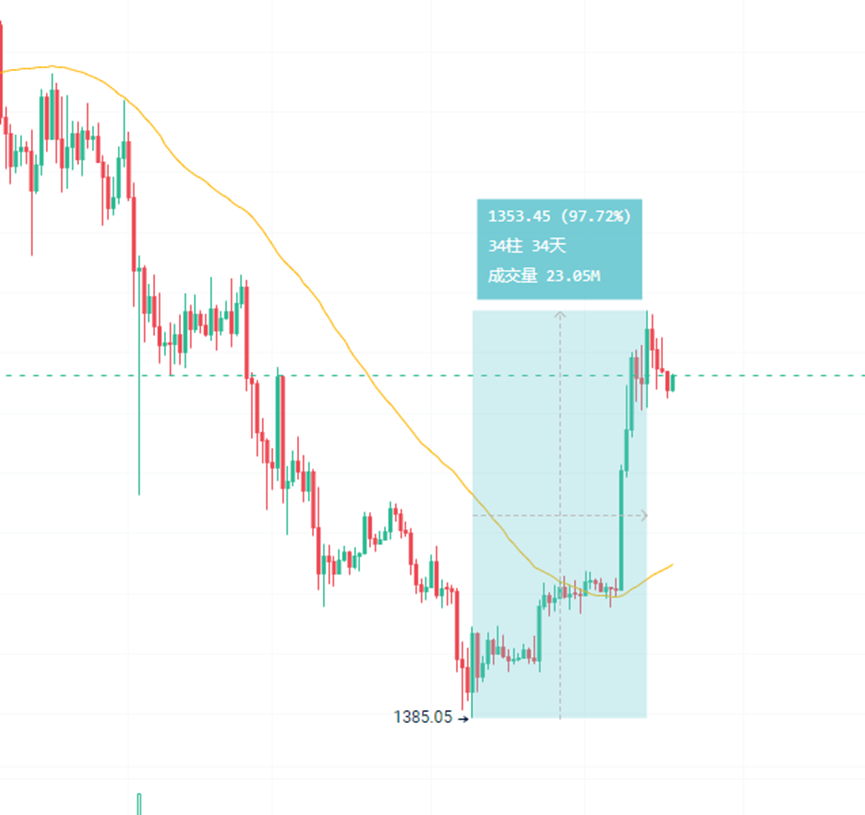
As Ethereum's price rebounded from a low of $1,385 to $2,700, a 97.7% surge revealed a deeply divided capital landscape—while institutional funds remained cautious in the ETF market, derivatives contract positions hit a record high of $32.2 billion. After a prolonged downturn, the market hopes this rally will reaffirm Ethereum as an undervalued asset, and the Pectra upgrade appears to support this narrative. Through comprehensive data analysis, PANews attempts to outline Ethereum’s current state—an Ethereum undergoing value reconstruction is gradually emerging.
Market and Capital: ETF Caution vs. Contract Enthusiasm
As of May 18, the total net asset value held by U.S. ETH ETFs reached $8.97 billion, accounting for 2.89% of Ethereum's total market cap. Compared to Bitcoin ETFs’ 5.95%, this ratio remains relatively low. Overall, Bitcoin still appears more favored in the ETF market.
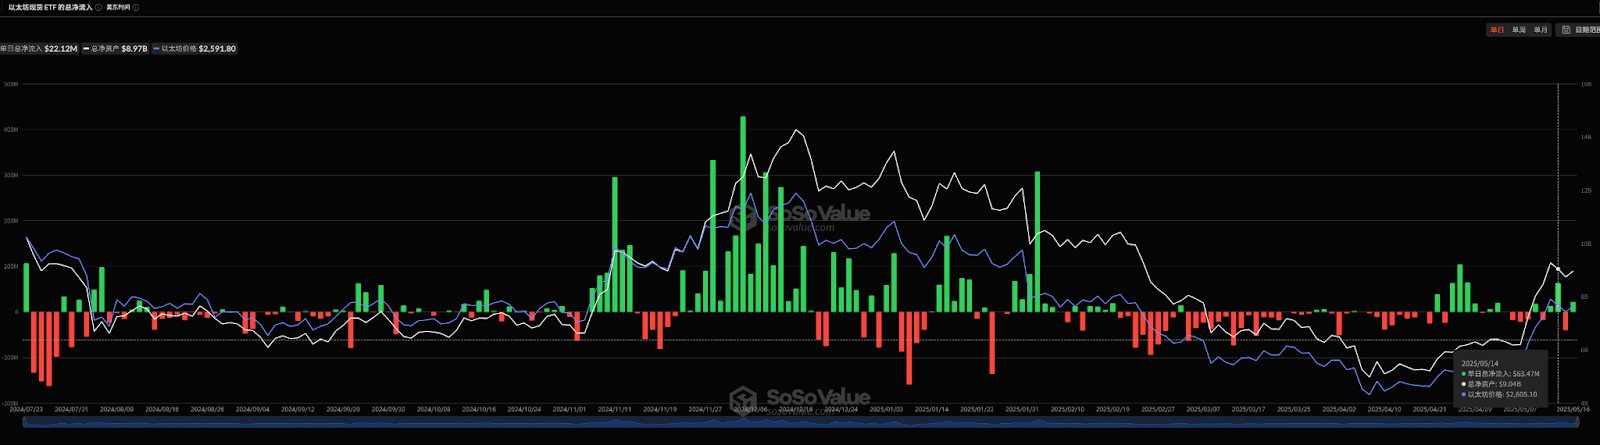
In addition, from February to the end of April, Ethereum ETFs experienced net outflows most of the time. Flows only resumed on April 21, but the overall rebound has been modest. April saw net inflows of approximately $66.25 million, while May has seen around $30 million so far.
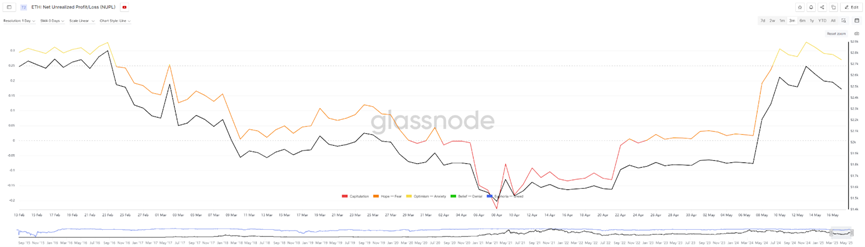
According to Glassnode data, it was also around late April that Ethereum's Net Unrealized Profit/Loss (NUPL) turned positive again. Prior to this, from April 1 to April 22, NUPL remained negative. During this period, Ethereum’s price fell below $1,800, reaching a low of $1,385, meaning most addresses were underwater. However, such negative readings can sometimes signal market bottoms, as selling pressure nears exhaustion. As of May 17, NUPL peaked at 0.328—a level still consistent with early bull or recovery phases, not yet indicating extreme optimism.
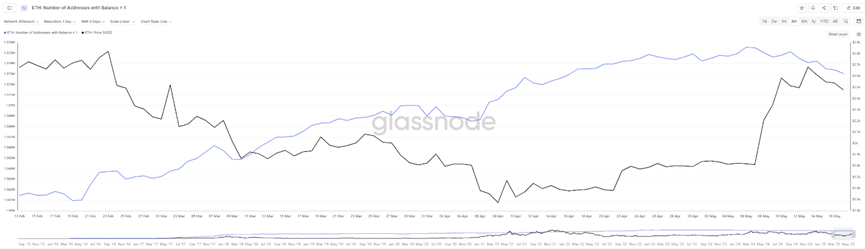
Another interesting observation: the number of Ethereum addresses holding more than 1 ETH decreased during the recent price rebound, whereas it had steadily increased during earlier price declines—indicating many investors accumulated during the downtrend. Once prices rose above $1,800, some holders took profits. However, the drop was minimal—only about one per thousand. With rising prices, the percentage of profitable Ethereum addresses has now reached 60%.
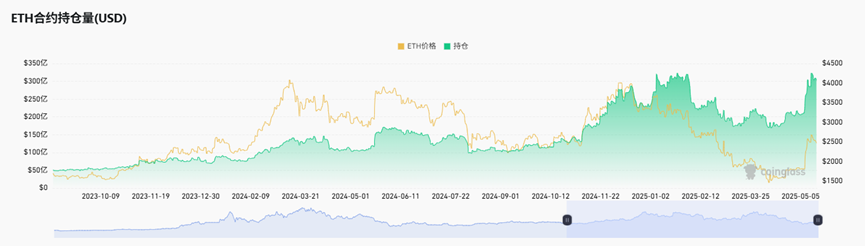
Although the recent price rebound remains far from all-time highs, open interest in futures contracts recently hit historic levels. On May 14, Ethereum’s contract open interest reached $32.249 billion—nearly its highest level ever. The last time it reached this level was between January and February 2025, when Ethereum traded between $3,000 and $3,800. This shows continued strong market appetite for leveraged bets on Ethereum.
Overall, from late April, as prices bottomed, Ethereum began seeing positive capital inflows, followed by a sharp price rise—up 97.7%, nearly doubling. However, judging by inflow volumes, especially ETF flows, traditional institutional participation remains limited.
TVL Rebounds, But Low Gas Fails to Boost Transaction Volume
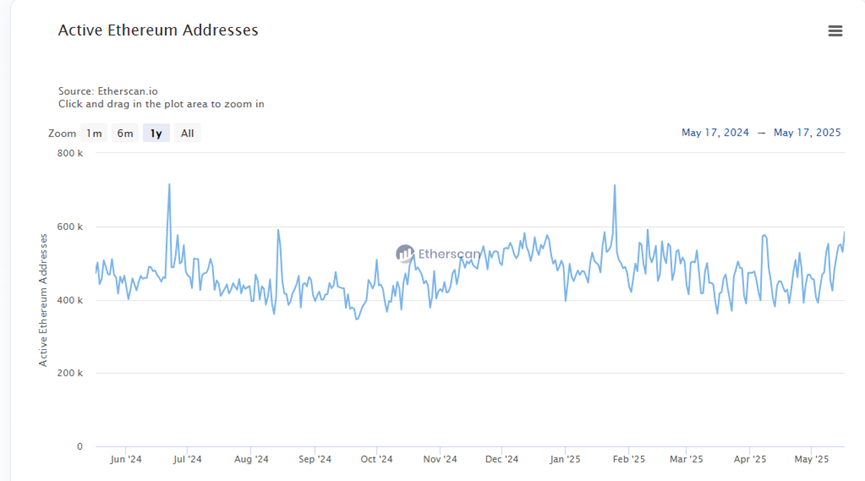
In terms of on-chain activity, Ethereum's active address count shows little change, fluctuating between 400,000 and 600,000 daily. This pattern has persisted for over a year, though recent trends show signs of briefly exceeding the 600,000 threshold.
Another key metric, TVL, shows a clearer trend. Dollar-denominated TVL began rising from April 22, increasing from around $4.5 billion to a peak of about $64.6 billion. However, given Ethereum’s significant price increase during this period, this figure may not reflect true on-chain fundamentals. When measured in ETH terms, staked ETH on Ethereum has clearly declined since April 9—from a high of 30.26 million down to 24 million, a 20% drop.
This decline may stem from investors cashing out or avoiding impermanent loss during Ethereum’s rapid price rise.
Regarding gas fees, as of May 16, 2025, Ethereum’s average gas price was 3.572 Gwei—a 21.57% drop from the previous day and 51.76% lower year-on-year. Over the past 30 days, gas fees have generally declined. They briefly spiked to 10.61 Gwei on May 8 but have mostly stayed below 8 Gwei recently, hitting a low of 1.6 Gwei on May 3. These changes are linked to EIP-7691 in the Pectra upgrade, which aims to reduce L2 costs by expanding blob space.
Yet extremely low gas fees have failed to stimulate a rise in on-chain transactions. Daily transaction counts show no significant increase.
DEX Trading and Asset Landscape: Stablecoin Dominance and Ecosystem Shift
On-chain staking data shows Ethereum experienced net outflows from April 15 to May 5. Coinbase, for example, saw a 30% outflow over the past six months. Currently, Lido holds the largest validator share with 9.11 million ETH staked.
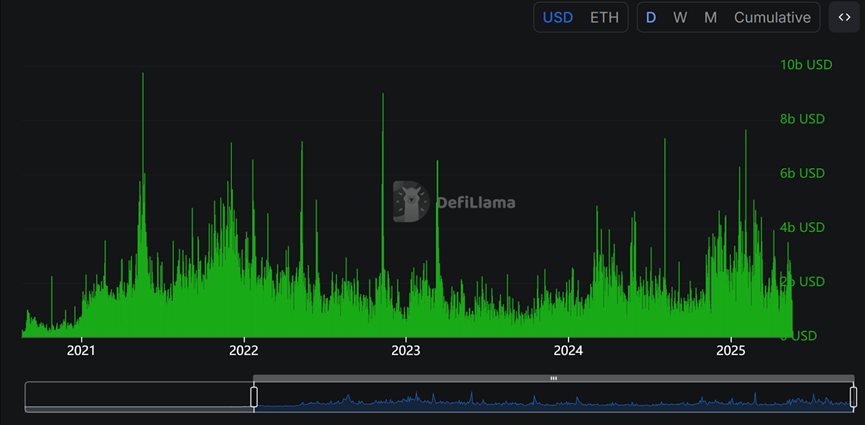
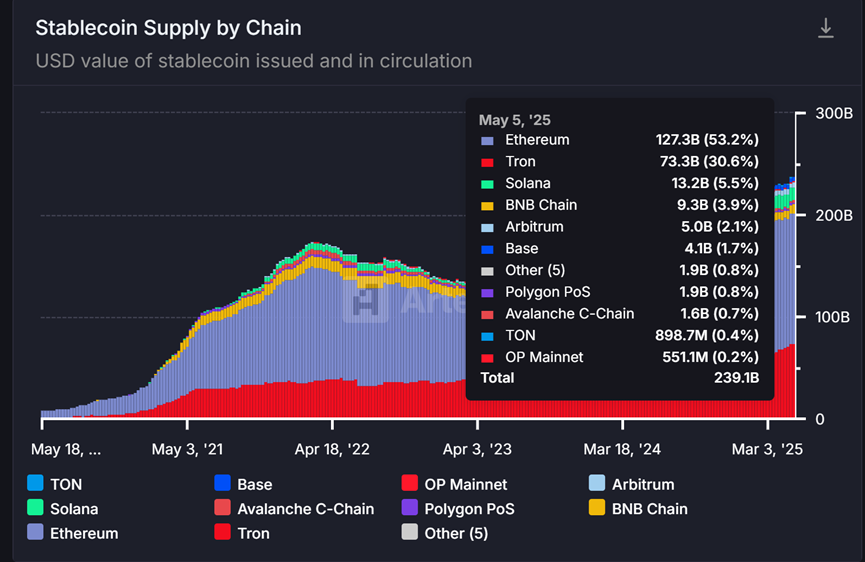
In terms of DEX trading volume, Ethereum’s mainnet entered a notably active phase in 2025. This cycle surpasses 2024 performance and approaches the 2021–2022 peak periods. However, revenue data indicates that the recent uptick in trading activity is primarily driven by stablecoin-related trades. USDT generated $568 million in fees on Ethereum over the past 30 days. As of May 18, Ethereum remains the leading public chain for stablecoin issuance, hosting over 50% of the total supply—$127.3 billion, double Ethereum’s DeFi TVL.
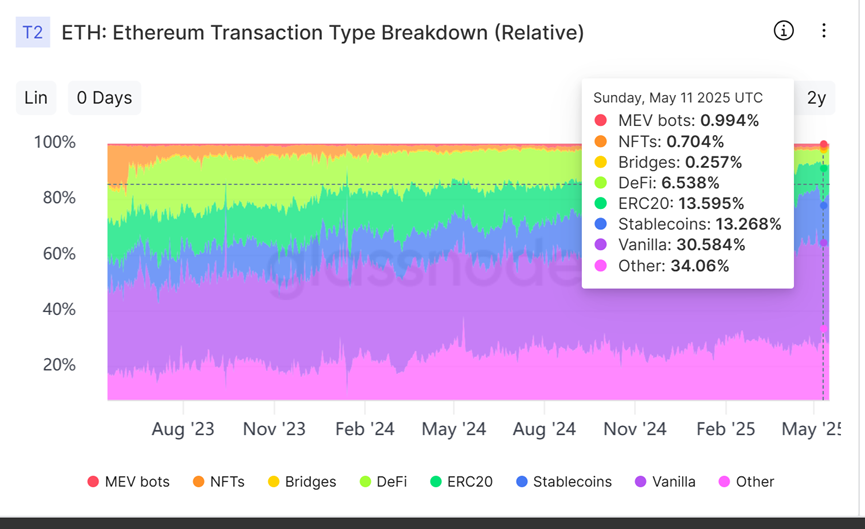
Analysis of fund types on Ethereum reveals nearly half of all transactions involve stablecoins or ETH transfers. Stablecoin transaction share is clearly growing, while DeFi and ERC-20 token shares continue to decline. This suggests Ethereum is increasingly becoming an on-chain store of asset value, while MEME and application-layer development appear constrained. Thus, Ethereum’s long-standing strategy of boosting activity through lower fees and faster transactions may be ineffective.
Additionally, although the average on-chain transfer amount on Ethereum has slightly declined recently, it still ranges between several thousand and ten thousand dollars—far exceeding other chains. Solana’s average is typically just tens of dollars. This confirms Ethereum remains a chain dominated by large players.
In summary, Ethereum’s recent major price rebound reflects the aftermath of transitional pains. On one hand, the ecosystem continues upgrading to improve performance, but these efforts seem ineffective. On the other, it remains a hub for large-scale capital and stablecoin transactions—large holders appear content with Ethereum’s current quiet on-chain environment.
Therefore, single metrics can no longer simply define Ethereum as “good” or “bad.” The market may need to move beyond conventional growth narratives and reevaluate Ethereum’s core role and long-term value in a multi-chain world. Rather than obsessing over whether Ethereum is “rising” or “declining,” it may be wiser to recognize that after cycles of noise and iteration, a more mature and “stable” Ethereum might represent its inevitable evolution and ultimate form.
Join TechFlow official community to stay tuned
Telegram:https://t.me/TechFlowDaily
X (Twitter):https://x.com/TechFlowPost
X (Twitter) EN:https://x.com/BlockFlow_News
 PANews