Asymmetry: Bitcoin's Underlying Theme from a "Value Investing" Perspective
TechFlow Selected TechFlow Selected
Asymmetry: Bitcoin's Underlying Theme from a "Value Investing" Perspective
In Bitcoin investing, asymmetric opportunities have never been lacking—and there are many.
 Navigating Web3 tides with focused insights
Author: Daii
Today, Bitcoin's price has once again broken through the $90,000 mark. Market sentiment is soaring, and social media is filled with cheers of "the bull is back." Yet for investors who hesitated at $80,000 and missed the opportunity to buy in, this moment feels more like an inner reckoning: Did I miss it again? Should I have bought decisively during the dip? Will I ever get another chance?
This is precisely the key issue we need to discuss: In an asset like Bitcoin—known for its extreme volatility—is there truly a "value investing" perspective? Can a strategy that seems to contradict its "high-risk, high-volatility" nature actually capture an "asymmetric" opportunity within this turbulent game?

In investment terms, "asymmetric" refers to situations where potential gains far outweigh potential losses—or vice versa. At first glance, this doesn't sound like a characteristic Bitcoin would possess. After all, most people’s impression of Bitcoin is either instant wealth or total loss.
Yet, hidden beneath this polarized perception lies an often-overlooked possibility: During Bitcoin’s cyclical deep downturns, the methodology of value investing may create a highly attractive risk-reward structure.
Looking back at Bitcoin's history, it has repeatedly crashed by over 80%, even up to 90%. At such moments, markets are shrouded in panic and despair, and capitulation selling makes prices appear completely reset. But for investors who deeply understand Bitcoin’s long-term logic, these moments represent classic “asymmetry”—using limited risk to gain enormous potential returns.
Such opportunities aren’t easily accessible. They test an investor’s level of understanding, emotional control, and long-term holding discipline. This leads to another fundamental question: Do we have reason to believe that Bitcoin truly possesses “intrinsic value”? And if so, how can we quantify it, understand it, and use it to shape our investment strategies?
In what follows, we’ll embark on this exploration journey: uncovering the deeper logic behind Bitcoin’s price fluctuations, clarifying how asymmetry reveals itself amid bloodbaths, and reflecting on how principles of value investing can be reborn in this decentralized era.
But one thing you should understand first: In Bitcoin investing, asymmetric opportunities are not rare—they’re abundant.
1. Why Are There So Many Asymmetric Opportunities in Bitcoin?
If you browse Twitter today, you’ll see widespread celebration of the Bitcoin bull market. Prices have surged past $90,000 again, and many on social media are shouting as if the market belongs only to prophets and lucky ones.
But if you look back, you’ll realize that the invitation to this feast was actually sent out during the market’s most desperate moments—only most people lacked the courage to open it.
1.1 Historical Asymmetric Opportunities
Bitcoin has never followed a straight upward path. Its growth story is a script interwoven with extreme fear and irrational exuberance. And behind each of its deepest drawdowns lies a highly attractive “asymmetric opportunity”—your maximum loss is limited, while your potential return could be exponential.
Let’s take a time-travel journey, guided by data.
2011: -94%, from $33 down to $2
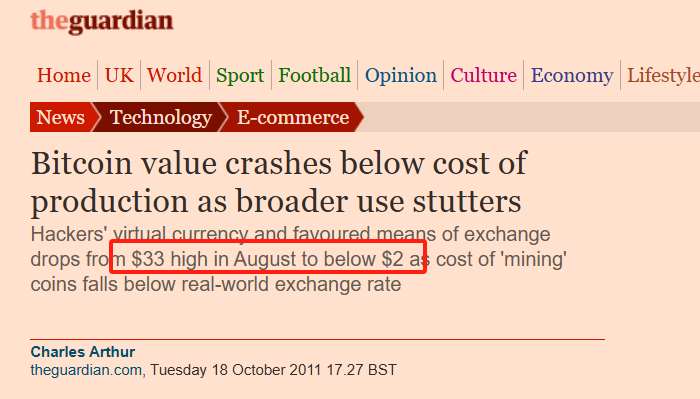
This was the first time Bitcoin was “widely seen.” The price soared from a few dollars to $33 within half a year. But soon after, a crash followed. Bitcoin plunged to just $2—a 94% drop.
Imagine the despair: hacker forums went silent, developers fled, and even core contributors questioned the project’s future.
Yet, if you had simply “bet once” then—investing $1,000—you’d hold $5 million worth of BTC when it later surpassed $10,000.
2013–2015: -86%, Mt.Gox Collapse
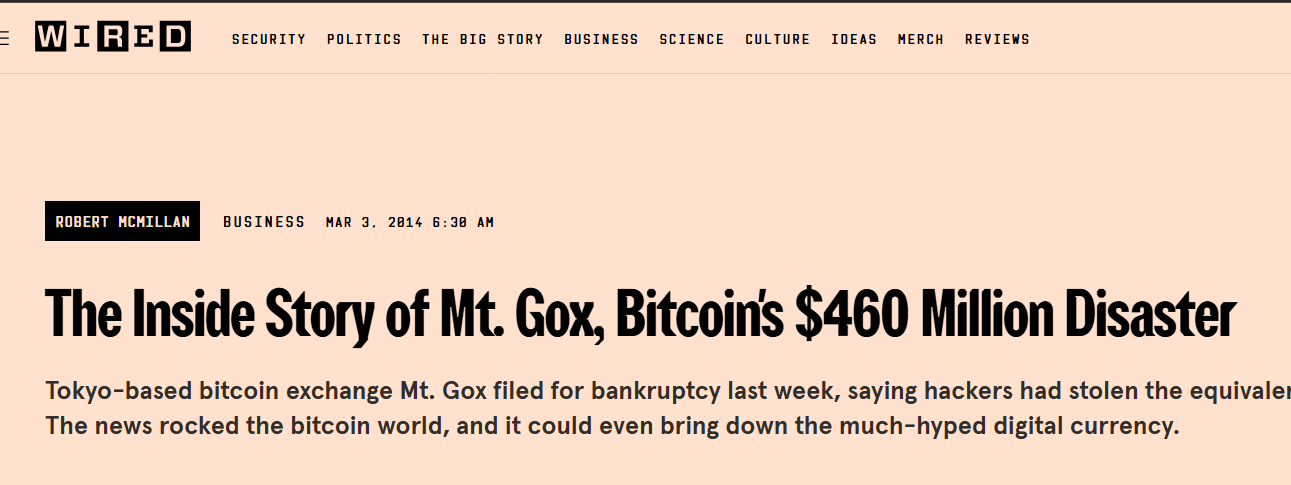
By late 2013, Bitcoin broke $1,000 for the first time, capturing global attention. But it didn’t last. In early 2014, the world’s largest Bitcoin exchange, Mt.Gox, declared bankruptcy—850,000 BTC vanished from the blockchain.
Overnight, headlines proclaimed: “Bitcoin is dead.” CNBC, BBC, and The New York Times ran front-page stories about the Mt.Gox scandal. BTC dropped from $1,160 to $150—a fall exceeding 86%.
But what happened next? By the end of 2017, the same Bitcoin was priced at $20,000.
2017–2018: -83%, ICO Bubble Bursts
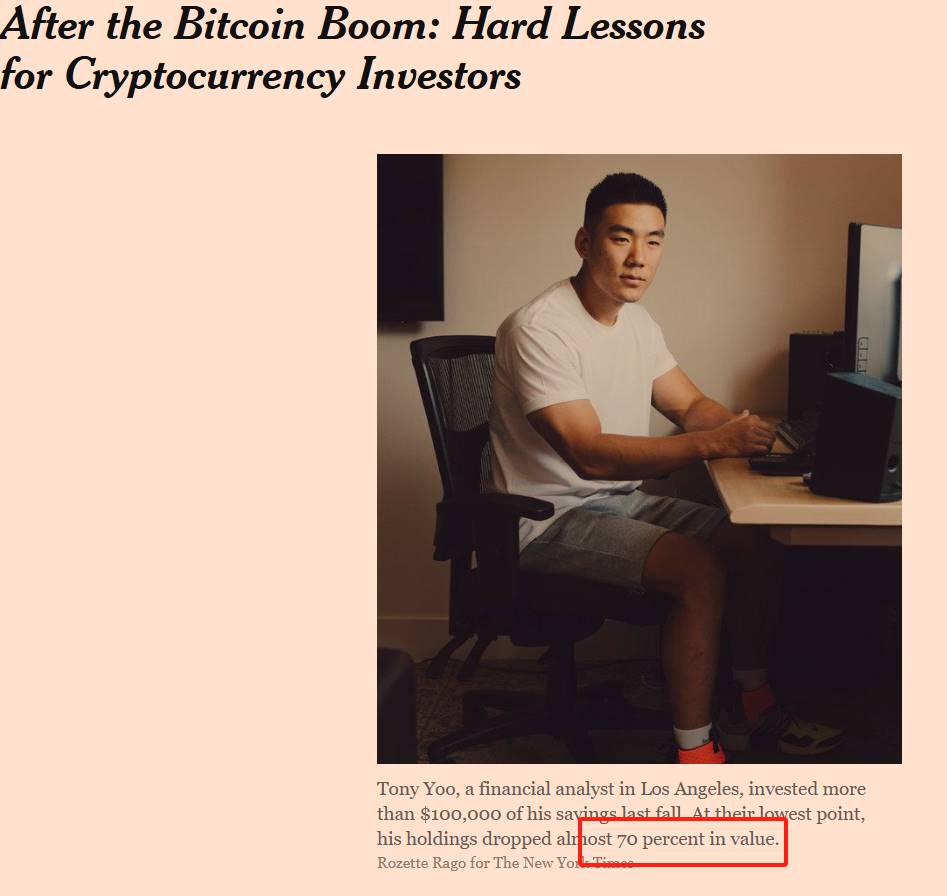
The image above shows a report from The New York Times on this crash. The text in the red box states that this investor lost 70% of their portfolio value.
2017 marked the year Bitcoin entered mainstream awareness—an era of mass speculation. Countless ICO projects emerged overnight, whitepapers filled with words like “disrupt,” “reshape,” and “decentralized future.” The entire market fell into frenzy.
But when the tide receded, Bitcoin crashed from nearly $20,000 to $3,200—a decline over 83%. That year, Wall Street analysts sneered: “Blockchain is a joke”; the SEC filed numerous lawsuits; retail traders blew up and exited, leaving forums silent.
2021–2022: -77%, Industry “Black Swans” Explode One After Another
In 2021, Bitcoin wrote a new legend: breaking $69,000 per coin. Institutions, funds, nations, and retail investors rushed in together.
But just a year later, BTC fell to $15,500. Luna collapsed, Three Arrows Capital liquidated, FTX imploded—the chain of “black swans” toppled confidence across the crypto market like dominoes. The Fear & Greed Index once dropped to 6 (extreme fear), and on-chain activity approached freezing levels.
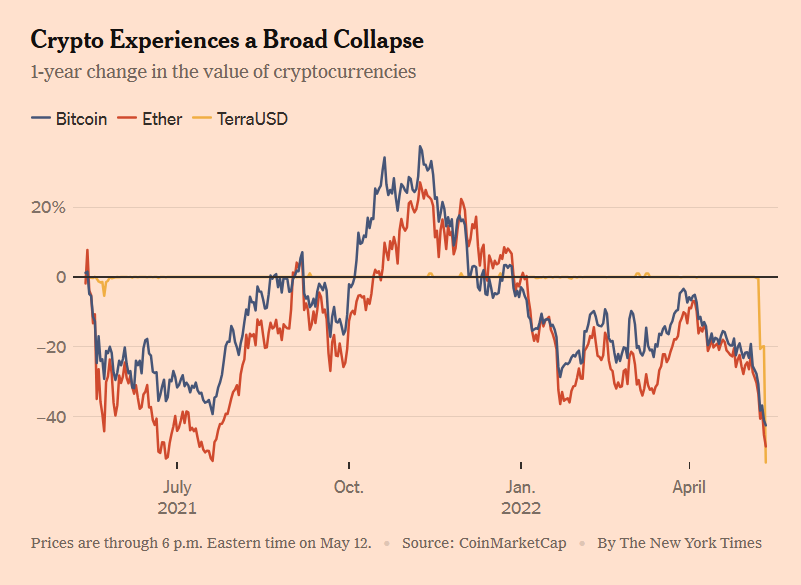
The chart above comes from a May 12, 2022, article in The New York Times. It shows Bitcoin, Ethereum, and UST plummeting together. We now know that behind UST’s collapse was also Galaxy Digital’s role in pumping and dumping Luna.
Yet again, by the end of 2023, Bitcoin quietly rose back to $40,000; following ETF approval in 2024, it surged steadily to today’s $90,000.
1.2 Where Do Bitcoin’s Asymmetric Opportunities Come From?
We’ve seen that Bitcoin has repeatedly staged astonishing rebounds after seemingly catastrophic events. So why does this happen? Why does this asset—ridiculed by many as a mere “greater fool theory”—repeatedly rise from the ashes? More importantly, why can it offer such strong asymmetric opportunities to patient, informed investors?
The answer lies in three core mechanisms:
Mechanism 1: Deep Cycles + Extreme Emotions Create Pricing Deviations
Bitcoin is the only global, 24/7 free market. No circuit breakers, no market makers protecting prices, no central bank backstop. This means it amplifies human emotions more than any other asset.
During bull markets, FOMO (fear of missing out) dominates—retail investors chase higher prices, narratives fly sky-high, valuations become severely overstretched;
During bear markets, FUD (fear, uncertainty, doubt) floods the network—selling cries echo everywhere, prices get trampled into the dirt.
This emotional cycle frequently pushes Bitcoin into states of “severe mispricing relative to intrinsic value.” And this is exactly where value investors find fertile ground for asymmetric opportunities.
To sum it up: The market is a voting machine in the short term, but a weighing machine in the long term. Bitcoin’s asymmetric opportunities emerge precisely when the weighing machine hasn’t yet turned on.
Mechanism 2: Massive Price Volatility, But Extremely Low Risk of Death
If Bitcoin were truly destined to “go to zero” anytime—as the media often claims—then of course it would have no investment merit. But reality tells a different story: every crisis has been survived—and each time, it came back stronger.
In 2011, after crashing to $2, the Bitcoin network kept running normally, transactions continued uninterrupted.
After Mt.Gox collapsed in 2014, new exchanges quickly filled the void, and user numbers kept growing.
After FTX imploded in 2022, the Bitcoin blockchain still produced a block every 10 minutes without fail.
The underlying network of Bitcoin has almost no downtime history—its technical resilience far exceeds popular belief.
In other words, even if the price keeps halving, as long as Bitcoin’s technological foundation and network effects remain intact, it faces no real risk of “going to zero.” Thus, we arrive at a very appealing structure: downside space is limited, but upside potential is open-ended.
This is asymmetry.
Mechanism 3: A Value Anchor Exists But Is Overlooked, Leading to Overselling
-
Many assume Bitcoin has no intrinsic value and thus can fall infinitely. This view ignores several key facts:
-
Bitcoin has programmable scarcity (21 million cap, halving mechanism);
-
It runs on the world’s strongest PoW network, with computable costs;
-
It enjoys powerful network effects—over 50 million users, transaction volume and hash rate hitting new highs;
-
Mainstream institutions and countries recognize its status as a “reserve asset” (ETFs, national currency adoption, corporate balance sheets);
This remains the most controversial question: Does Bitcoin really have intrinsic value? We’ll delve into this shortly.
1.3 Can Bitcoin Go to Zero?
Possibly—but the probability is extremely low. A website tracks 430 times Bitcoin has been declared dead.
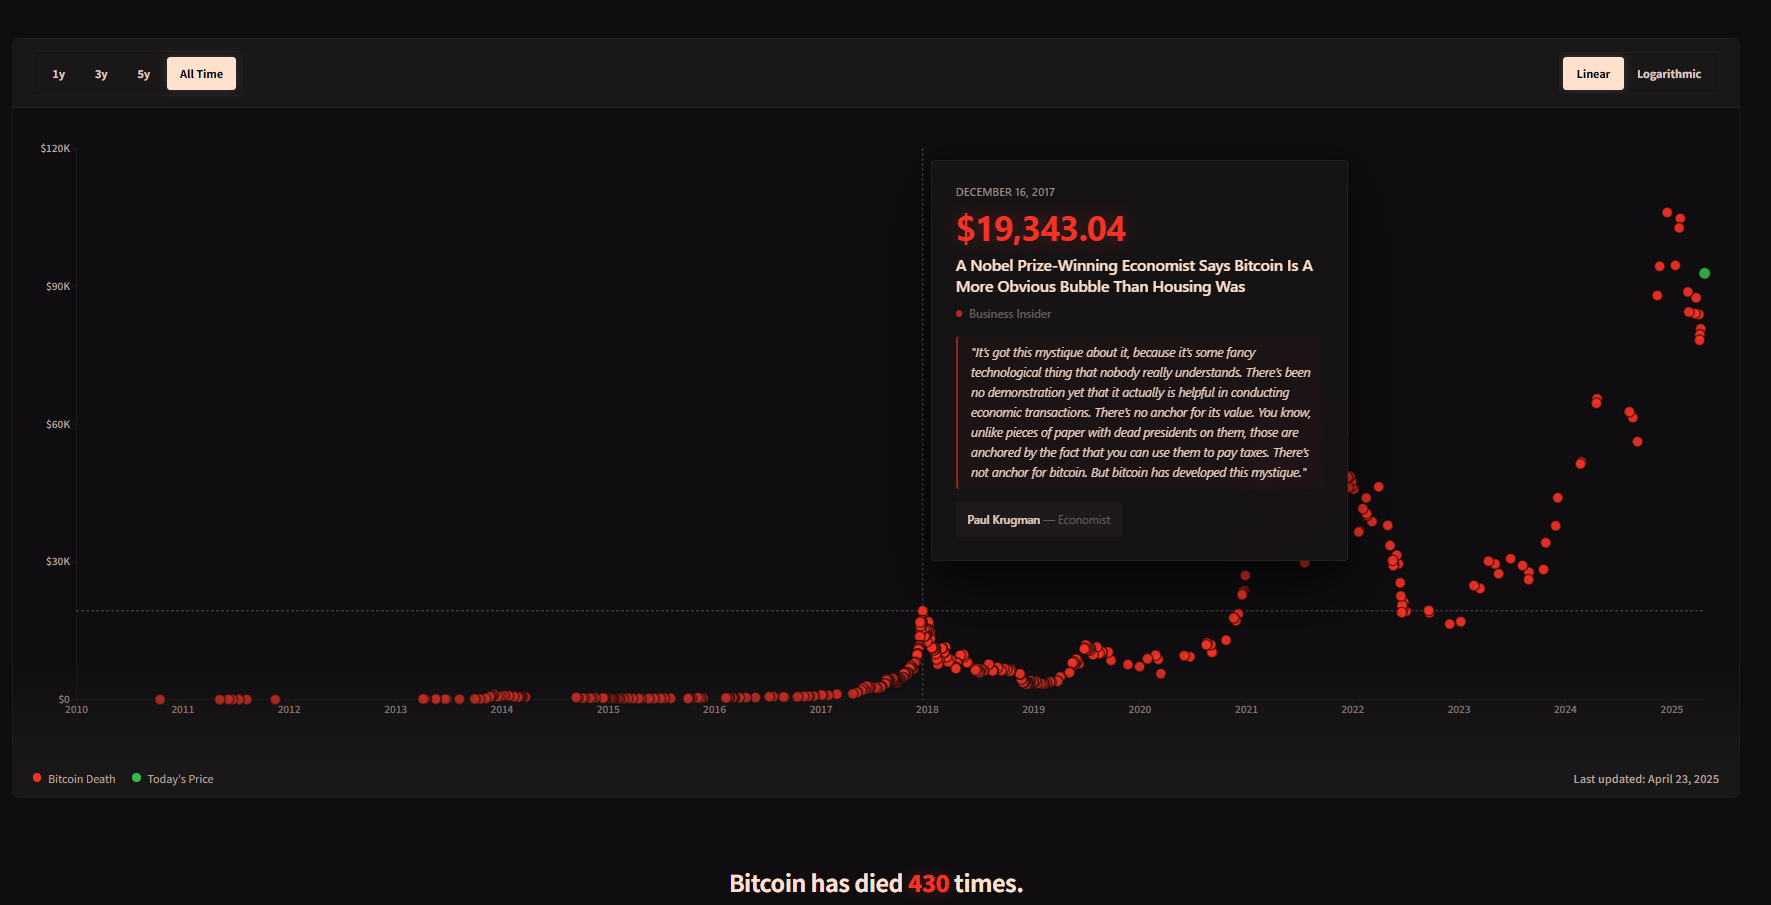
Below the count of death announcements is a small line telling everyone: If you had invested $100 every time someone declared Bitcoin dead, you’d now own over $96.8 million—see the chart below.
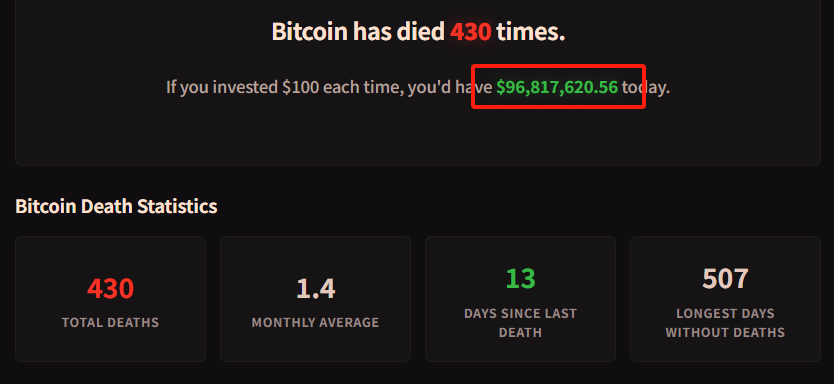
You must realize that Bitcoin’s underlying system has run stably for over a decade, almost never interrupted—whether during the Mt.Gox collapse, Luna’s implosion, or FTX’s failure, its blockchain has consistently produced a block every 10 minutes. This kind of technical resilience provides a strong survival floor.
Now you should understand: Bitcoin isn’t a “logic-free speculative instrument.” On the contrary, its pronounced asymmetry stems precisely from the fact that its long-term value proposition exists—but is frequently severely underestimated by market sentiment.
This brings us to the next essential question: Can Bitcoin—without cash flows, board of directors, or factories—really be subject to “value investing”?
2. Can You Apply Value Investing to Bitcoin?
Bitcoin constantly surges and crashes, with people swinging between extreme greed and extreme fear. Can such an asset truly be suitable for “value investing”?
On one side, there’s Graham- and Buffett-style “margin of safety” and “discounted cash flow.” On the other, a “digital commodity” with no board, no dividends, no profits, not even a legal entity. Within traditional value investing frameworks, Bitcoin seems to have no place.
But the critical question is: How do you define “value”?
If we expand our view beyond financial statements and dividends, returning to the core essence of value investing—
Buying at a price below intrinsic value, and holding until value reverts.
Then Bitcoin may not only be suitable for value investing, but might even embody the original meaning of “value” more purely than many stocks.

Benjamin Graham, founder of value investing, once said: The essence of investing isn’t what you buy, but whether you buy it at a price below its value. The image above is an AI-generated illustration—Graham looking puzzled at Bitcoin.
In other words, value investing isn’t limited to stocks, companies, or traditional assets. As long as something has intrinsic value, and its market price temporarily falls below that value, it can become a target for value investing.
But this raises a more crucial question: If we can’t use traditional P/E or P/B ratios to estimate Bitcoin’s value, where does its “intrinsic value” come from?
While Bitcoin lacks financial reports like a company, it’s not devoid of substance. It possesses a full set of analyzable, modelable, quantifiable value metrics—though these “value signals” aren’t condensed into a quarterly report, they are equally real, perhaps even more stable.
Below, I will analyze the sources of Bitcoin’s “intrinsic value” primarily from supply and demand perspectives.
2.1 Supply Side: Scarcity, a Deflationary Model Hardcoded by Program (Stock-to-Flow)
The most fundamental pillar of Bitcoin’s value is verifiable scarcity.
Hard cap: 21 million coins, non-inflatable;
Halving every four years: Each halving reduces annual supply by 50%, expected to finish issuance around 2140;
After the 2024 halving, Bitcoin’s annual new supply will drop to an inflation rate below 1%, making it scarcer than gold.
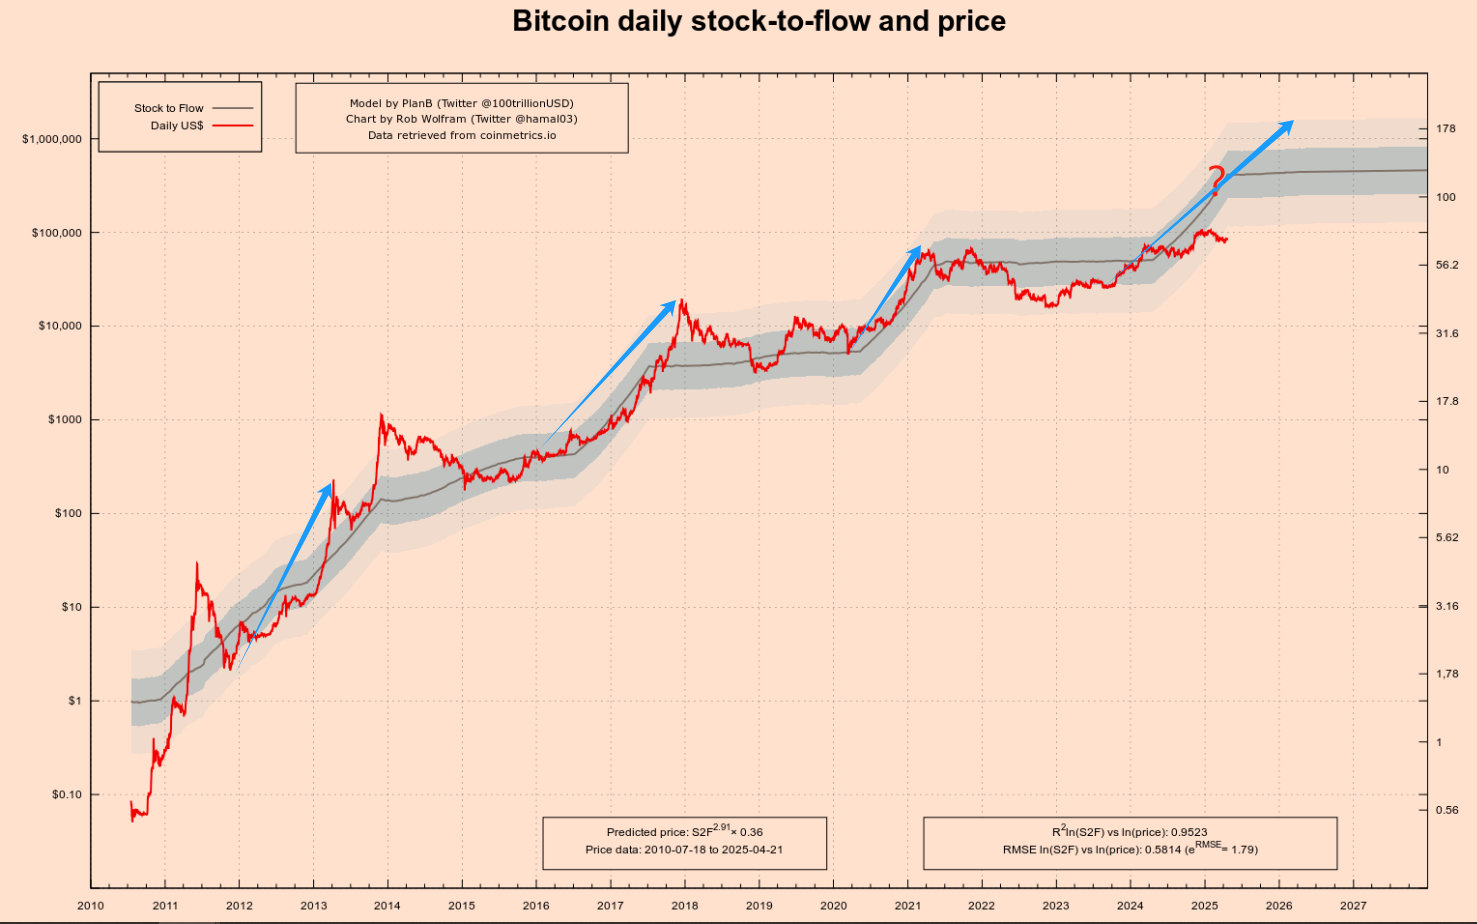
Analyst PlanB’s S2F model (Stock-to-Flow ratio) has accurately captured Bitcoin’s medium-to-long-term price trends post-halving—after the 2012, 2016, and 2020 halvings, prices surged multiple times within 12–18 months—see the first three blue arrows in the chart below.
-
After the first halving in 2012, Bitcoin rose from ~$12 to over $1,000 within a year.
-
After the second halving in 2016, price surged from ~$600 to nearly $20,000 within ~18 months.
-
After the third halving in 2020, price climbed from ~$8,000 to $69,000 within ~18 months.
You’ve probably noticed the big question mark I added above the fourth blue arrow—this marks the fourth halving. Will it follow the previous pattern? My answer is yes, but the magnitude may shrink further.
Note: The left vertical axis in the chart uses a logarithmic scale—so the distance from 1 to 10 equals that from 10 to 100. This helps visualize Bitcoin’s early trends clearly.
Let me explain this model in detail. It draws inspiration from valuation methods for precious metals like gold and silver. Its core logic:
-
Stock: the current total existing amount of the asset.
-
Flow: the annual new supply.
-
S2F Ratio = Stock / Flow
The higher an asset’s S2F ratio, the smaller the annual new supply relative to existing stock—meaning greater scarcity, and theoretically, higher value.
Gold has a very high S2F ratio (around 60), which is one of the foundations of its role as a store of value. Bitcoin’s S2F ratio increases with each halving. For example, after the third halving in May 2020, Bitcoin’s S2F ratio reached ~56—very close to gold. After the fourth halving in April 2024, it doubled to over 100, surpassing gold in scarcity. See the coordinates to the right of the question mark in the chart above.
One of the most popular charts in the crypto community is the Bitcoin S2F model fit chart, shown below. Famous for its visual simplicity and clarity, it became one of the strongest arguments for “long-term Bitcoin price appreciation.”
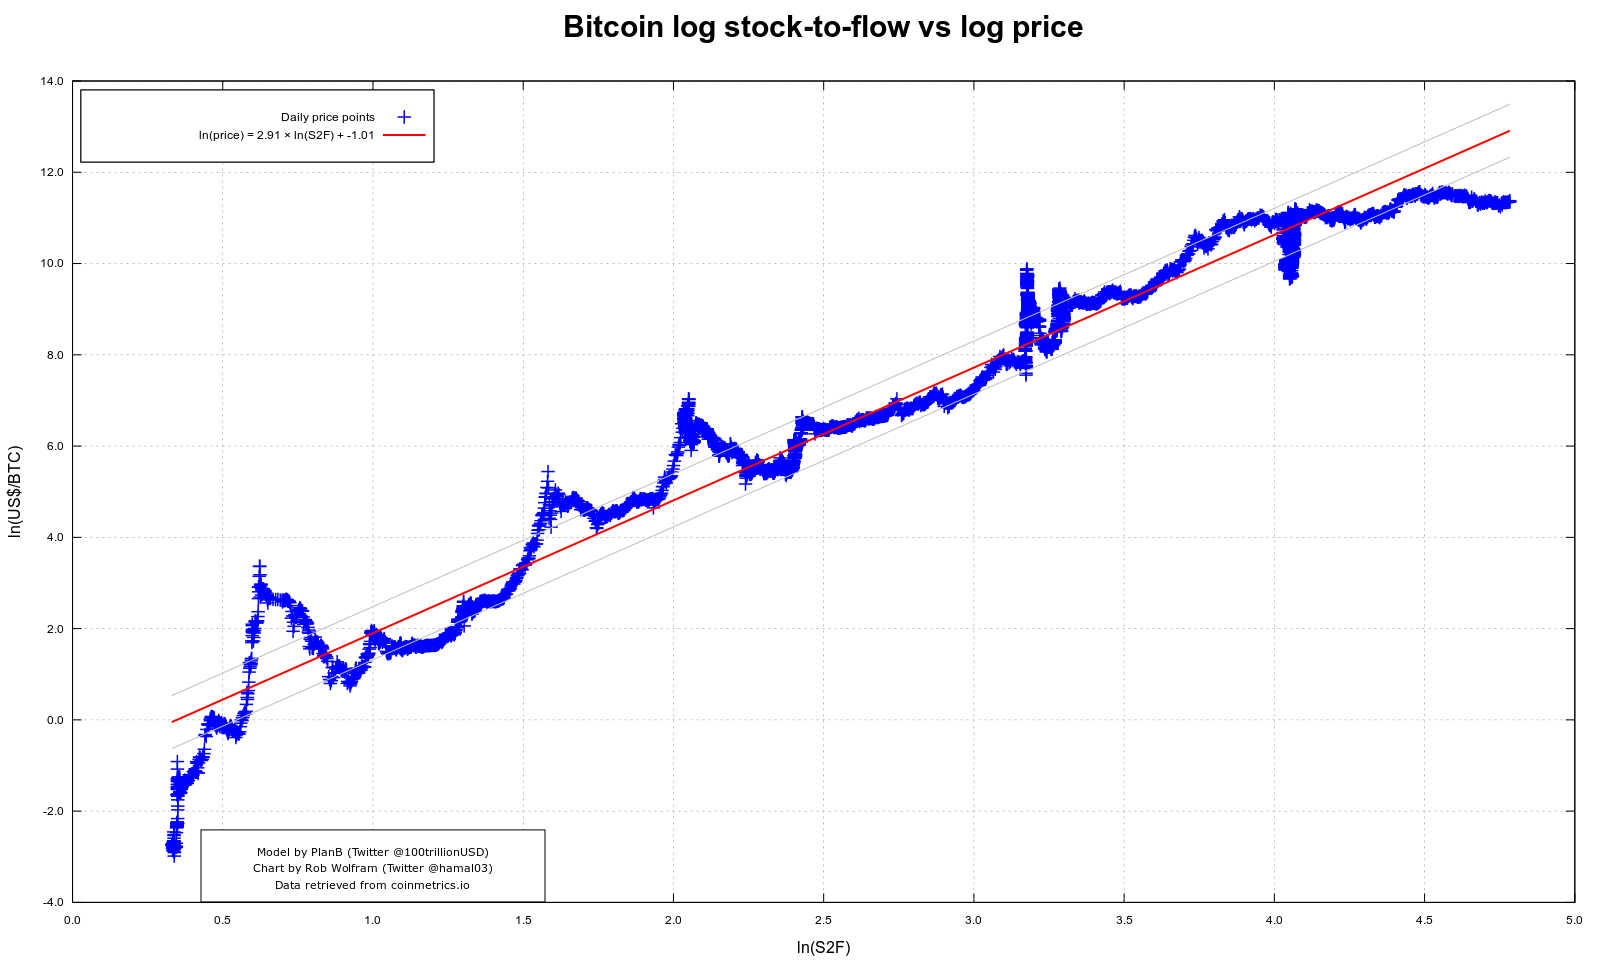
In this chart, the horizontal axis is the natural log of S2F, and the vertical axis is the natural log of Bitcoin price. In this log-log space, a nearly straight red regression line cuts through all historical halving cycles, showing remarkable fitting accuracy.
This chart tries to tell everyone: Every time Bitcoin enters a new halving cycle, newly mined supply is “halved,” the S2F ratio rises, and the model-predicted long-term price climbs accordingly. The model correctly predicted the first three cycles—but the fourth remains unproven.
However, every model has limitations, and S2F is no exception. It focuses entirely on supply: halvings, hard caps, mining speed—but completely ignores demand changes. This worked when Bitcoin had fewer users and demand wasn’t yet “formed.” But after 2020, market structure, capital size, and institutional participation grew rapidly, shifting price drivers increasingly toward the demand side—adoption, market expectations, macro liquidity, regulatory policies, even social media sentiment.
Clearly, a single S2F model cannot convince you—or me. We need a demand-side model too.
2.2 Demand Side: Network Effects, Metcalfe’s Law
If the S2F model locks Bitcoin’s “supply valve,” then network effects are the “demand pump” determining how high the water level can rise. The most intuitive measure is on-chain activity and the expansion speed of holders: by the end of 2024, non-zero balance addresses exceeded 50 million, and daily active addresses hit ~910,000 in February this year—highest in three months.

Roughly applying Metcalfe’s Law—network value ≈ k × N²—when active users double, theoretical network value quadruples. This is the underlying force behind Bitcoin’s repeated “step-wise” price jumps over the past decade. The image above is another AI-generated illustration—Metcalfe happily watching Bitcoin.
Three Key Demand Indicators:
-
Active Addresses: short-cycle metric for real usage热度;
-
Non-Zero Balance Addresses: long-term penetration indicator; compound annual growth of ~12% over the past seven years—even when price halves, holder count continues rising.
-
Value-Carrying Layers: Lightning Network channel capacity and off-chain payment volumes keep hitting new highs, enabling a closed loop from “holding → actual spending.”
This “N²-driven + sticky network” demand model has two implications:
Positive Cycle: More users → deeper trading → richer ecosystem → higher value; this explains why prices jump nonlinearly whenever ETFs, cross-border settlements, or emerging market payments bring in new users.
Negative Cycle Risk: If faced with global regulatory crackdowns, technological substitution (e.g., CBDCs, flashy Layer-2 payments), or macro liquidity drought, both activity and new users could decline simultaneously, causing valuation and N² to shrink together—this is a “demand rupture” scenario invisible to S2F models.
Therefore, combining S2F from the supply side with network effects from the demand side creates a more complete valuation framework: When S2F points to long-term scarcity, and active/non-zero addresses maintain an upward slope, supply-demand mismatch amplifies asymmetry; conversely, if activity declines persistently, even unchanged scarcity may trigger synchronized price and value correction.
In short: Scarcity ensures Bitcoin “doesn’t depreciate”; network effects enable it to “appreciate.”
Notably, Bitcoin was once seen as “geeks’ toy” or “bubble symbol.” But today, its value narrative has quietly shifted.
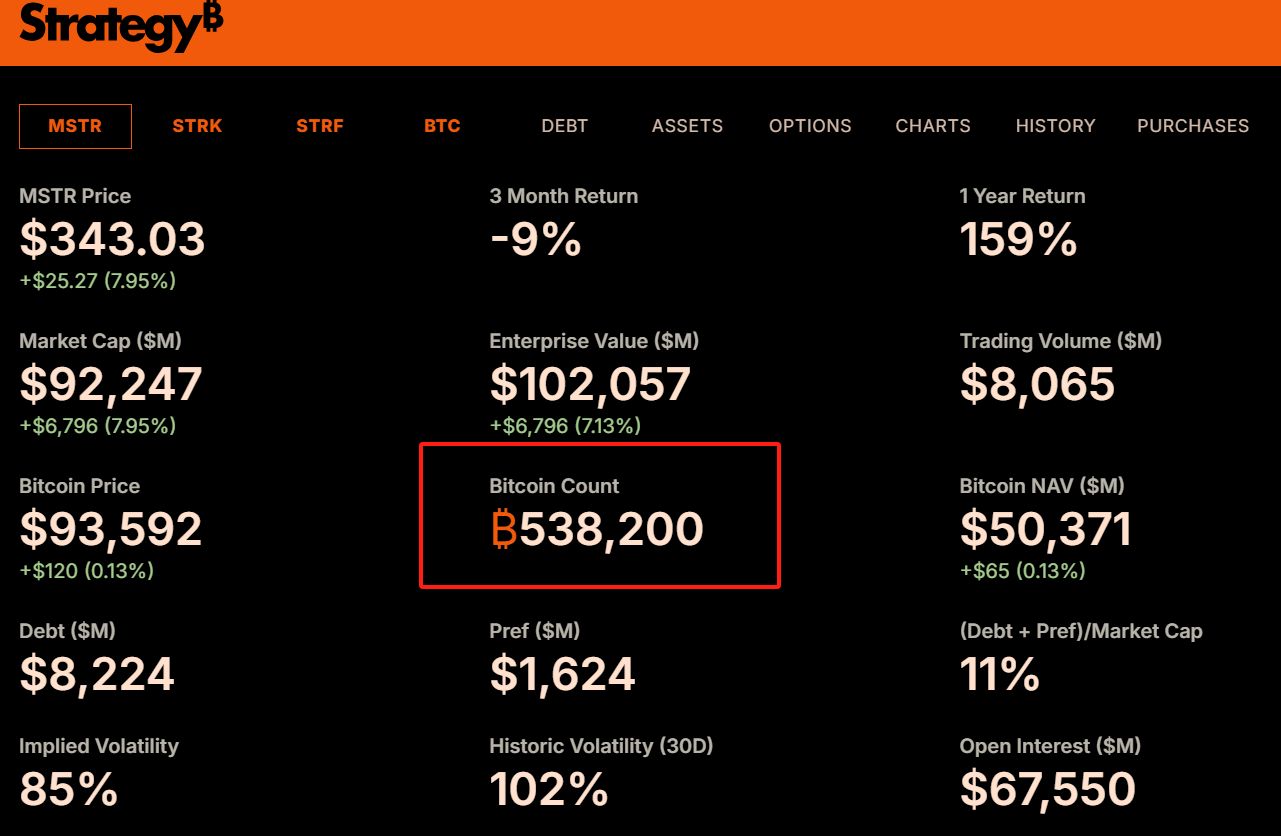
Since 2020, MicroStrategy has added Bitcoin to its corporate balance sheet, now holding 538,000 BTC—see chart above. I previously detailed MicroStrategy’s transformation in my article “The Bitcoin Dividend.”
Later, top-tier asset managers like BlackRock and Fidelity launched spot Bitcoin ETFs, bringing in tens of billions in new capital. Morgan Stanley and Goldman Sachs began offering BTC investment services to high-net-worth clients, and even countries like El Salvador adopted it as legal tender. These shifts aren’t just capital endorsement—they’re validation of “legitimacy” and “institutional consensus.”
2.3 Summary
In Bitcoin’s valuation world, supply and demand are never isolated variables—they form the “double helix” of asymmetric opportunities.
On one hand, the S2F model, based on programmed deflation, mathematically captures scarcity’s long-term upward pressure on price;
On the other, network effects, grounded in on-chain data and user growth, demonstrate Bitcoin’s real demand base as a “digital network.”
Within this structure, the misalignment between price and value becomes increasingly clear—precisely the moment value investors await: when sentiment is low and price falls below composite valuation models, the window for asymmetric opportunity quietly opens. And this leads to the real question: Is the essence of value investing precisely to seek such emotionally undervalued, time-corrected asymmetric opportunities?
3. Is the Essence of Value Investing Really About Seeking Asymmetry?
The core of value investing has never just been “buying cheap things,” but rests on a deeper logical foundation: finding asymmetric structures where potential rewards vastly outweigh risks, within the gap between price and value.
This is what fundamentally distinguishes value investing from trend trading, momentum plays, or technical gambling.
Trend investing relies on market inertia; speculative trading bets on short-term swings; value investing, however, calmly assesses an asset’s long-term value when market sentiment wildly deviates from rational judgment, and decisively buys when price is far below that value, waiting for market reversion. This approach works because it builds a natural asymmetric structure: your worst-case loss is manageable, while your best-case outcome often exceeds expectations.

If we examine the logic of value investing carefully, we find it’s not a specific operational method, but a structural mindset rooted in probability and imbalance.
Investors analyze “margin of safety” to evaluate downside risk in worst-case scenarios;
They study “intrinsic value” to determine the likelihood and scope of price reversion;
And they “hold patiently” because asymmetric payoffs often require time to materialize.
All of this isn’t about perfect prediction, but about building a “betting structure” amid uncertainty—where correct calls yield far greater gains than incorrect ones lose. This is the essence of asymmetric investing.
Many misunderstand value investing as conservative, slow, low-volatility. Quite the opposite. True value investing isn’t about “low return, low risk.” It’s about using controllable risk to access highly asymmetric return potential. Whether early Amazon shareholders or Bitcoin long-termers quietly buying in bear markets, they’re doing the same thing: quietly positioning when most underestimate an asset’s future, and price is crushed by emotion, policy, or misunderstanding.
From this perspective:
Value investing isn’t an outdated “buy cheap, collect dividends” strategy—it’s the common language of all serious asymmetric-return seekers.
It emphasizes not just cognitive ability, but emotional control, risk awareness, and faith in time. It doesn’t require you to be smarter than others—just calmer when others go crazy, and bold enough to bet when others flee.
Thus, understanding the deep relationship between value investing and asymmetry explains why Bitcoin—despite differing from traditional assets—can be embraced by rigorous value investing methods. Its volatility isn’t the enemy—it’s a gift; its panic isn’t risk—it’s pricing error; its asymmetry is a rare, era-defining asset repricing opportunity. And true value investors are waiting for the next such moment, quietly positioning in still waters.
4. How to Invest in Bitcoin Using Asymmetry?
Having understood the sources of Bitcoin’s intrinsic value and recognized that market volatility creates opportunities where price falls below value, the next question is: As ordinary investors, how can we practice value investing in Bitcoin?
Here it must be emphasized: value investing is not about “bottom-fishing”—trying to buy at the absolute lowest price. That’s extremely difficult, if not impossible. The core of value investing is to start buying gradually and systematically when the price enters a range you judge as clearly undervalued—what you consider a “value zone”—and then hold patiently, awaiting value recovery and growth.
For a high-volatility asset like Bitcoin, here are some simple yet practical value investing strategies:
4.1 Dollar-Cost Averaging (DCA)
This is the most basic and suitable strategy for most people. DCA means investing a fixed amount at regular intervals (e.g., weekly, monthly) to buy Bitcoin, regardless of current price.
Advantages:
-
Cost Averaging: Buys fewer units when prices are high, more when low—over time, your average cost basis is lowered below the market average during sustained uptrends.
-
Emotion Control: DCA is a disciplined approach that helps avoid impulsive FOMO or panic-selling. You just follow the plan, no anxiety over timing or subjective judgments.
-
Simplicity: Requires no complex analysis or frequent trading—ideal for investors with limited time or energy for market research.
-
About DCA, I previously explained it in detail in “Bitcoin: The Ultimate Risk-Hedging Solution for Long-Termists.” If you still have questions, I recommend reading it carefully.
4.2 Dynamic Adjustment Using Market Sentiment: Fear & Greed Index
Beyond basic DCA, if you want to slightly improve investment efficiency, you can incorporate market sentiment indicators as auxiliary tools. Among them, the “Crypto Fear & Greed Index” is widely watched.
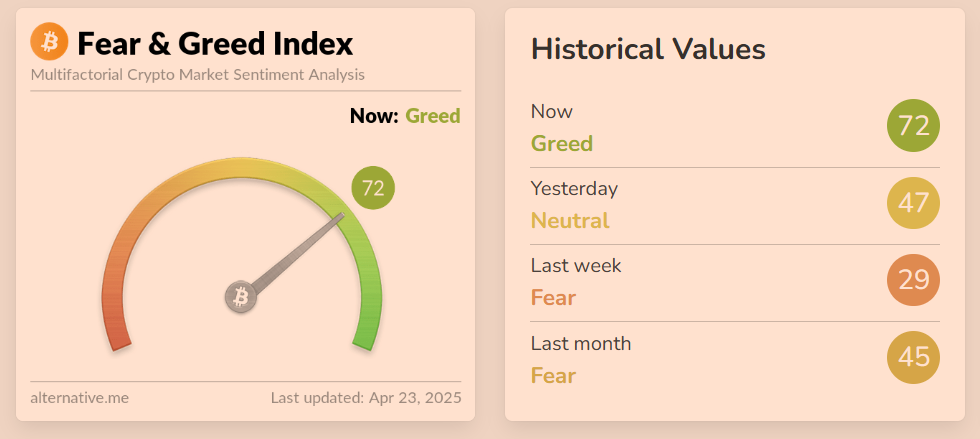
This index combines market volatility, trading volume, social media sentiment, market dominance, survey data, and more, scoring overall market sentiment from 0 to 100:
-
0–25: Extreme Fear
-
25–45: Fear
-
45–55: Neutral
-
55–75: Greed
-
75–100: Extreme Greed
Value investing’s contrarian mindset says: “Be greedy when others are fearful, and fearful when others are greedy.” Therefore, we can integrate the Fear & Greed Index into our DCA strategy:
Base DCA: Maintain regular weekly/monthly investments unchanged.
Double Down in Fear: When the index enters “Extreme Fear” (e.g., below 20 or 15), market sentiment is deeply pessimistic, prices likely severely undervalued. At such times, add extra purchases beyond your regular DCA.
Caution/Sell in Greed (Optional): When the index hits “Extreme Greed” (e.g., above 80 or 85), market sentiment is overheated, risks accumulating. Consider pausing DCA, or even gradually selling part of your holdings to lock in profits.
4.3 Important Reminder
Never invest more than you can afford to lose. Bitcoin remains a high-risk asset—its price could go to zero (though this likelihood decreases over time, the theoretical risk persists). Allocate wisely—Bitcoin’s share in your total portfolio should match your risk tolerance. However, Bitcoin is the lowest-risk cryptocurrency, so it should dominate your crypto holdings. My personal allocation: Bitcoin : Ethereum : Others = 5 : 3 : 2.
Using DCA or dynamic DCA with sentiment indicators essentially practices the core principles of value investing: acknowledging you can’t predict the market, leveraging its irrational volatility, and systematically accumulating assets at prices potentially below intrinsic value—with discipline. Remember: Investing shouldn’t be the most important thing in your life. You don’t need to lose sleep over it.
Conclusion
Bitcoin isn’t an escape hatch from reality—it’s a footnote helping you better understand reality.
In this uncertain world, we often mistake safety for stability, risk avoidance, and escaping volatility. But true safety has never been about avoiding risk—it’s about understanding risk, mastering risk—and seeing, when everyone else turns away, the value foundation buried beneath the sand.
This is the true essence of value investing: seeking asymmetric structures forged by cognition amid emotional dislocation; quietly buying, at the deepest point of the cycle, the chips the market forgot but that will eventually return.
And Bitcoin—a financial species coded with scarcity, evolving value through networks, repeatedly reborn from panic—is the purest expression of this asymmetry. Its price may never be calm; but its logic remains consistent: scarcity sets the floor, network the ceiling, volatility the opportunity, time the leverage.
You can never perfectly time Bitcoin’s bottom, but you can ride cycle after cycle, continuously buying misunderstood value at reasonable prices. Not because you have magical insight, but because you possess a higher-order mindset—you believe: the best bet is placing your chips on the side of time when others walk away.
So remember this:
Those who bet at the depth of irrationality are often the most rational; and time is the most faithful executor of asymmetry.
This game always belongs to those who read order behind volatility, who see logic behind collapse. Because they know: the world doesn’t reward emotion—it rewards cognition. And cognition, in the end, will always be proven by time.
Join TechFlow official community to stay tuned
Telegram:https://t.me/TechFlowDaily
X (Twitter):https://x.com/TechFlowPost
X (Twitter) EN:https://x.com/BlockFlow_News
 @yzdxs8