

When Panic Knocks: Finding Signals of Crypto Market Shifts from 239 Panic Moments Over 7 Years
TechFlow Selected TechFlow Selected
When Panic Knocks: Finding Signals of Crypto Market Shifts from 239 Panic Moments Over 7 Years
History doesn't repeat itself simply, but it always repeats in astonishing ways.
Author: Frank, PANews
The intense volatility of the cryptocurrency market goes hand in hand with extreme swings in investor sentiment, making the "Fear & Greed Index" an intuitive metric for gauging overall market psychology. On April 7, growing concerns over global tariff hikes triggered a major shakeup across financial markets worldwide, sparking a surge of panic.
Looking back, since 2018, the crypto market has experienced a total of 239 instances where the index dropped below 20—classified as "extreme fear." This article does not aim to amplify negative market sentiment, but rather seeks to systematically review these critical moments, learning from history to uncover potential cyclical patterns. The research by PANews focuses on the distribution and duration of these fear episodes, analyzing whether they contain meaningful market signals.
2018: A Year-Long Panic Under Regulatory Shadow
From the perspective of the fear index, this period was characterized by recurring bouts of panic over an extended timeframe. In February 2018, BTC plummeted roughly 70% from its peak of $19,000 to around $5,900 within just 50 days—marking the first major wave of market fear.
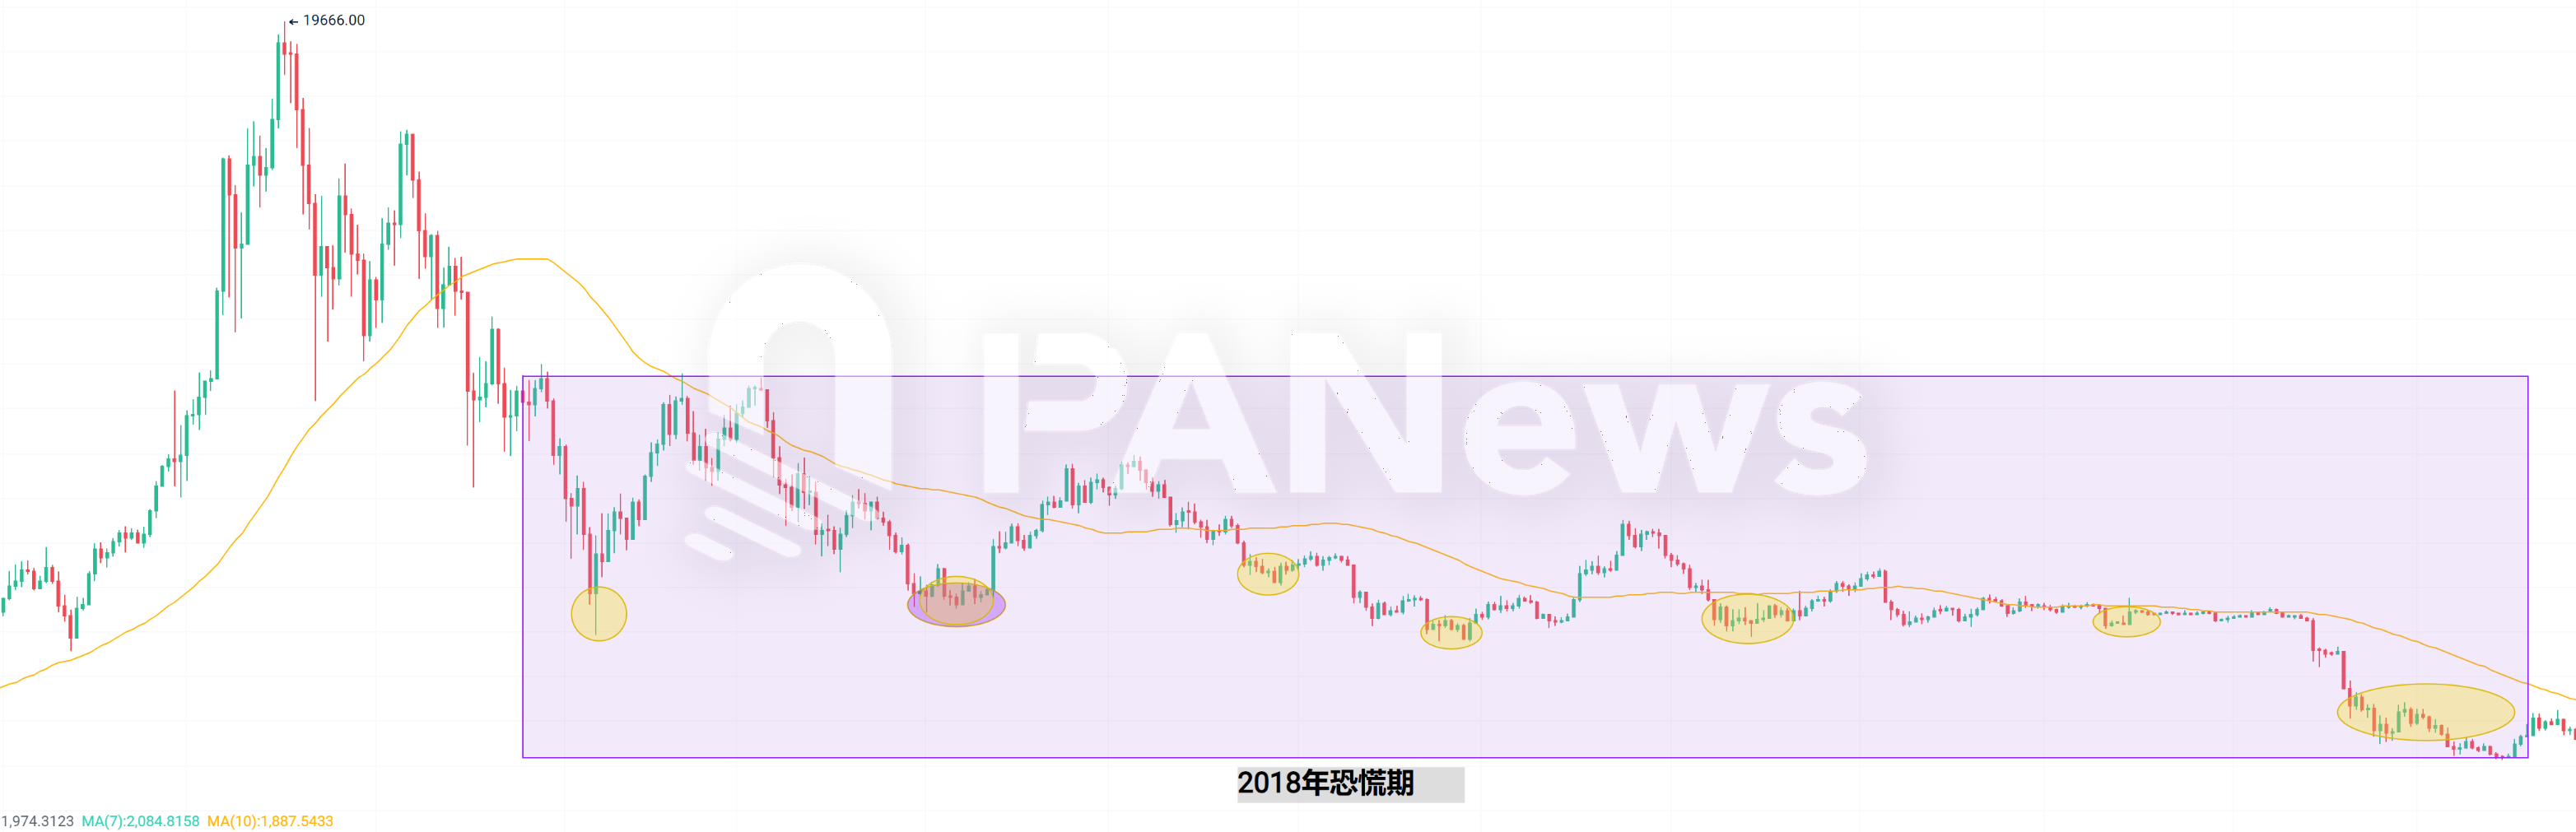
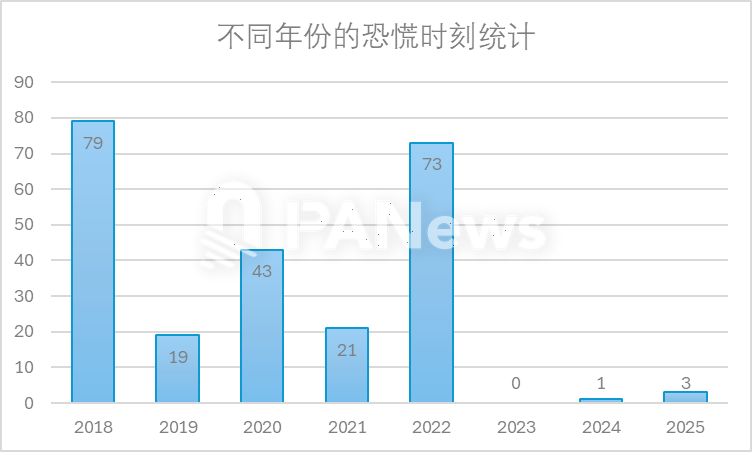
During multiple bottoming attempts, fear reemerged each time. Data shows that 2018 recorded 93 such extreme fear events (index below 20), the highest number of any year. Notably, the fear index hit a low of 8 on February 5, remained under 20 for 23 consecutive days between August 20 and September 11, and again stayed in extreme fear for 27 days from November 20 to December 16.
In terms of short-term price action, these fear phases almost always coincided with temporary market bottoms, followed by rebounds of varying degrees. However, none of these rallies sustained into new upward trends; instead, they merely prolonged the bearish sentiment.
Key news events behind these fear episodes include:
February 4–5, 2018: The SEC launched a large-scale investigation into ICOs; several banks banned credit card purchases of Bitcoin.
March 28 – April 1, 2018: The SEC announced plans to regulate cryptocurrency firms.
May–June 2018: South Korean exchange Coinrail suffered a hack, losing over $40 million; the CFTC issued subpoenas to major exchanges including Coinbase, Kraken, and Bitstamp.
August–September 2018: The SEC delayed decisions on Bitcoin ETF applications; five Chinese government agencies jointly issued warnings against “virtual currency” speculation.
November 20 – December 16, 2018: Bitcoin prices fell 80% from their all-time high, shedding nearly one-third of their value within a week, eventually bottoming around $3,100 in December. Bitcoin mining growth stalled in August, and hash rate began a significant decline in November.
Overall, the primary drivers of fear in 2018 were regulatory pressures, with announcements from agencies like the SEC and CFTC creating widespread anxiety.
Following these fear periods, the market entered a consolidation phase lasting about four months before transitioning into a new uptrend.
2019: Panic Selling After a Mini Bull Run
Compared to 2018, there were far fewer fear episodes in 2019, with only 20 occurrences of the index dropping below 20. These fear periods fell into two categories: one extending from the tail end of the 2018 bear market, and another following a sharp correction after a strong rally—the latter generating even more severe panic than the prior bear phase. On August 21, 2019, the fear index plunged to 5, marking the lowest level ever recorded in crypto history. This extreme fear stemmed largely from consecutive pullbacks following a period of speculative frenzy, leaving market nerves highly fragile.
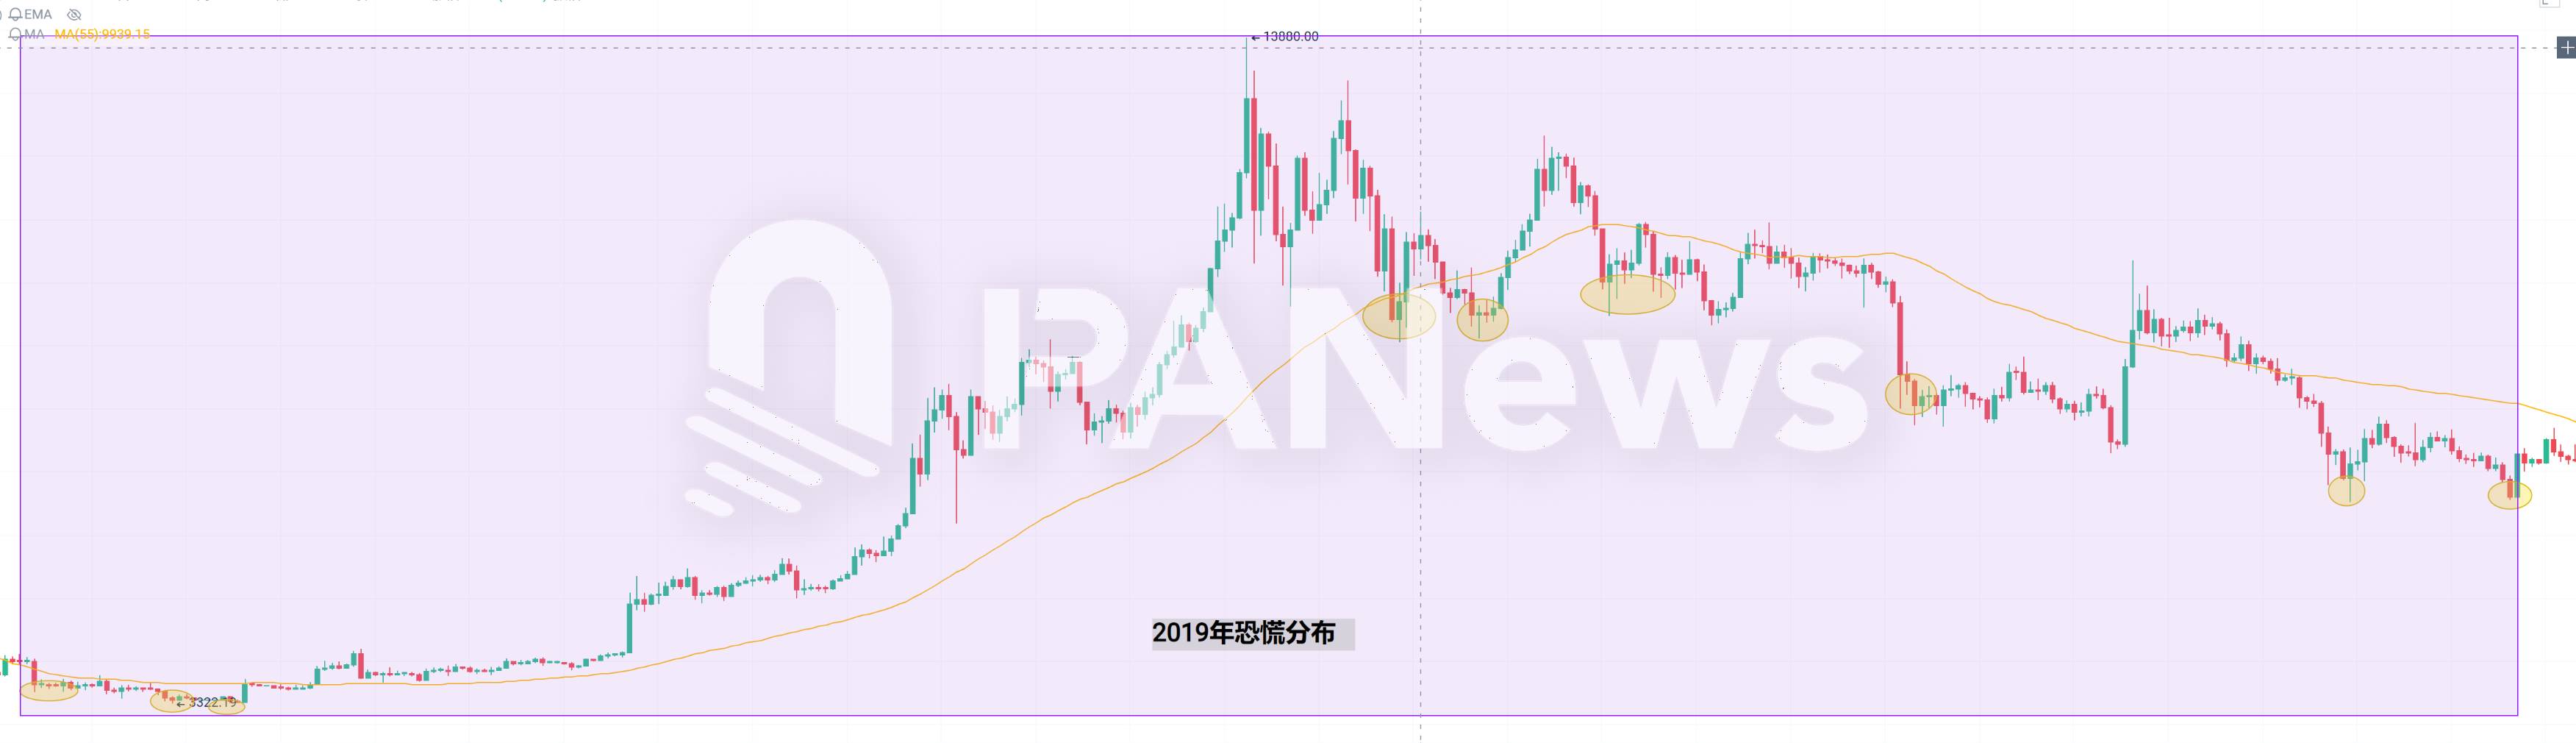
While macro-level news had less influence in 2019, hacks and security breaches still significantly impacted market sentiment. Around ten major exchanges reported cyberattacks during the year, most notably Binance’s May hack involving 7,000 BTC, which drew widespread attention.
Additionally, China began imposing restrictions on Bitcoin mining, prompting many miners to relocate overseas. Several of the year’s sharp declines lacked clear catalysts, suggesting they were driven more by internal market corrections than external news.
2020: The "3.12" Black Swan Event Sparks 43 Days of Fear
Among all years of fear episodes, 2020 stands out as arguably the most painful. Though fear was highly concentrated—mainly in March and April—no readings below 20 occurred outside those two months.
Nonetheless, the crash on March 12 plunged markets into prolonged fear throughout March and April. According to PANews, March alone saw six days with a fear index below 10—the most in history—and the index stayed below 20 for 43 consecutive days during March and April, marking the most intense concentration of fear in crypto history.
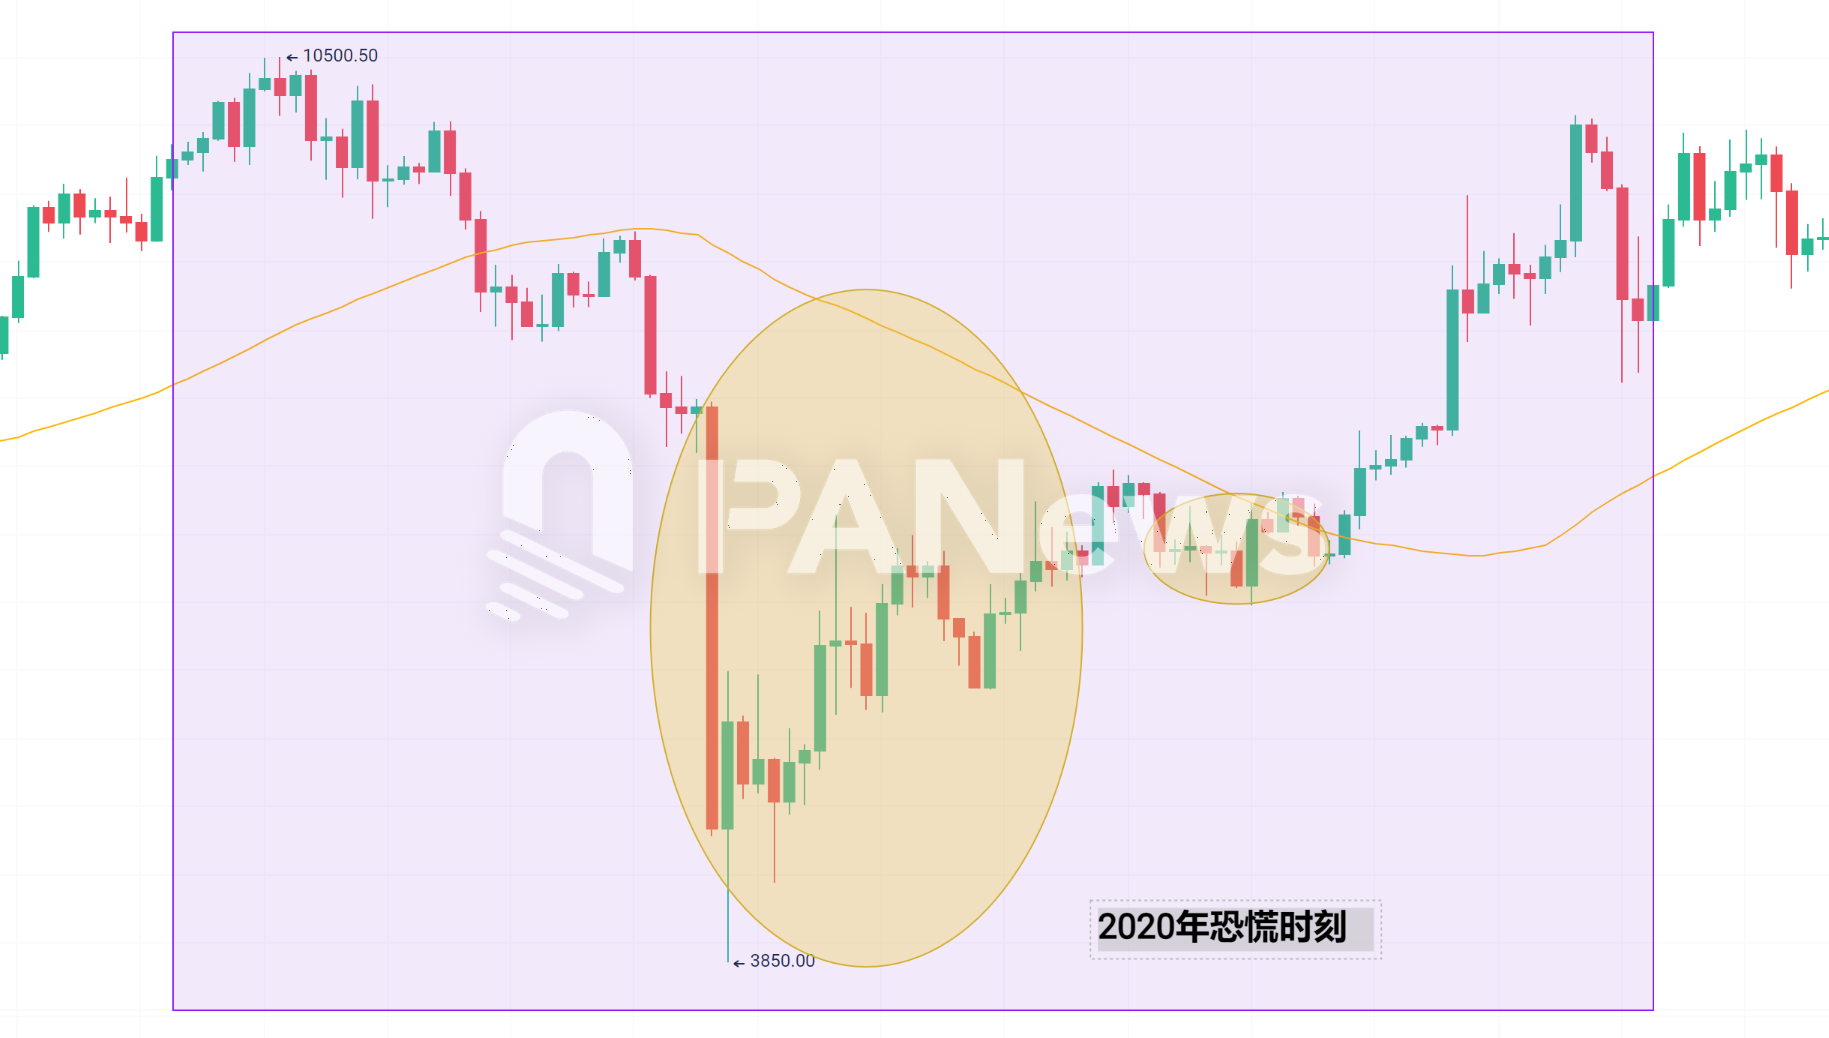
The primary trigger was the outbreak of the COVID-19 pandemic. Global financial markets faced a "Black Thursday" on March 12. As prices dropped sharply, heavily leveraged positions were liquidated en masse, causing Bitcoin to crash 51% in a single day.
Fortunately, the remainder of 2020 saw renewed optimism. Following the pivotal turn after "3.12," the crypto market entered a new bull cycle. According to CoinGecko, the combined market cap of the top 30 cryptocurrencies surged 308% in 2020, far exceeding the 62% gain in 2019. Bitcoin rebounded from a low of $3,850 to a high of $64,895—an almost 17-fold increase over 400 days.
2021: FUD Strikes and Market Shakes
The market faced another severe downturn in 2021, driven by multiple factors. First, Tesla CEO Elon Musk announced on May 12 that Tesla would halt vehicle purchases using Bitcoin due to environmental concerns over mining. Then, on May 18, the People's Bank of China reiterated that digital tokens cannot be used as currency and prohibited financial institutions and payment platforms from offering crypto-related services, further intensifying sell-off pressure.
The market subsequently slumped, remaining in a state of fear until entering a consolidation phase in August.
However, starting in August, the crypto market rallied again, pushing Bitcoin to a record high of $69,000. By December, as the market began another correction, fear returned.
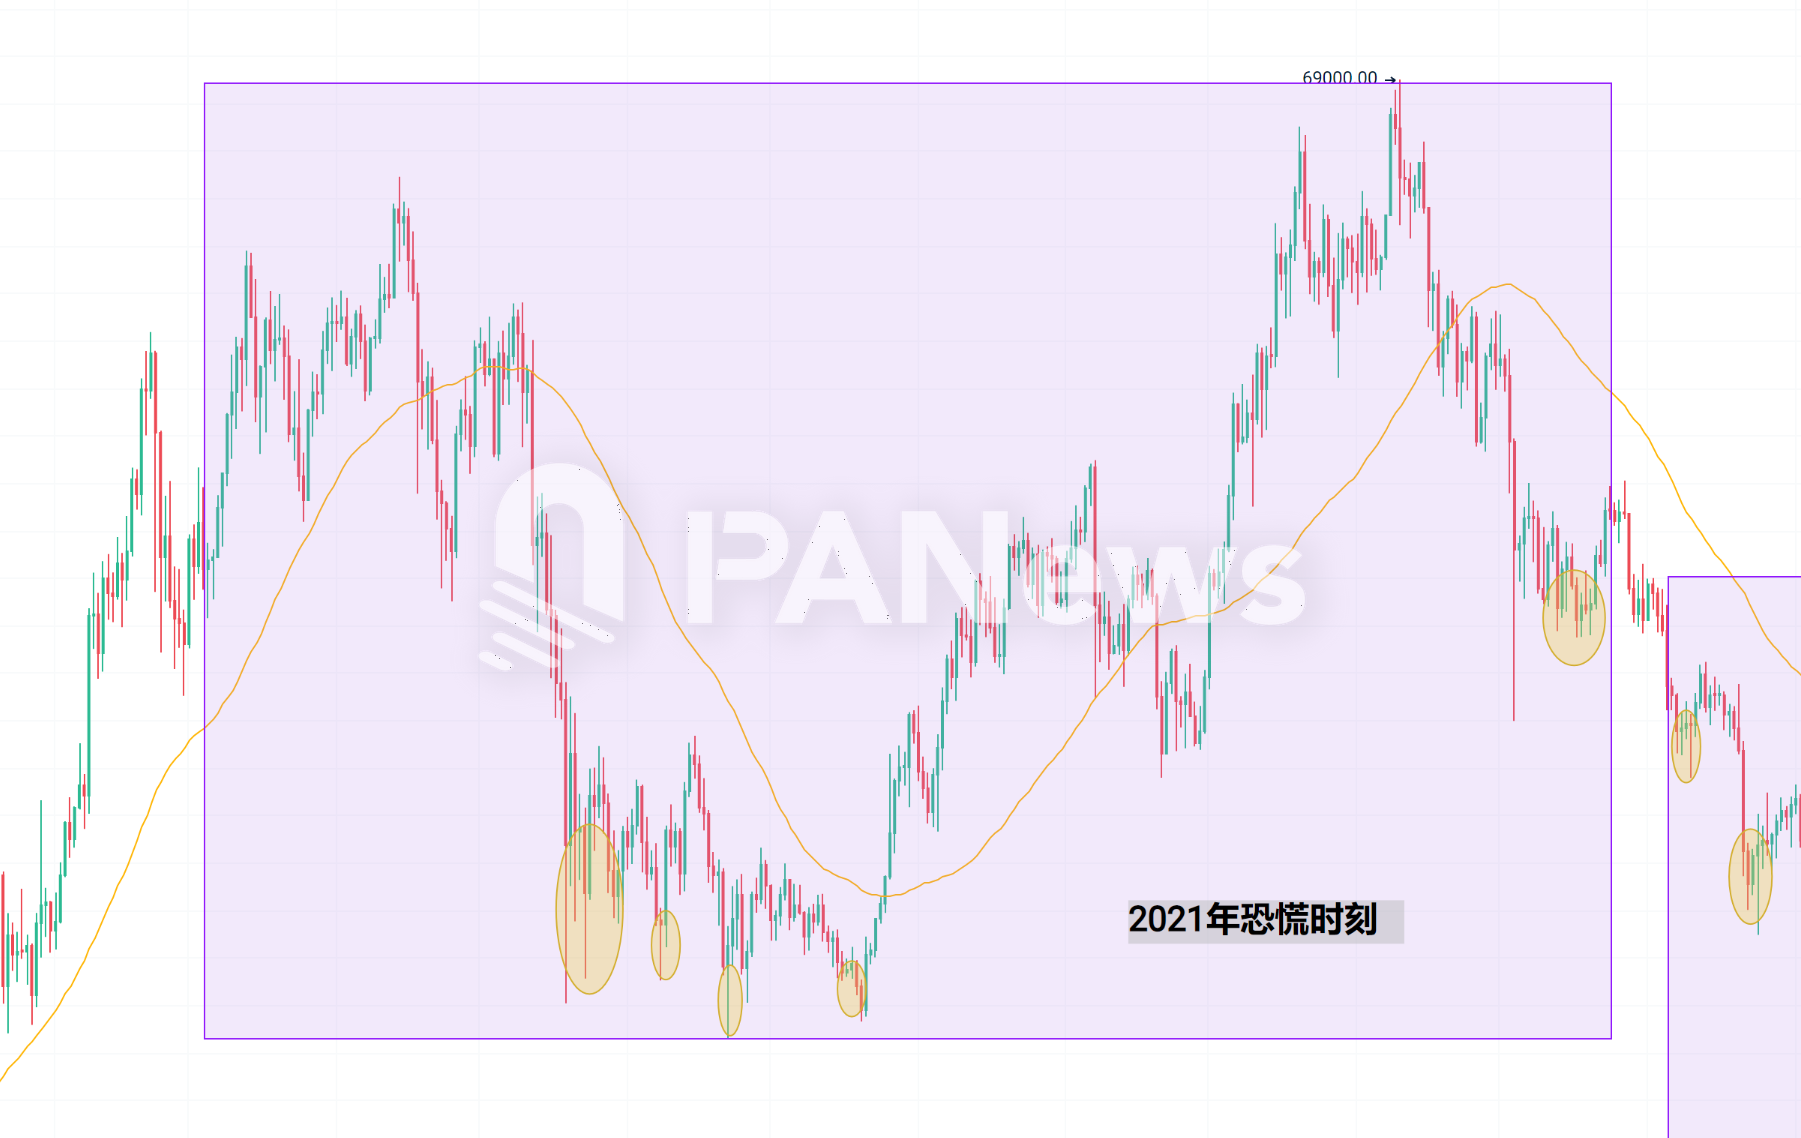
Overall, fear episodes in 2021 generally marked the end of bullish phases.
2022: Luna Collapse Triggers 65 Consecutive Days of Fear
The fear episodes in 2022 can be divided into three segments. The first two were continuations of the 2021 downtrend. The third was a prolonged 65-day stretch of fear—the longest in history. The fear index dipped as low as 6, second only to the 2019 low of 5.
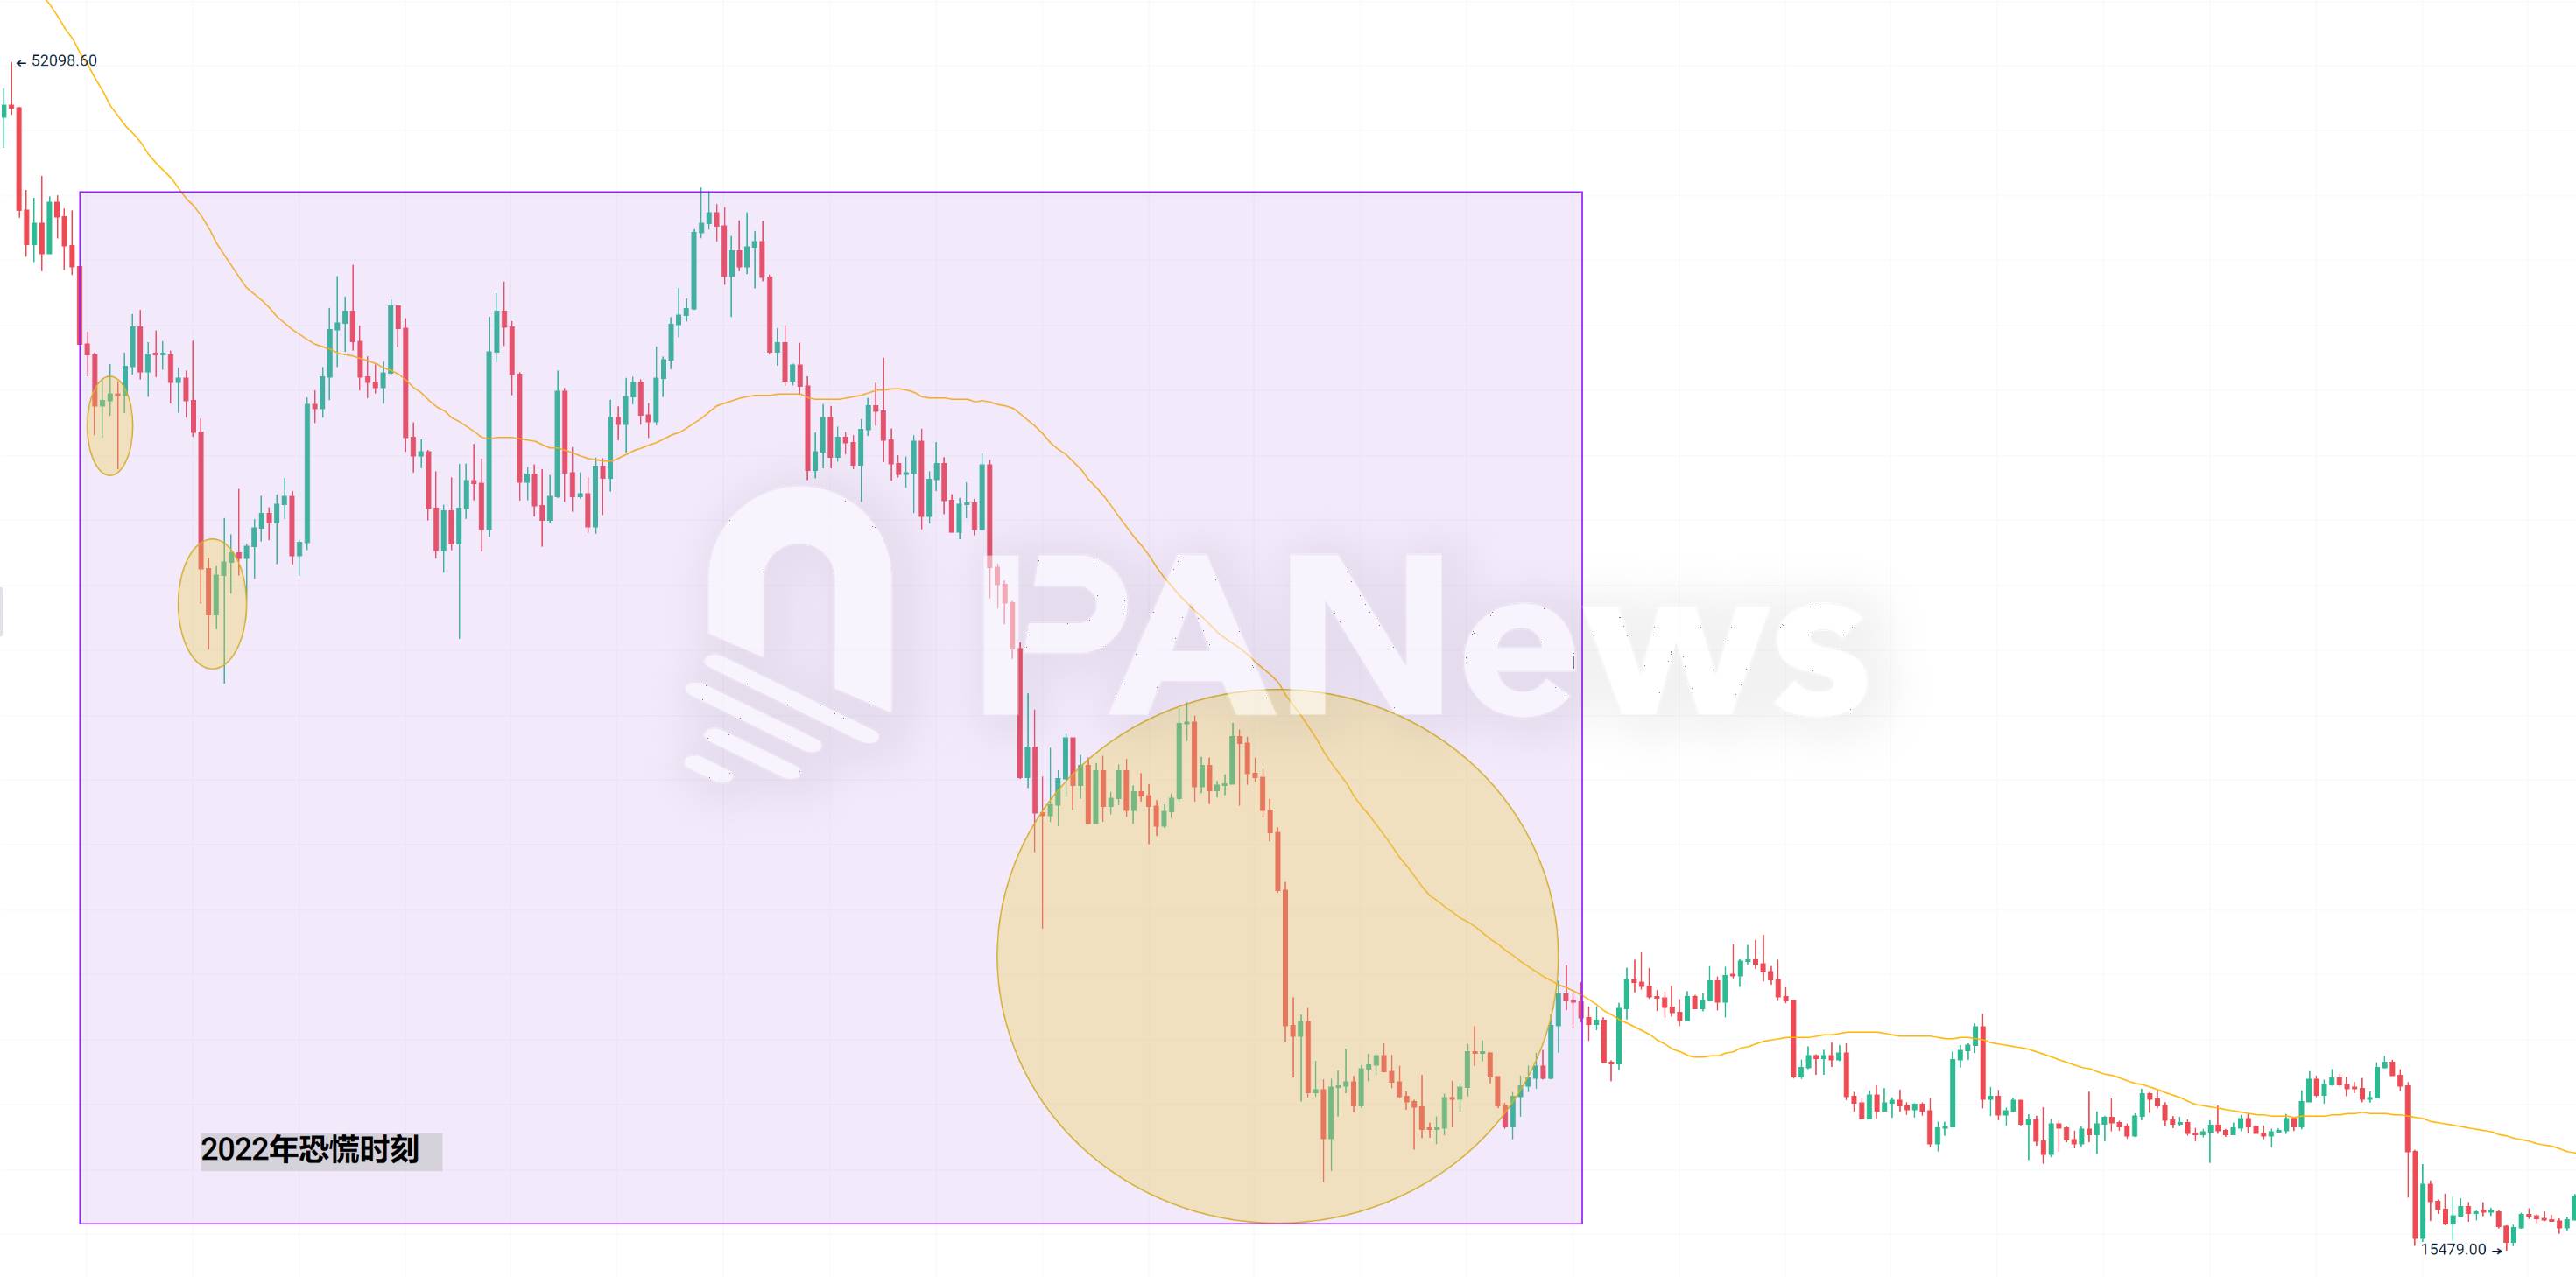
The main catalyst was the collapse of Terra/Luna. On May 9, UST depegged from the dollar and the Terra blockchain halted. Celsius Network suspended all withdrawals on June 13. Three Arrows Capital (3AC) defaulted in June and was ordered liquidated in July. Bitcoin broke below $30,000 for the first time since July 2021. By July 13, the total crypto market cap had fallen to $871 billion.
However, the 2022 crash wasn’t solely due to Luna’s implosion. The FTX exchange collapsed in November, plunging the market back into panic. Bitcoin hit a three-year low of $15,479. Yet, this event did not register as strongly on the fear index, which only dropped to 20.
This illustrates an important point: when markets are near the end of a bear cycle, even dramatic real-world events may not reflect fully in the index. Conversely, when widespread panic is felt but the index remains stable, it could signal an impending market reversal.
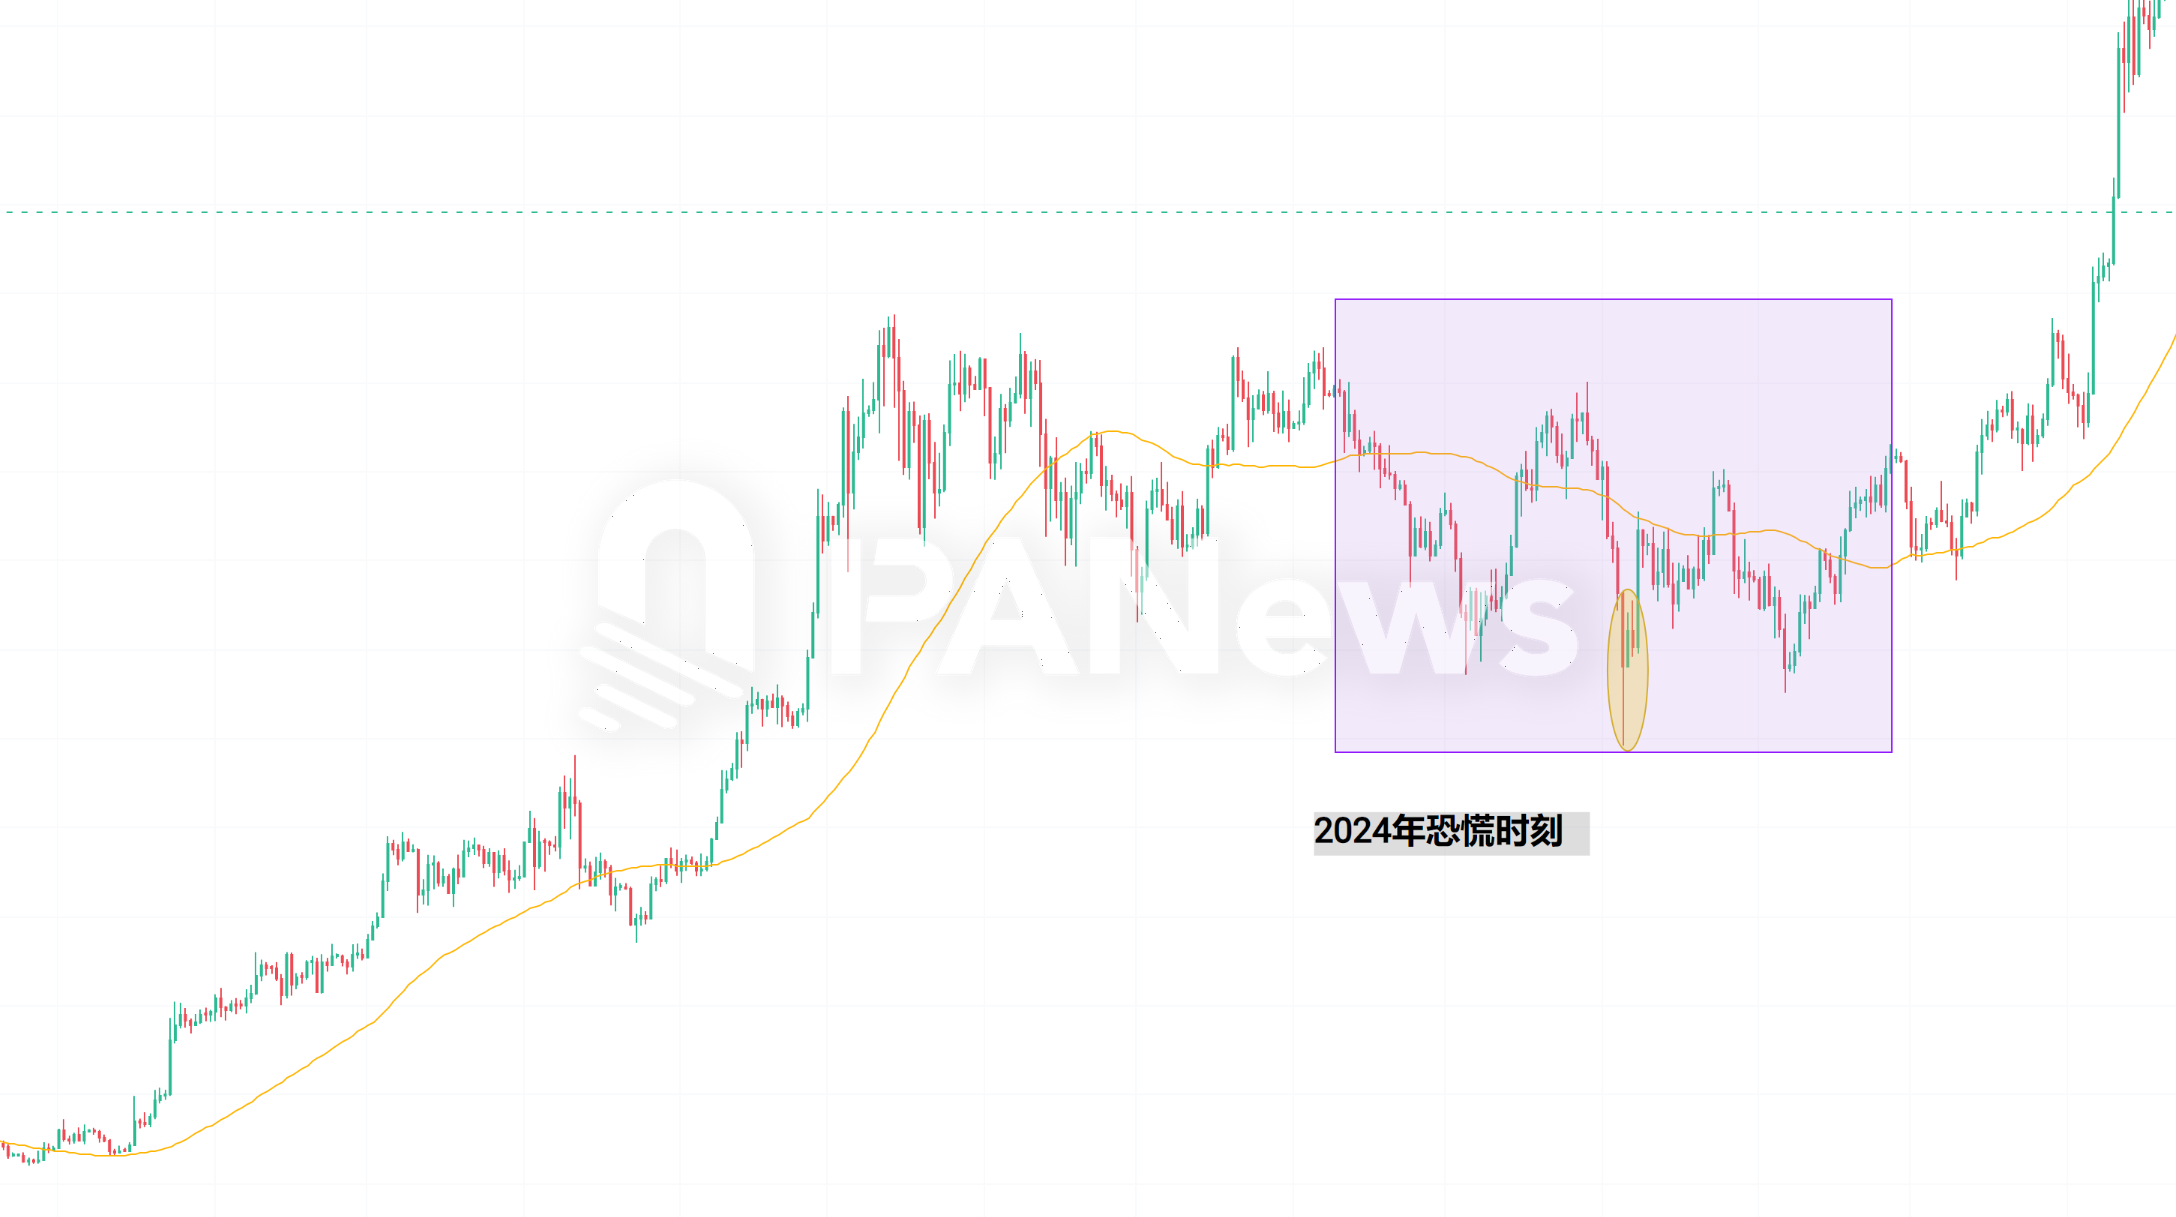
2023–2024: Retreat of Fear and Market Recovery
After hitting bottom in 2022, the market fully re-entered a bullish phase. Throughout 2023, the fear index never dropped below 20. It wasn't until August 2024 that it briefly fell to 17, marking a single episode of extreme fear—a rapid pullback amid an ongoing uptrend.
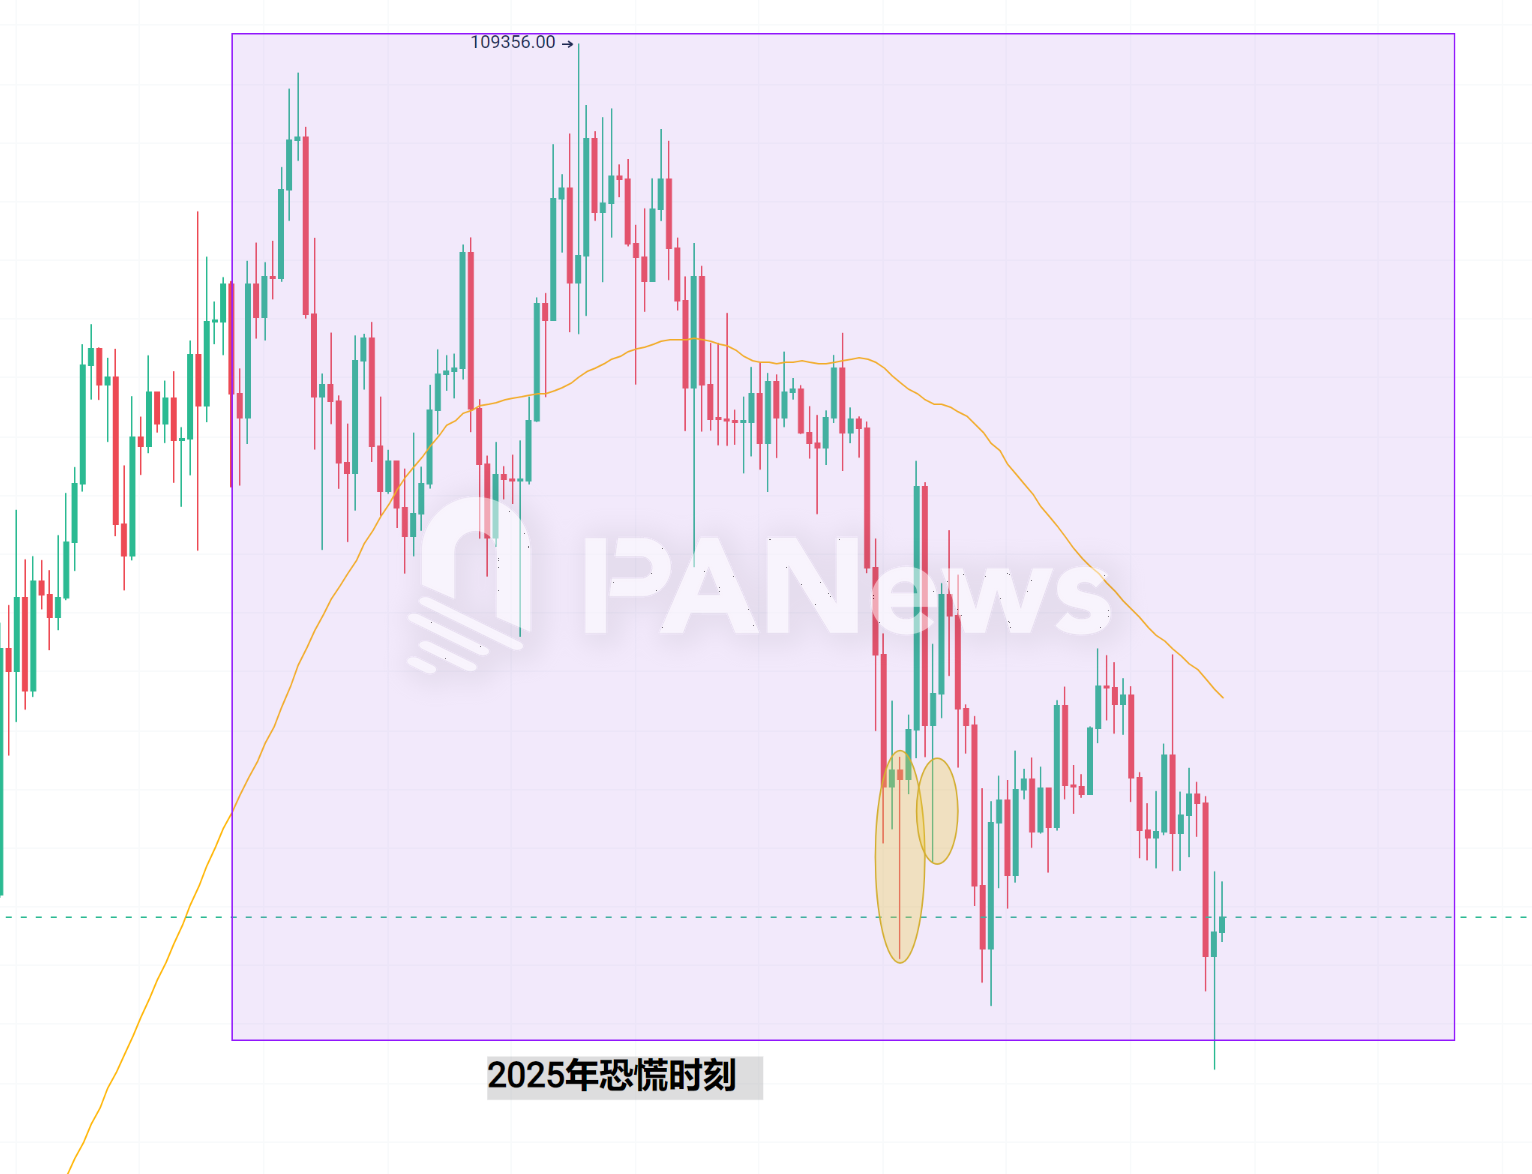
2025: Fear Returns Amid Uncertain Outlook
In 2025, fear episodes have begun to resurface more frequently. As of April 8, the fear index has dipped below 20 three times—reaching a low of 10 on February 26, then 15 on March 3. On April 7, global financial markets crashed amid Trump administration plans to raise global tariffs, sending Bitcoin below $75,000. Yet, the fear index did not fall below 20. This mirrors the situation during the FTX collapse in November 2022, when the index also failed to plunge dramatically. While the FTX crash ultimately marked the market bottom before a strong recovery and bull run, it remains unclear whether the current tariff-driven turmoil signals the start of a deeper downturn or the beginning of a new accumulation phase.
Reflections After 239 Fear Episodes
Reviewing all extreme fear episodes since the index's inception, PANews data reveals that over six and a half years, the crypto market has seen 239 instances of extreme fear (index < 20). In most cases, these episodes were triggered by sharp price drops and coincided with short-term local bottoms.
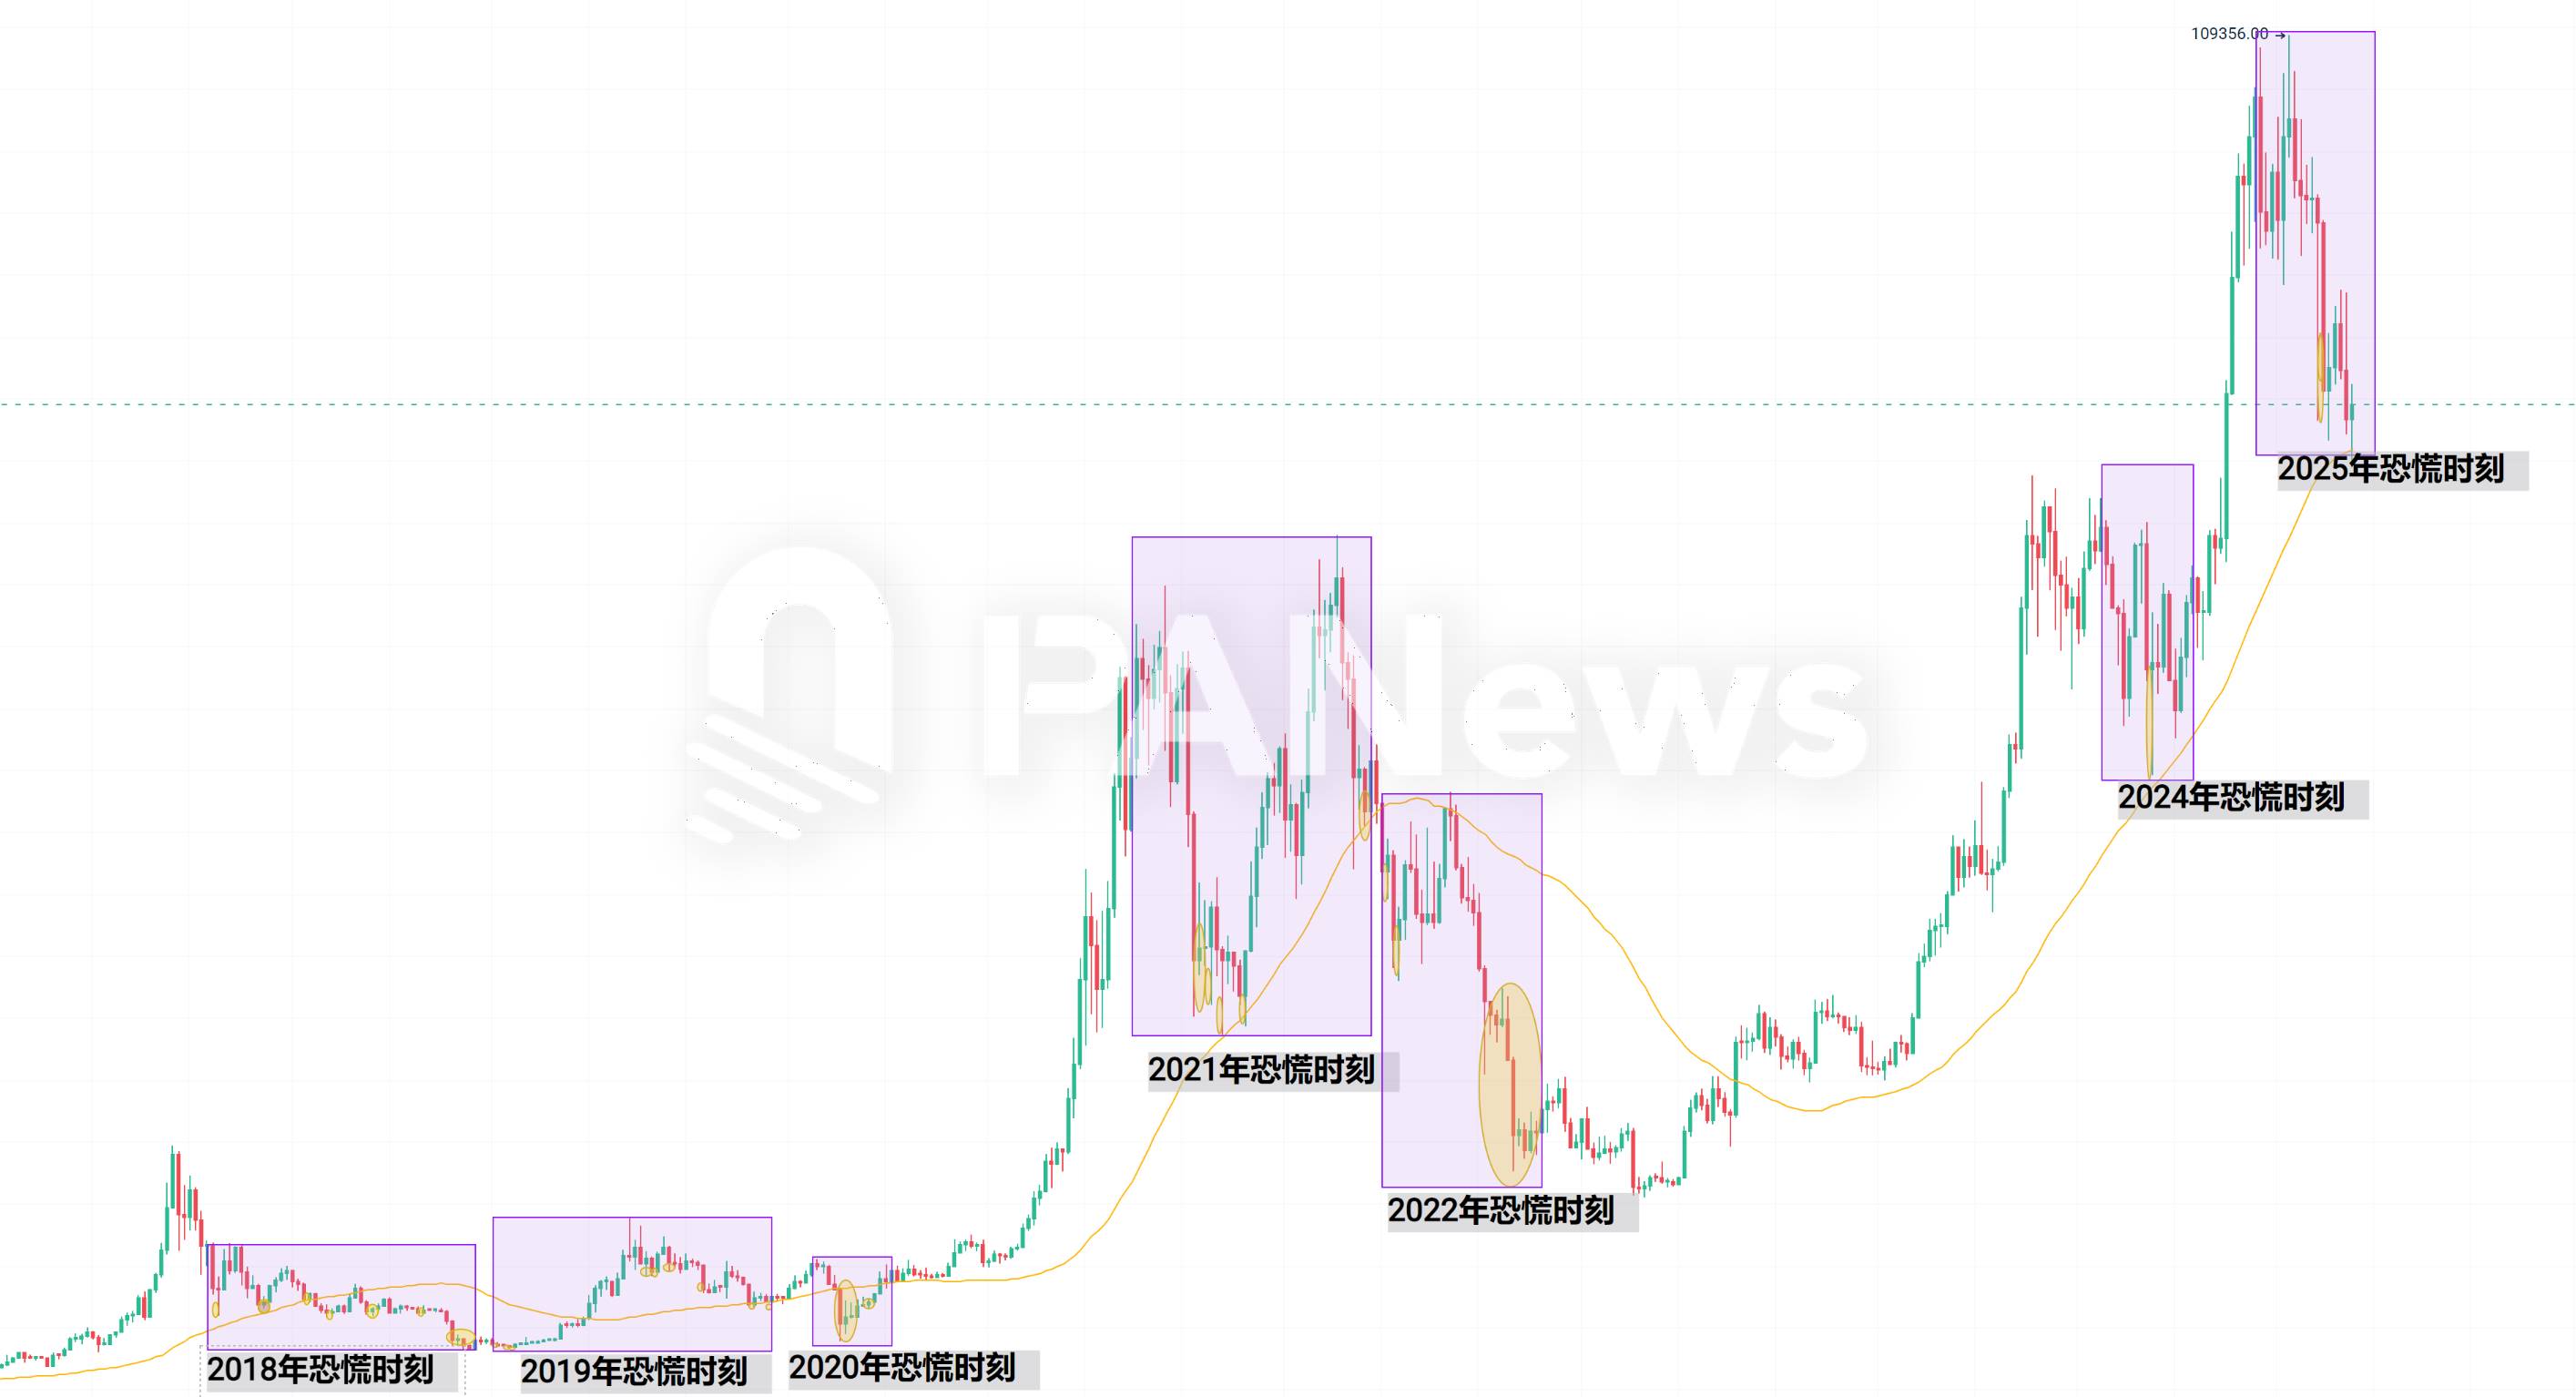
Further analysis leads PANews to identify several notable patterns:
1. Extreme fear episodes tend to cluster in two phases: at the tail end of bear markets, when shrinking liquidity makes markets hypersensitive to shocks—often accompanied by black swan events like "3.12" or the FTX collapse; or in the early stages of a bull market’s reversal, when prices fail a second breakout attempt and trigger panic selling. During strong, one-way bull runs, the fear index rarely drops below 20.
2. The duration of consecutive fear days holds greater predictive value. Whether it was 27 days in late 2018, 43 days in early 2020, or 65 days in mid-2022—all prolonged stretches of sub-20 readings signaled markets nearing a bottom. Extended periods of deep fear often mark the beginning of a "when things get bad enough, they get better" reversal.
3. Isolated and infrequent fear episodes offer limited insight into broader trend direction. Many believe that a rebound typically follows extreme fear. While this often holds true in the short term, over longer horizons, sporadic fear events do not necessarily indicate a trend reversal—they usually just confirm that the market remains in a bearish phase (see fear episodes from February to November 2018 or July to September 2019).
4. Fear episodes have become less frequent in recent years. There were 93 in 2018 and 73 in 2022, but only one in both 2023 and 2024. One reason is the growing size of the crypto market, which has reduced volatility. But conversely, after two relatively calm years, 2025 may be entering a phase of more frequent fear episodes.
Across the 239 "extreme fear" episodes from early 2018 to early 2025, a rhythmic pattern in crypto market sentiment emerges: fear tends to concentrate at the end of bear markets and at the turning point when bull markets begin to reverse. Prolonged, multi-day fear streaks are more reliable indicators of an approaching bottom than isolated incidents, reinforcing the market adage that "what goes too far must return."
History doesn't repeat itself exactly, but it often rhymes. Understanding the signals conveyed by the fear index—carefully distinguishing short-term noise from long-term trends—while factoring in macro developments and structural shifts, will remain crucial for navigating the ever-changing crypto landscape. Ultimately, whether today’s environment marks the beginning of a new downturn or yet another “buy the fear” opportunity, only time will tell.
Join TechFlow official community to stay tuned
Telegram:https://t.me/TechFlowDaily
X (Twitter):https://x.com/TechFlowPost
X (Twitter) EN:https://x.com/BlockFlow_News


