








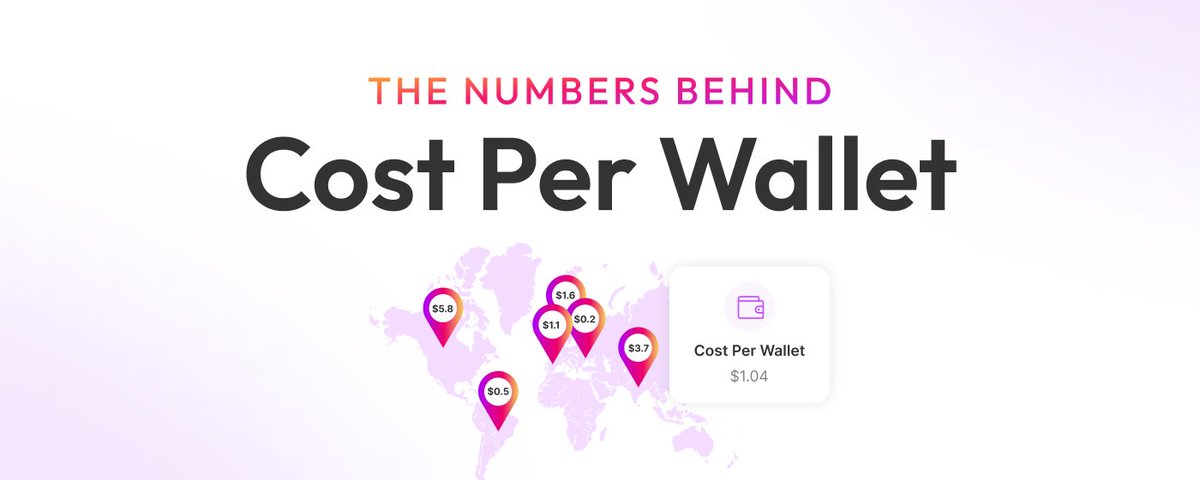
Decoding the Customer Acquisition Cost of Crypto Products: Just How "Precious" Are Crypto Users?
TechFlow Selected TechFlow Selected
Decoding the Customer Acquisition Cost of Crypto Products: Just How "Precious" Are Crypto Users?
The customer acquisition cost for a single wallet is closely related to market cycles, geographic regions, and the effectiveness of marketing campaign execution.
 Navigating Web3 tides with focused insights
Written by: Asaf Nadler, COO of Addressable
Translated by: Luffy, Foresight News
About a month ago, I published an article on "Cost Per Wallet" (CPW), a Web3-specific growth metric that measures the cost of acquiring website visitors who install a wallet in their browser.
The response was overwhelming. Marketers, advertising agencies, and project founders joined the conversation, sharing their thoughts, challenges, and data insights. One thing became clear: CPW struck a nerve. Among numerous direct messages and replies, one question stood out:
"Tell me about costs—how do they vary by time, region, platform? Does success change how we calculate cost?"
This article answers that question with concrete data. I analyzed over 200 programmatic ad campaigns run in 2024 by more than 70 advertisers on the Addressable platform, targeting over 1.5 million users globally, to study CPW across market cycles, regions, campaign performance, and audience segments.
CPW Trends in 2024: How Market Cycles Impact Costs
Bull and bear cycles: 2024 experienced two distinct market phases. The year began strong, with Q1 in a bull market as the total crypto market cap grew 21% quarter-on-quarter to $1.7 trillion. However, momentum reversed in Q2 with a 12% decline, worsening further in Q3 with a 27% drop. By Q4, the market rebounded sharply with a 109% increase, entering another bull phase. These shifts naturally affected CPW—but not uniformly.
The fluctuation of CPW across market cycles reveals more than the expected pattern of lower costs in bull markets and higher in bear markets. It also highlights regional sensitivity to market volatility, the importance of timing, and the strategic advantage of targeting resilient markets.
Developed Markets: Mature markets like the U.S. and Western Europe tend to offer more predictable CPW during bull runs but exhibit high elasticity. In Q1, the U.S. CPW averaged $5.87, but as sentiment shifted in Q3, costs surged nearly fourfold to $22.81. Western Europe showed a similar trend with even greater volatility, jumping 27 times from $1.18 to $32.79. While these markets deliver scale and quality during bullish periods, costs rise significantly when sentiment turns bearish, reducing their sustainability during downturns.
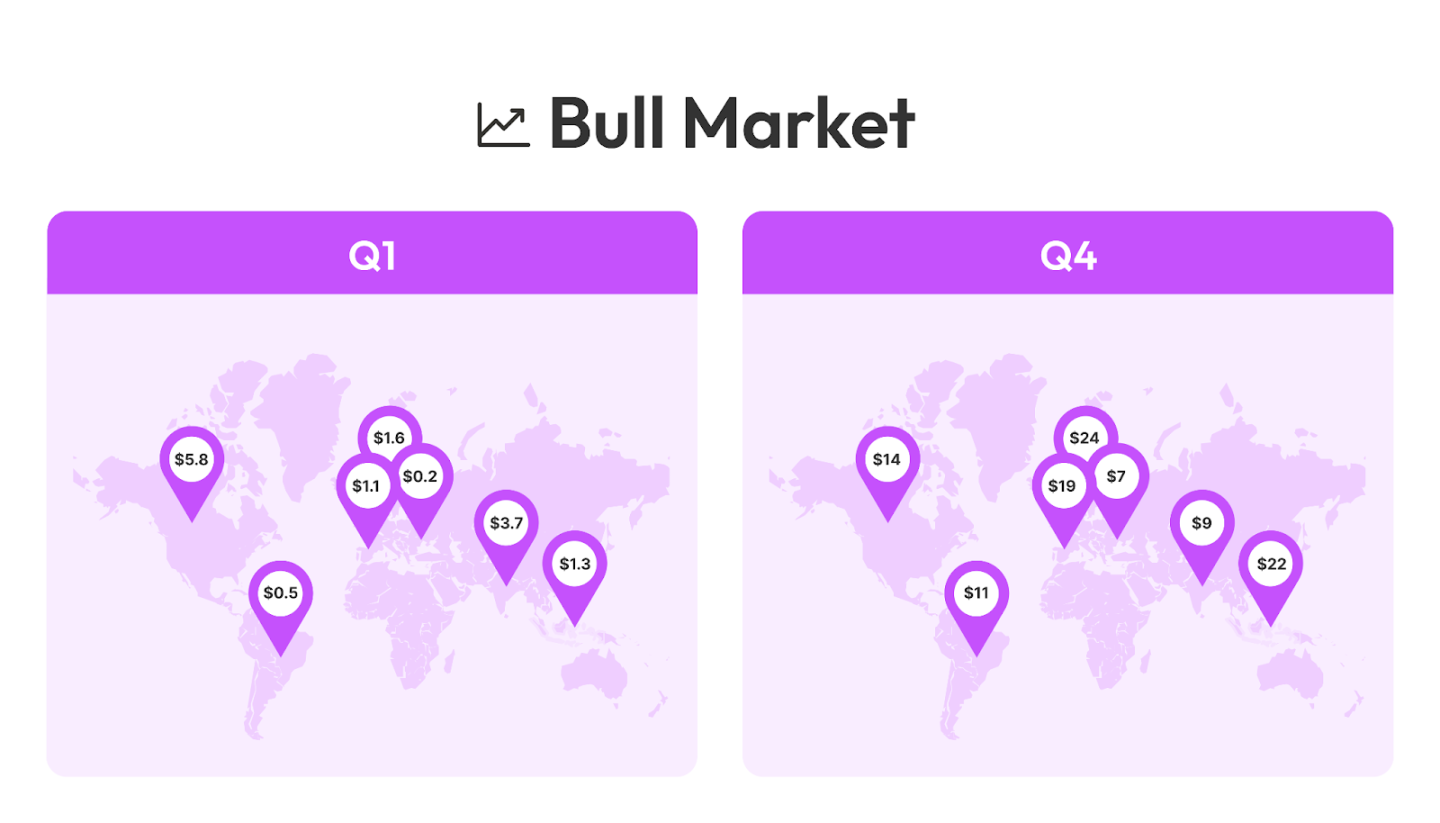
Emerging Markets: Present a different risk-reward profile. Under favorable conditions, CPW is extremely low, but costs can swing dramatically. For example, Latin America’s CPW was nearly free at $0.56 in Q1, but spiked 60 times to $34.38 in Q3, reflecting sudden liquidity constraints and shifting demand. Eastern Europe saw an even more dramatic rise, with CPW increasing 99-fold from $0.21 to $20.79, indicating sharp cost escalations when market conditions deteriorate.
Southeast Asia: Demonstrated the most stability across market cycles, with CPW fluctuating less than fivefold—from $3.73 in Q1 to $16.61 in Q3. This resilience suggests local market dynamics, adoption curves, or advertiser demand create a more predictable environment, making it highly attractive for brands seeking stable acquisition costs under varying macro conditions—especially for projects aiming to test product usage independent of market cycles.
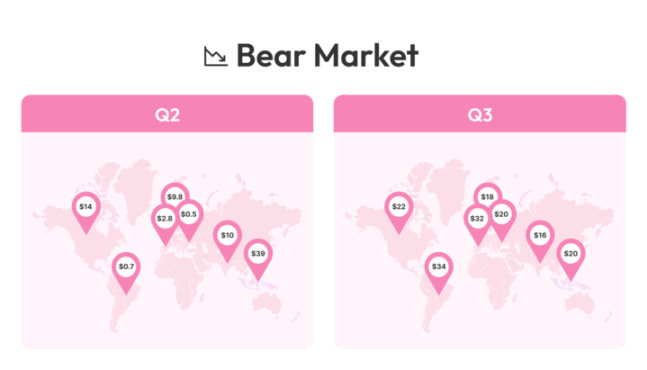
The key takeaway is that market cycles don’t just influence CPW—they determine where and when acquiring wallet holders is feasible. While developed markets are efficient during bull runs, they become costly in downturns. Emerging markets offer ultra-low costs but come with extreme volatility. Southeast Asia, due to its relative stability, may offer the best long-term potential for brands looking to de-risk across market cycles.
CPW of Top vs. Bottom Performing Campaigns
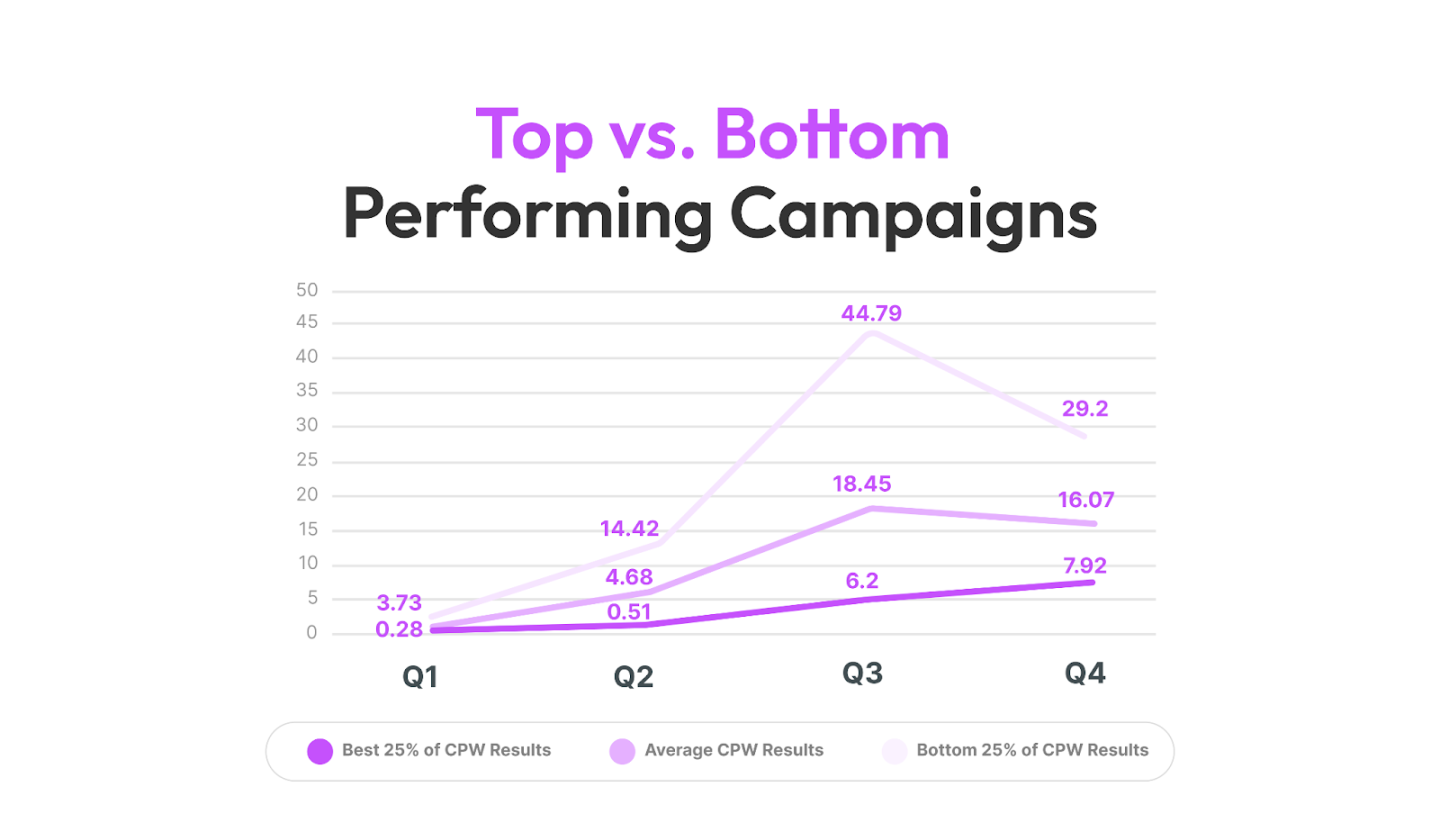
Market cycles aren't the only factor. Top-performing campaigns consistently maintain low CPW—even during market slumps. In fact, the top 25% of campaigns achieved a remarkable CPW of just $6–$8 per wallet even in bearish periods. In contrast, poorly performing campaigns saw CPW fluctuate between $4.68 and $44.79.
This performance gap stems from product-market fit (PMF), community strength, market热度, incentives, and creative execution. Campaigns with strong audience alignment and optimized messaging sustain affordable CPW regardless of market conditions.
For campaigns struggling with high CPW, shifting to lower-cost regions isn't the only solution. Optimizing audience targeting, messaging, incentives, and creative strategy can boost efficiency and stabilize CPW across any market environment.
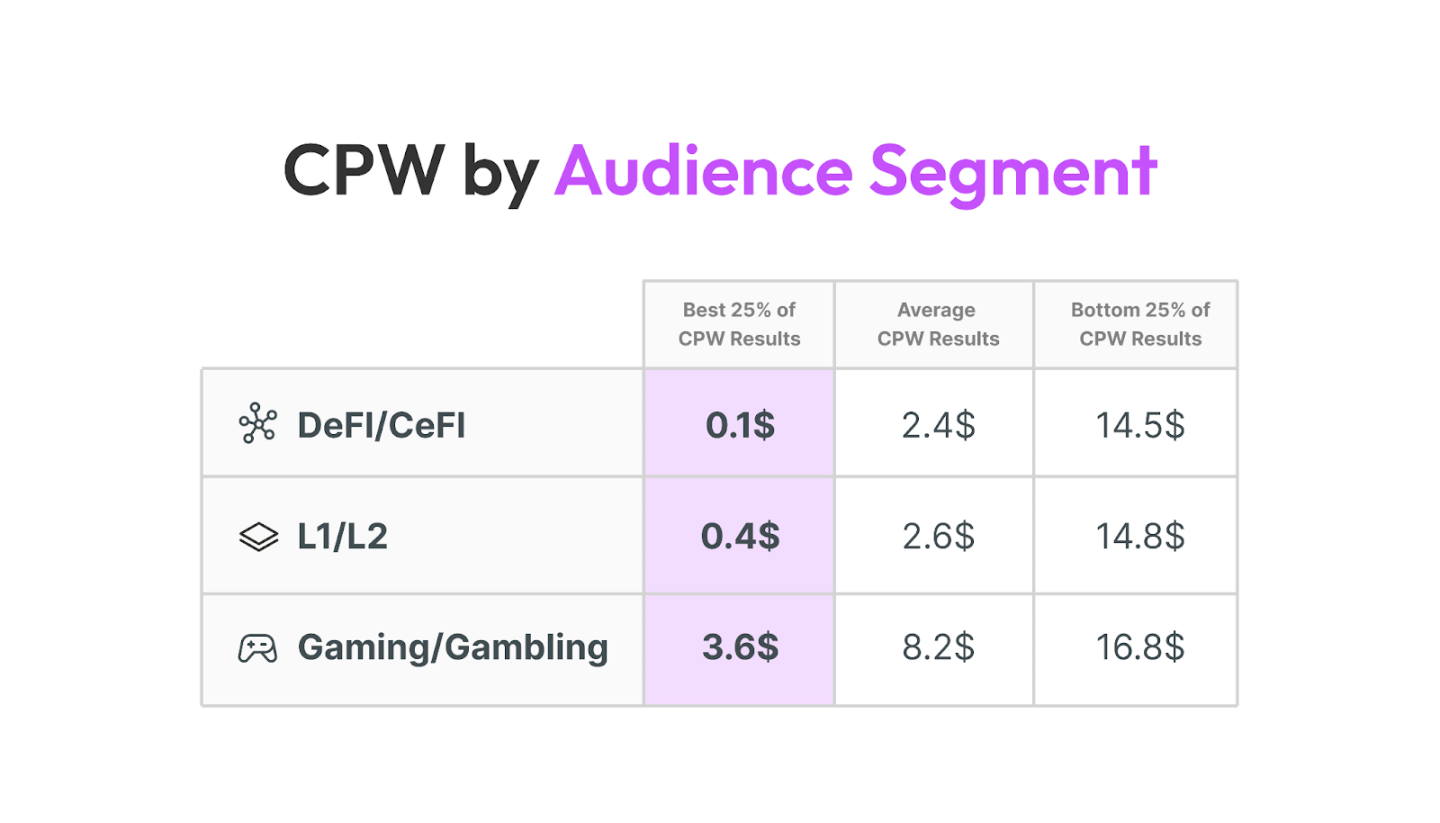
CPW by Audience Segment
DeFi/CeFi campaigns were the most cost-efficient, with a median CPW of $2.79 and a lower quartile of just $0.10. L1/L2 projects followed closely with a median CPW of $3.23, reflecting higher adoption rates.
Gaming and gambling campaigns had the highest costs, with a median CPW of $8.74 and a lower quartile of $3.40—likely due to high churn, speculative behavior, and intense competition. If Web3 gaming is truly "unstoppable," we need a more robust user acquisition engine to achieve the same sustainability as Web2 games.
Conclusion: CPW as a Web3 Growth Framework
CPW is not solely determined by market cycles—it's heavily influenced by campaign execution. The top 25% of campaigns maintained a CPW of $6–$8 throughout the year, even during downturns, while underperforming campaigns saw CPW swing from $4.68 to $44.79. This proves market conditions are no excuse: teams that track data, optimize targeting, refine messaging, and iterate on incentives can outperform market cycles and sustain efficiency regardless of macro trends.
This should shift our product launch strategy. Targeting affluent investors in the U.S. during a bear market is an expensive gamble, pushing CPW to unsustainable levels. Instead, starting in more stable, cost-effective regions like Southeast Asia allows brands to refine product-market fit before expanding into mature markets. Teams that skip this step risk burning through budgets before proving demand or optimizing conversion rates.
Finally, these data-driven results from ad-powered campaigns challenge the notion that Web3 advertising “doesn’t work.” On the contrary, they show that ad-driven Web3 growth is measurable, scalable, and far from a dead end.
Join TechFlow official community to stay tuned
Telegram:https://t.me/TechFlowDaily
X (Twitter):https://x.com/TechFlowPost
X (Twitter) EN:https://x.com/BlockFlow_News
 @AsafNadler









