
The Hidden Code of Price Swings: How Global Liquidity Shapes Bitcoin's Movements?
TechFlow Selected TechFlow Selected
The Hidden Code of Price Swings: How Global Liquidity Shapes Bitcoin's Movements?
Global liquidity is a key factor influencing Bitcoin's price, and its cyclical volatility and lag effects reveal market trends more clearly than absolute values. Current liquidity recovery may drive Bitcoin higher by the end of March.
 Navigating Web3 tides with focused insights
Author: Bitcoin Magazine Pro
Translation: Baicai Blockchain
Bitcoin's price movements are typically analyzed through on-chain data, technical indicators, and macroeconomic trends. However, one severely underestimated yet critically important factor is global liquidity. Many investors may not be fully utilizing this indicator, or even misunderstand how it influences Bitcoin’s cyclical trends.
1. The Impact of Global Liquidity on Bitcoin
As discussions about global liquidity heat up on platforms like Twitter (X), and analysts dive deeper into liquidity data, understanding the relationship between global liquidity and Bitcoin’s price has become essential for both traders and long-term investors. However, recent market behavior has deviated from traditional expectations, suggesting that a more nuanced analytical perspective may be required.
Global M2 money supply refers to the total sum of all liquid money, including cash, demand deposits, and near-money assets that can be easily converted into cash.
When global M2 expands, capital typically flows into high-yield assets such as Bitcoin, equities, and commodities, driving prices upward.
Conversely, when M2 contracts, market liquidity tightens, and risk assets often face downward pressure on valuations.
In the current market environment, the traditional relationship between liquidity and asset prices may be shifting—posing greater demands on investor comprehension.
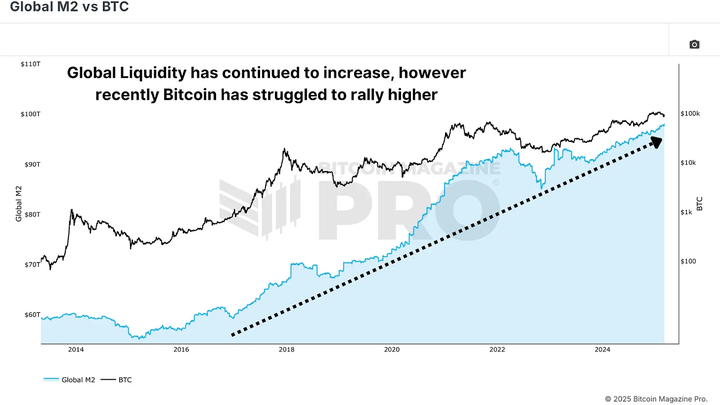
Figure 1: Global liquidity is rising, yet Bitcoin’s price has recently declined
Historical Trends: Divergence Between Bitcoin Price and Global M2
In the past, Bitcoin’s price typically rose with expansions in global M2 money supply and faced downward pressure during periods of liquidity contraction. However, in this cycle, we observe a clear divergence: despite continued growth in global M2, Bitcoin’s price performance has been inconsistent.
2. Year-over-Year Changes: A More Accurate Measure of Liquidity
Rather than focusing solely on the absolute level of global M2, a more insightful approach is to analyze its year-over-year (YoY) growth rate. This metric reflects the pace of liquidity expansion or contraction, revealing a clearer connection between liquidity and Bitcoin’s price performance.
When comparing Bitcoin’s year-over-year returns (YoY Return) with the year-over-year change in global M2 (M2 YoY Change), the correlation becomes significantly stronger.
Bitcoin’s strongest bull markets often occur during periods of rapid liquidity expansion.
Liquidity contraction typically precedes Bitcoin price corrections or extended consolidation phases.
This insight suggests that investors should pay closer attention to the rate of change in global liquidity, rather than just its absolute level.
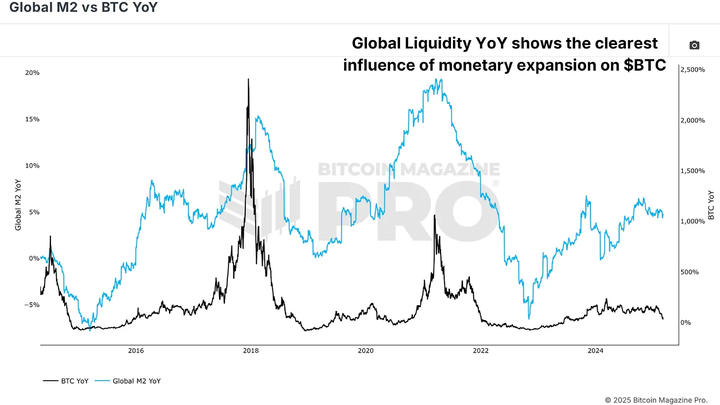
Figure 2: The annual change rate of global liquidity more clearly reveals liquidity cycles
For example, during Bitcoin’s consolidation phase in early 2025, global M2 continued steady growth, but its rate of increase plateaued. Only when the pace of M2 expansion accelerates significantly might Bitcoin break out to new highs.
3. The Lag Effect of Liquidity
Another key observation: the impact of global liquidity on Bitcoin is not immediate. Research shows that Bitcoin’s price typically lags behind changes in global liquidity by approximately 10 weeks.
If the global liquidity indicator is shifted forward by 10 weeks, the correlation with Bitcoin’s price movement strengthens significantly.
Further optimization reveals that the most accurate lag period is around 56 to 60 days—approximately two months.
This lag effect means that investors must account for time delays when assessing how liquidity affects Bitcoin, rather than focusing only on current liquidity levels.
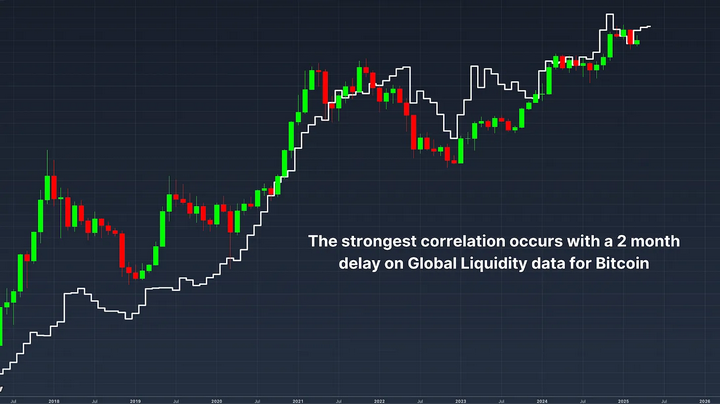
Figure 3: Correlation is strongest when liquidity data leads by two months
4. Bitcoin Outlook
For much of 2025, global liquidity entered a sideways phase, following the strong expansion at the end of 2024 that propelled Bitcoin to new highs. This period of flatlining liquidity coincided precisely with Bitcoin’s consolidation and pullback to around $80,000.
However, if historical patterns hold, the recent rebound in global liquidity is expected to fuel a new upward move in Bitcoin around late March.
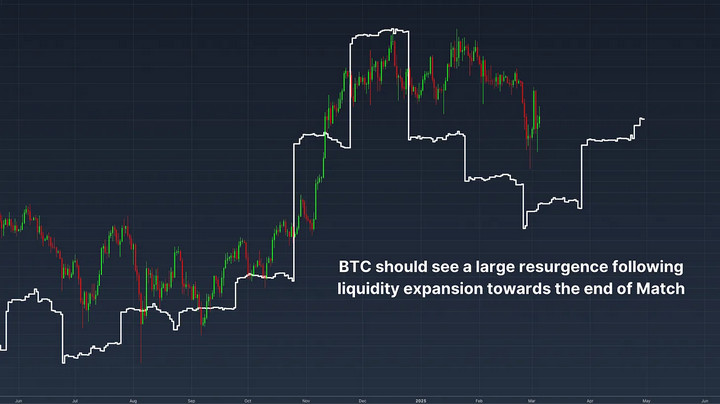
Figure 4: Liquidity is surging, but Bitcoin may need several more weeks to fully benefit
5. Conclusion
Global liquidity is a crucial macro indicator for predicting Bitcoin’s trajectory. Rather than relying on static M2 figures, a more effective approach is to focus on the rate of change in M2 and recognize that Bitcoin’s price typically lags by about two months.
As global economic conditions evolve and central banks adjust monetary policies, Bitcoin will continue to be influenced by liquidity trends. The coming weeks will be critical—if global liquidity continues to accelerate, Bitcoin could be poised for a significant move.
Join TechFlow official community to stay tuned
Telegram:https://t.me/TechFlowDaily
X (Twitter):https://x.com/TechFlowPost
X (Twitter) EN:https://x.com/BlockFlow_News
 @BitcoinMagazine