
Bitcoin's market dominance rises to a three-year high—has the market once again reached a阶段性 peak?
TechFlow Selected TechFlow Selected
Bitcoin's market dominance rises to a three-year high—has the market once again reached a阶段性 peak?
How many times is this now that you've been trapped at 69,000?
 Navigating Web3 tides with focused insights
Author: Chandler, ForesightNews
On October 24, market data showed that Bitcoin's price dropped below $66,000. Since October 21, Bitcoin’s upward momentum has weakened, falling from a high of $69,500 to a low of $65,260. Ethereum followed a similar trend, sliding from its peak at $2,770 down to a low of $2,440. According to Coinglass, total liquidations in the past 24 hours reached $279 million, with long positions accounting for $202 million.
Has the market once again reached a阶段性 top? Perhaps we can find some clues from on-chain data.
Bitcoin Dominance Reaches Three-Year High
The Bitcoin Dominance Index (BTC.D) measures Bitcoin's market capitalization as a percentage of the overall cryptocurrency market. Since around September 2022, BTC dominance has been on an overall rising trend. According to CoinMarketCap data, BTC dominance recently approached 58%, up more than 8% over the year and marking its highest level since April 2021.
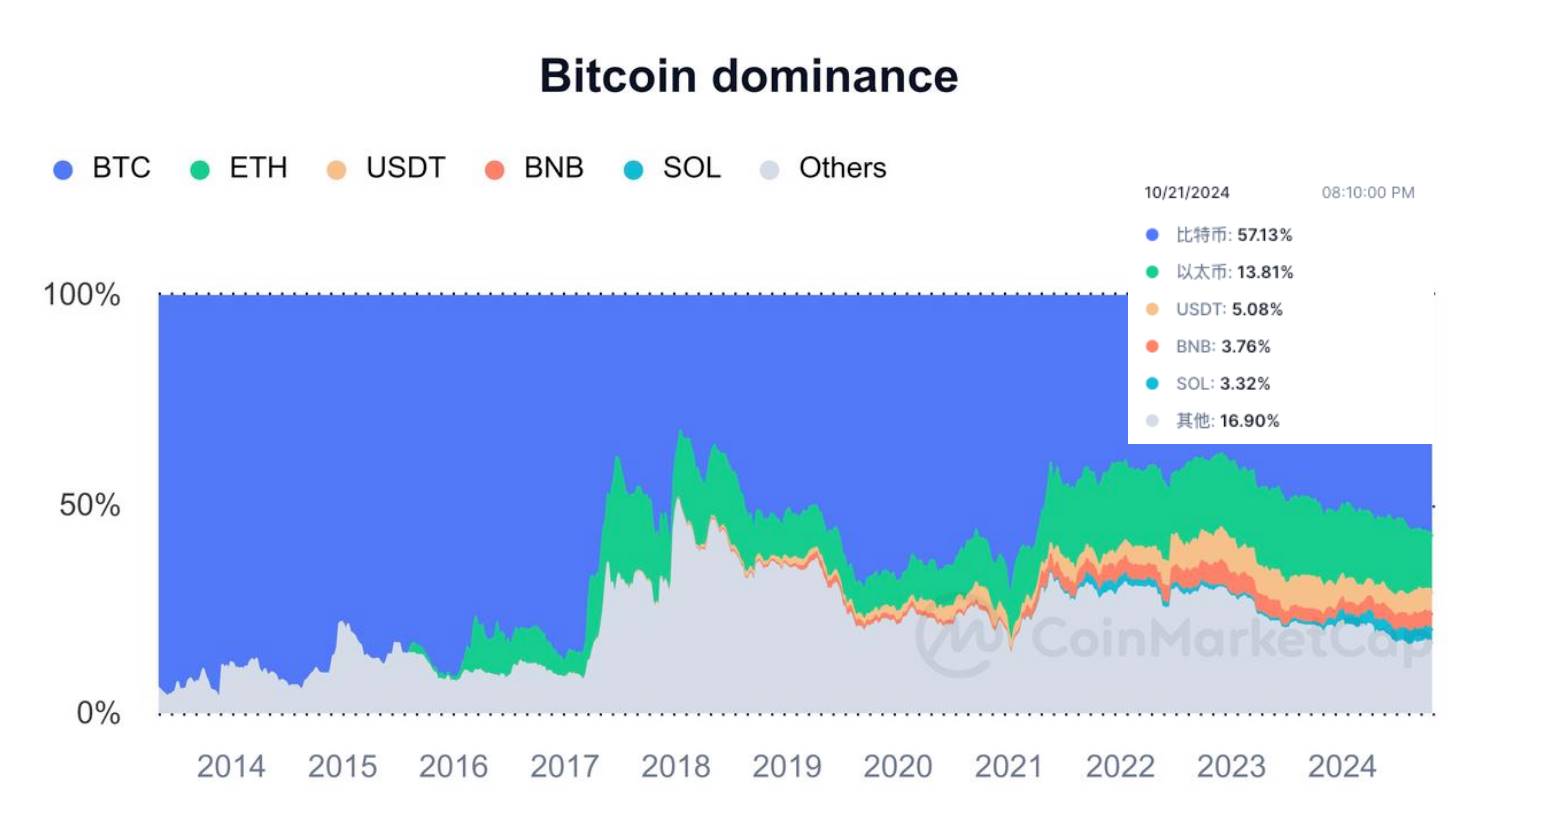
Historically, during the early stages of a bull cycle, Bitcoin dominance tends to rise. When the market enters the "Altcoin Season," Bitcoin's share typically declines. Moreover, when Bitcoin dominance reaches a peak, markets often enter a consolidation or correction phase. Theoretically, this reflects liquidity and investor sentiment reaching a tipping point—after significant capital inflows drive Bitcoin prices higher, profit-taking naturally follows.
Spot Bitcoin ETF Flows Become Key
Notably, the recent rise in Bitcoin dominance has been primarily driven by large-scale inflows into spot Bitcoin ETFs, especially from institutional investors. According to data shared by Ki Young Ju, CEO of CryptoQuant, institutional holdings in U.S. spot Bitcoin ETFs account for approximately 20%. Asset management firms currently hold around 193,000 Bitcoins. Thanks to spot ETFs, 1,179 institutions have joined Bitcoin investment this year.
Data shows that from October 14 to October 21, spot Bitcoin ETFs recorded seven consecutive days of net inflows. Notably, BlackRock’s ETF IBIT saw over $1.5 billion in net inflows, increasing its BTC holdings to 391,484 coins (worth approximately $26.45 billion). During this period, Bitcoin’s price rose from $62,300 to over $69,000.
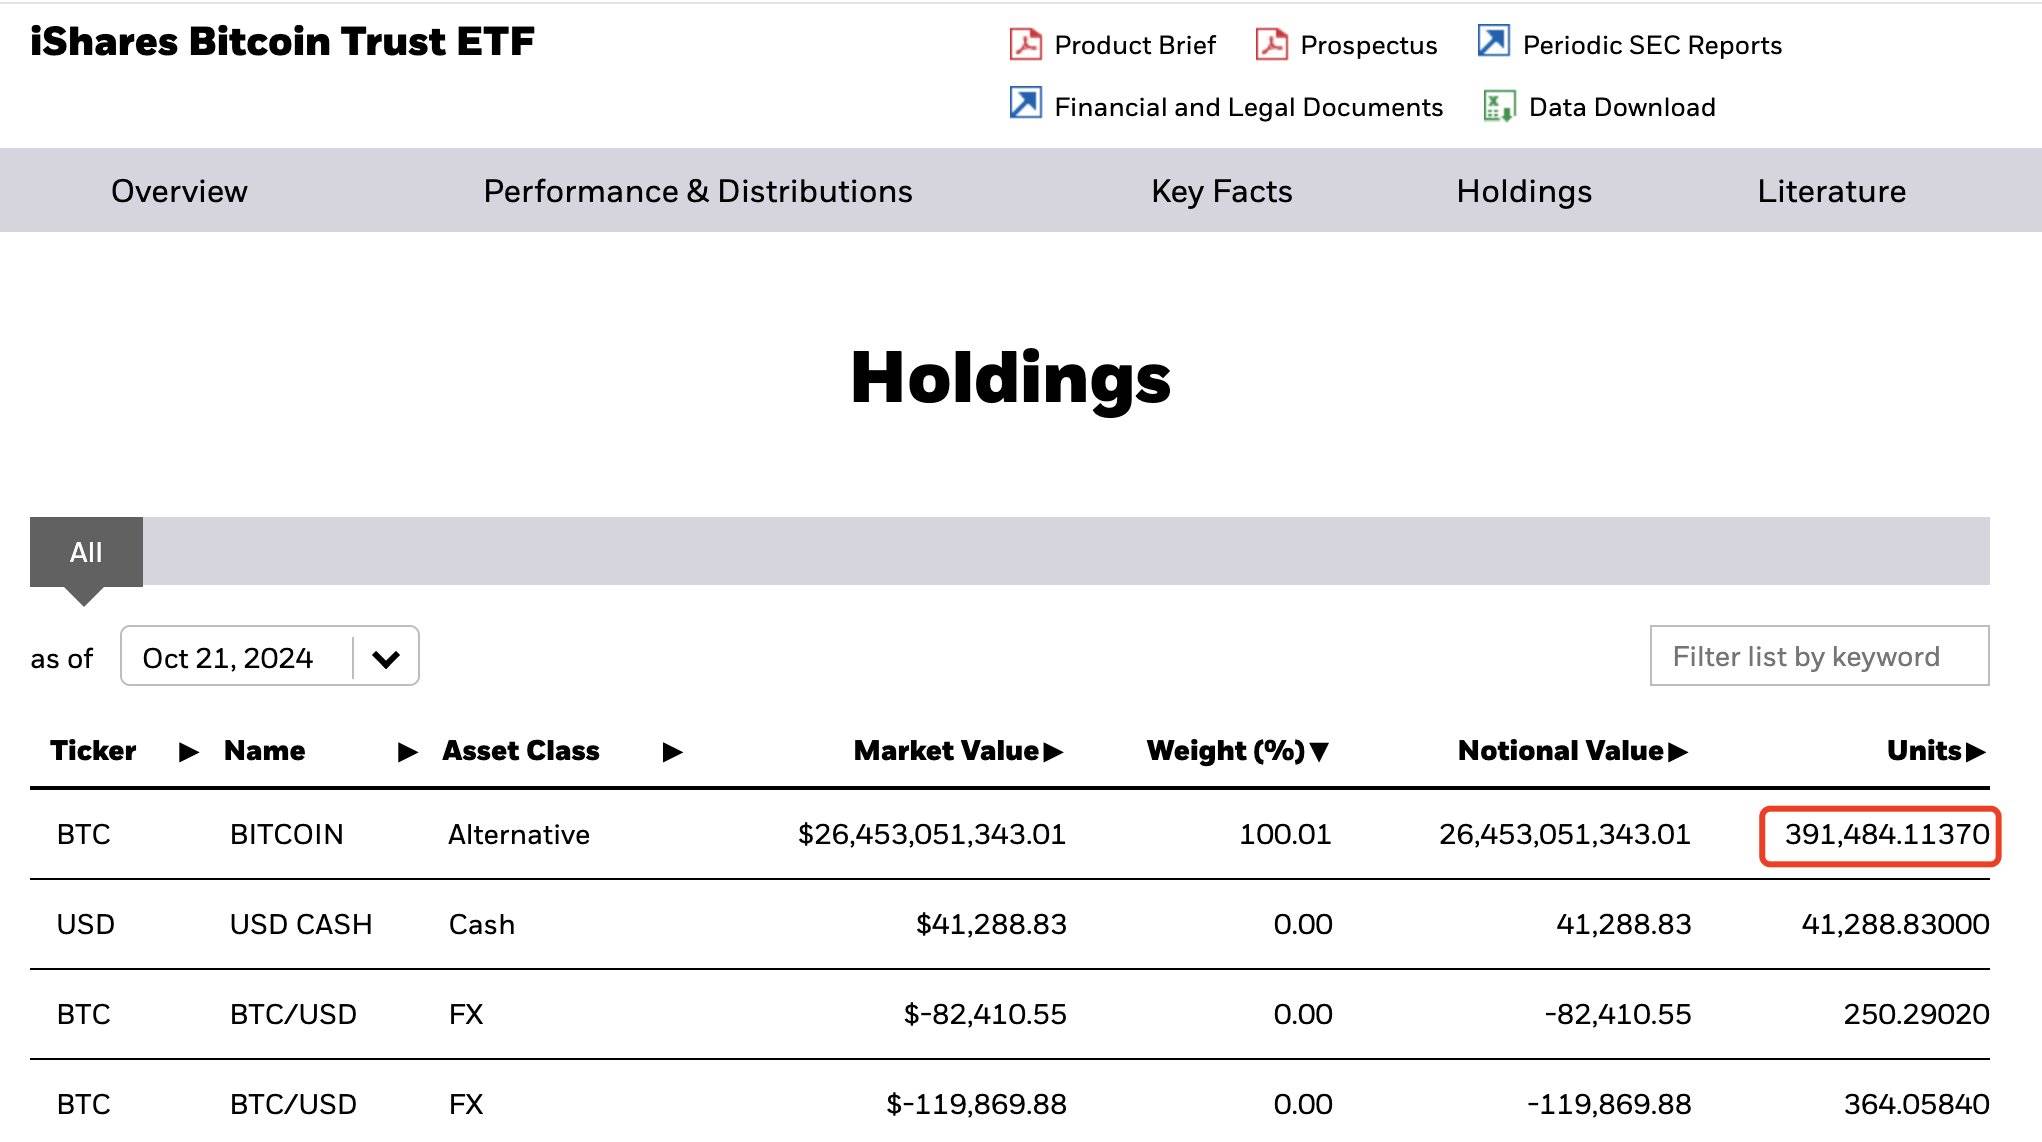
However, on October 22 (Eastern Time), after seven straight days of inflows, spot Bitcoin ETFs saw their first net outflow—totaling $79.09 million—and Bitcoin’s price began to stall and decline. This suggests the market failed to break through key technical support levels, reflecting weakening short-term investor confidence. As institutional capital slows or exits, price corrections follow. If Bitcoin fails to stage a strong recovery, further consolidation and volatility may ensue.
From another perspective, Bitcoin’s rally has drawn substantial liquidity—a phenomenon particularly evident in the current market phase. Amid ongoing price swings, Bitcoin has gradually absorbed liquidity from altcoins, creating a clear “blood-sucking” effect. While Bitcoin rises, other crypto assets often fail to follow, further skewing liquidity toward Bitcoin. If Bitcoin cannot overcome critical resistance, a short-term pullback may occur, pulling even more liquidity from altcoin markets and amplifying price volatility. Only when Bitcoin achieves a decisive breakout might excess liquidity spill over into altcoins, potentially triggering broader price surges.
USDT Market Cap Hits Record High, USDT.D Touches Support
Stablecoin market cap has increased its share largely at the expense of Ethereum. Excluding other altcoins, stablecoins’ share of the combined market cap of BTC, ETH, and stablecoins rose from 7% to 10% in 2024. According to DefiLlama, the total stablecoin market cap now stands at $172.78 billion—the highest since May 2022.
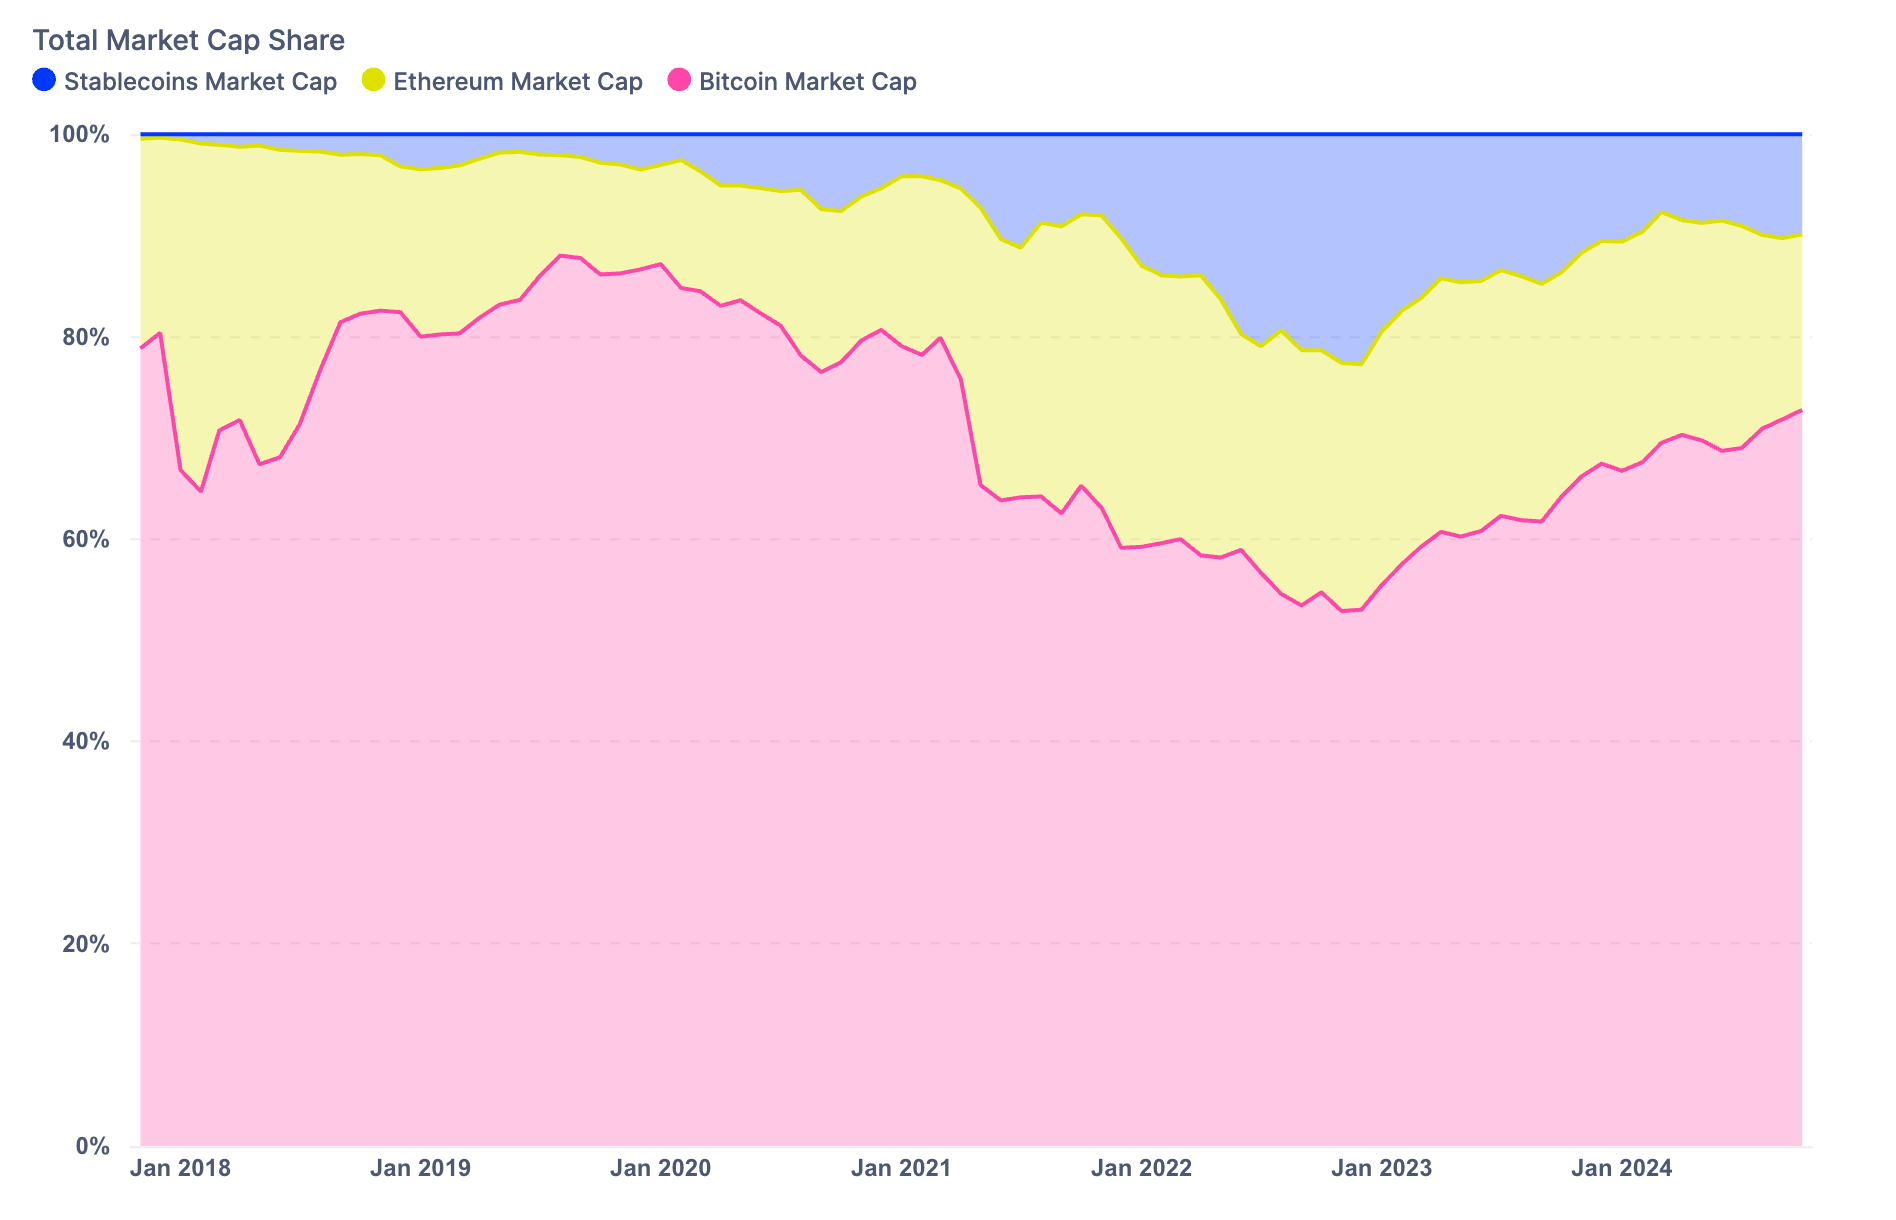
Among them, USDT’s market cap hit a record high of $120 billion, representing 69.49% of the total stablecoin market. This growth has been the main driver behind stablecoins capturing market share from Ethereum over the past six months.
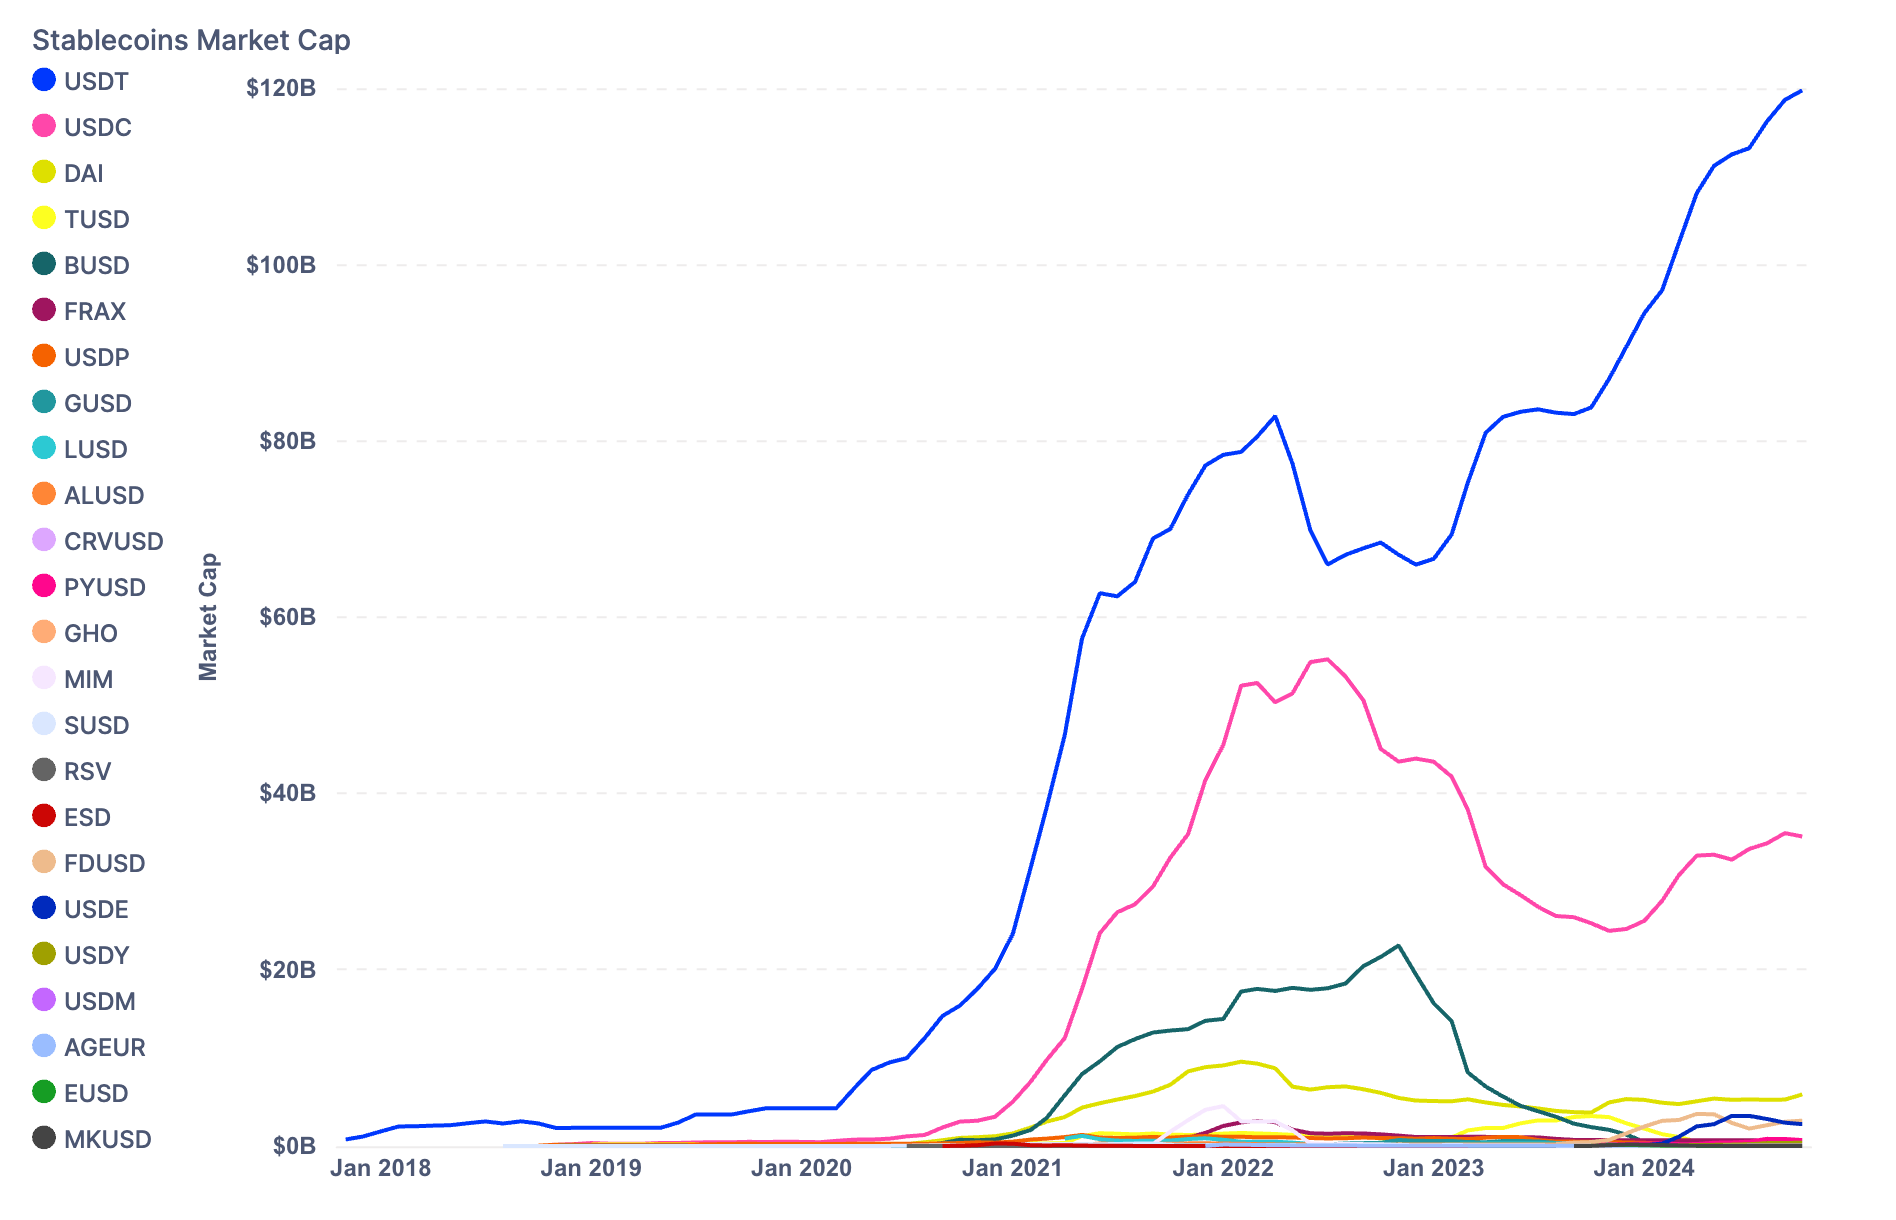
The collapse of Silicon Valley Bank (SVB) in March 2023 marked a turning point in the stablecoin competition, leading to a sharp decline in USDC’s market share and a corresponding increase in USDT supply. However, rising USDT Dominance Index (USDT.D) is not necessarily positive for the market. USDT.D serves as a reliable market sentiment indicator, effectively signaling potential tops and bottoms for Bitcoin across different cycles.
As shown in the chart below, during this year’s market movements, each time USDT.D approached or retested its long-term ascending support line, Bitcoin tended to reach a local price peak. This is because investors often shift funds into stablecoins like USDT during volatile periods to hedge risk. Thus, a rising USDT.D typically signals capital withdrawal from risky assets—indicating that Bitcoin may be nearing a short-term top.

Weakening Demand Side
From a medium-to-long-term perspective, both realized profits and losses in the Bitcoin market are showing a significant downward trend. After Bitcoin reached its all-time high of $73,000 in March 2024, the pace of new capital entering the market slowed considerably. According to data from Glassnode, daily capital inflows currently stand at around $730 million. While still substantial, this is markedly lower than the $2.97 billion peak seen in March.
This indicates a clear weakening in demand-side momentum. Although capital continues to enter the market, the volume is insufficient to sustain prolonged upward or downward price trends. Instead, prices become highly sensitive to relatively small capital shifts, resulting in sharp volatility. This lack of deep liquidity makes Bitcoin prone to wide price swings in the short term, while the market as a whole lacks directional clarity, reinforcing a wait-and-see stance among large investors.

Overall, Bitcoin is currently in a market environment characterized by high volatility and uncertainty. For the past six months, price action has resembled repeated vertical swings within a defined range. Without a major influx or outflow of capital, Bitcoin is unlikely to break out of this oscillating pattern.
This market behavior is closely tied to investor sentiment. Large players remain cautious, with many institutional investors waiting for clearer signals—such as greater clarity on macroeconomic policies, future adjustments in Federal Reserve monetary policy, or the outcome of the upcoming U.S. presidential election. At this stage, market sentiment is fragile, and any sudden macro developments could act as a catalyst for significant volatility.
Join TechFlow official community to stay tuned
Telegram:https://t.me/TechFlowDaily
X (Twitter):https://x.com/TechFlowPost
X (Twitter) EN:https://x.com/BlockFlow_News
 Foresight News