

What are the current developer trends in the crypto ecosystem?
2024.10.21
Share Share to X (Twitter) Navigating Web3 tides with focused insights
Share to WeChat
Share to WeiboShare to WeChat
Share by Link
Share by Image
TechFlow Selected TechFlow Selected
What are the current developer trends in the crypto ecosystem?
Ethereum remains the dominant ecosystem, but its core developer count has slightly declined due to competition from Layer 2 solutions and other L1s.
2024.10.21 - 13:01:39
开发者
Ethereum remains the dominant ecosystem, but its core developer count has slightly declined due to competition from Layer 2 solutions and other L1s.
Author: Luke Nolan
Translation: Baicai Blockchain
Ethereum remains the dominant ecosystem with the largest number of active developers, but its core contributor count has slightly declined due to increased participation in Layer 2 solutions and competition from other L1s. The Layer 2 ecosystem is experiencing significant growth, particularly following the Dencun upgrade, with Base leading in both developer contributions and transaction activity. Base is showing signs of becoming the leading Layer 2 platform in the future. Categories seeing the largest growth in contributors are wallets and trading platforms. Pure derivatives platforms have seen the sharpest decline in contributor numbers. The value of a blockchain or its underlying token stems from various variables and perspectives. It could be speculative capital investing in an idea—whether it's a technological advantage over existing competitors, a new application or service seemingly capable of attracting hundreds of thousands of users in the future, or a protocol that has achieved product-market fit and generates real cash flows as a yield-generating asset. Clearly, there is no one-size-fits-all approach. In equities, relative valuation or objective discounted cash flow models may work well, but in the world of crypto tokens, it's difficult to find a method that helps evaluate any specific token or protocol. When we consider developer activity, we view it as both a lagging and a leading indicator. Blockchains or protocols that outperform their peers tend to attract top-tier development talent, while blockchains that start with many developers working on them typically perform better than peers lacking similar network effects. The data discussed in this article largely supports this view. Therefore, although it's important to broadly assess the value of token-based protocols, this article will focus specifically on how developer activity has evolved over time, including areas with the largest recent growth and ecosystems where developer activity has declined the most. We will also pay special attention to the top five ecosystems by market cap, as well as changes in Ethereum’s Layer 2 developer ecosystem since the Dencun upgrade in March. Data scraping is an ongoing process and regularly improves, so we aim to keep updates frequent to track developments.1. Methodology
Electric Capital has done excellent work in tracking crypto developer statistics. Not only do they maintain an open-source GitHub taxonomy (which we use), but they also publish a comprehensive report every few months detailing how they collect and classify data—an approach that distinguishes this analysis from future studies. Since the taxonomy is continuously updated—with new ecosystems and sub-ecosystems added—it creates a dynamic dataset where past figures can change. For example, a repository created last year and later added to the Base ecosystem would alter historical numbers. While having a "living" dataset is highly valuable, this article deliberately treats it as a static snapshot to provide a controlled baseline for future iterations. We are still exploring how best to implement and present separate dynamic progress tracking. With that clarified, our methodology for this analysis can be described as follows: - Scrape all ecosystems based on the aforementioned taxonomy - Freeze the data to ignore repositories newly added in future crawls - Collect total commit counts and the number of unique developers per repository across each ecosystem and sub-ecosystem - Only include ecosystems with at least 50 active developers in the past 30 days - A developer is defined as someone who has made at least 10 contributions within the past 3 months - This reduces the so-called “crypto tourist effect,” where people briefly participate due to airdrops or other short-term incentives - Although this results in lower absolute numbers, it more reasonably reflects the trend of individuals making substantial contributions to ecosystems This methodology has undergone multiple iterations. While we don’t consider it perfect, it produces highly interesting results, and we will continue refining it as necessary.2. Ecosystem Overview
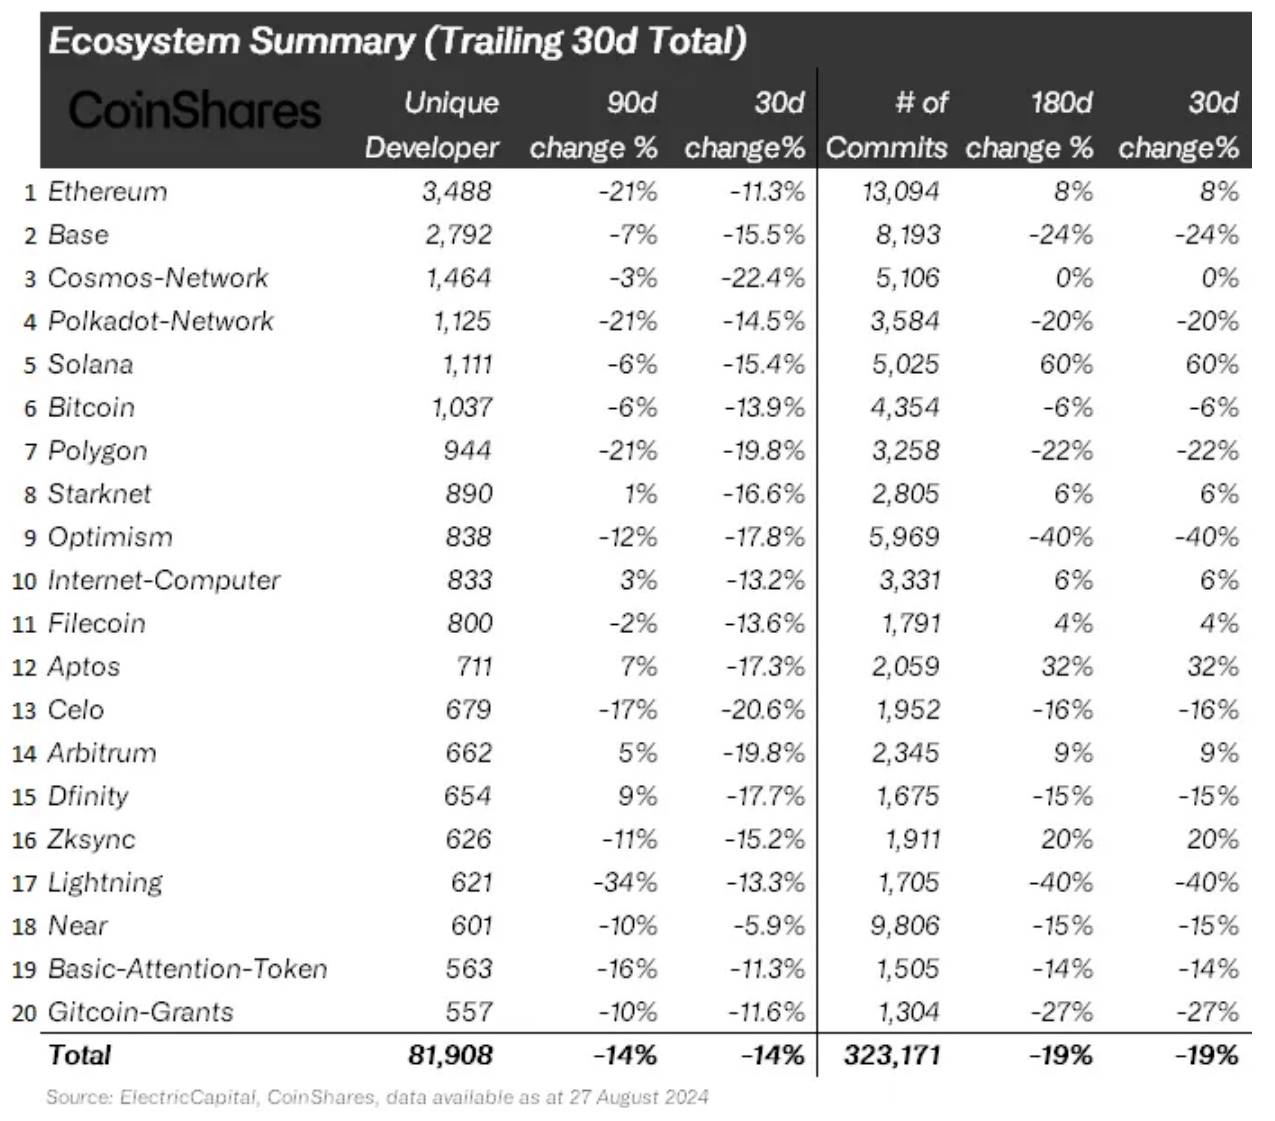
 Above, we see an overview of ecosystems, showing the top ecosystems with the highest number of unique developers over the past 30 days. Unsurprisingly, Ethereum leads with approximately 3,500 unique developers. In fact, most of the ecosystems on this list are those expected to rank near the top.
Given that the Cosmos network is essentially a “blockchain of blockchains,” it makes sense that many developers are working within this ecosystem, given its numerous sub-repositories. Notably, six Ethereum Layer 2s appear in the top 20, with their rising activity closely tied to the surge following the Dencun upgrade, which will be analyzed in greater detail later.
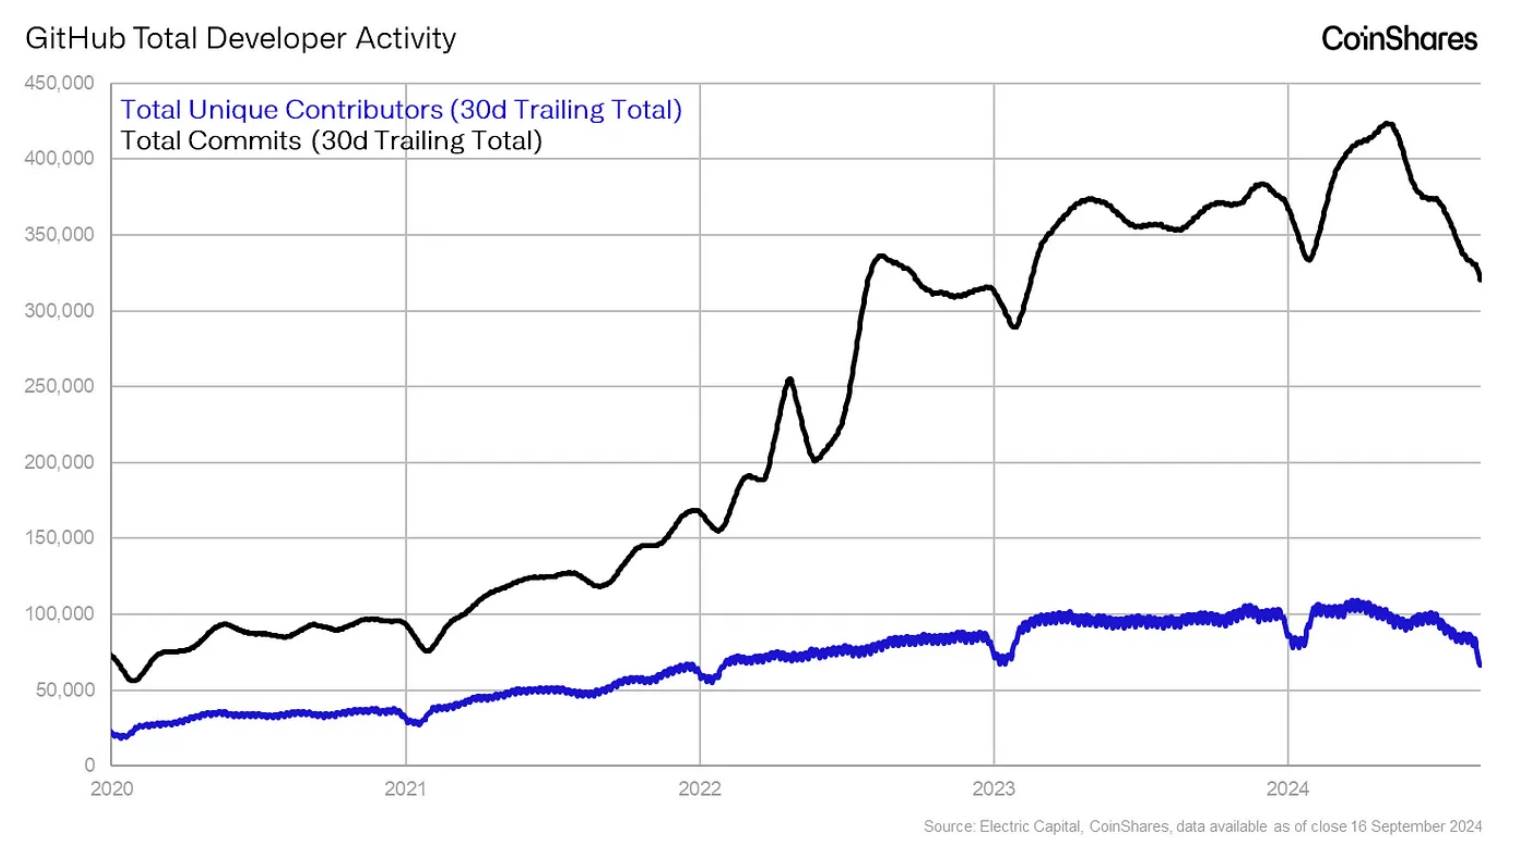
The chart below the table shows total commits and total unique developers over the past 30 days. Of course, it should be noted that these totals only include ecosystems meeting the criteria outlined in the methodology section. While total commits show a clear long-term upward trend, the number of developers has stagnated or declined since early 2023, suggesting few new developers are entering the crypto space and consistently contributing to ecosystems.
Above, we see an overview of ecosystems, showing the top ecosystems with the highest number of unique developers over the past 30 days. Unsurprisingly, Ethereum leads with approximately 3,500 unique developers. In fact, most of the ecosystems on this list are those expected to rank near the top.
Given that the Cosmos network is essentially a “blockchain of blockchains,” it makes sense that many developers are working within this ecosystem, given its numerous sub-repositories. Notably, six Ethereum Layer 2s appear in the top 20, with their rising activity closely tied to the surge following the Dencun upgrade, which will be analyzed in greater detail later.
The chart below the table shows total commits and total unique developers over the past 30 days. Of course, it should be noted that these totals only include ecosystems meeting the criteria outlined in the methodology section. While total commits show a clear long-term upward trend, the number of developers has stagnated or declined since early 2023, suggesting few new developers are entering the crypto space and consistently contributing to ecosystems.
3. Fastest-Growing Ecosystems
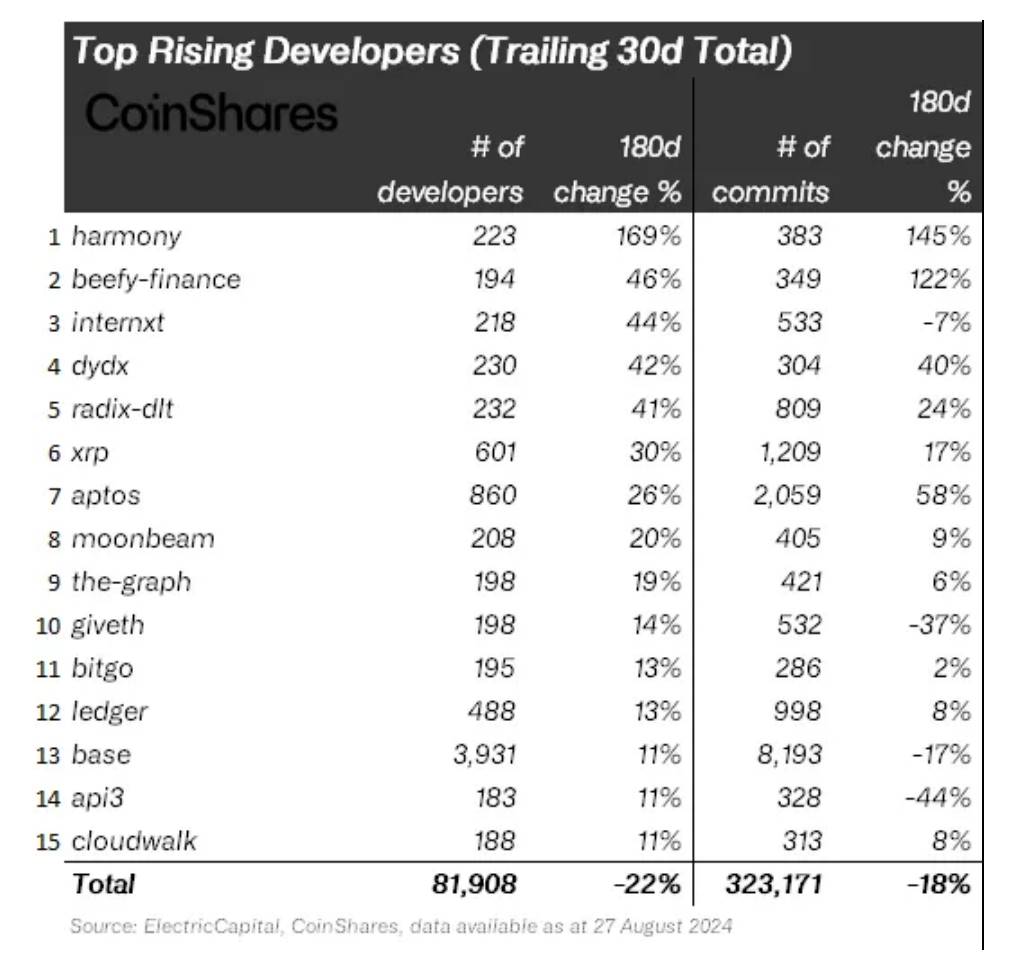
 Fastest-growing ecosystems are typically those starting small and gaining momentum, often driven by new product development or being part of a larger ecosystem undergoing major network upgrades (e.g., Base’s growth following Ethereum’s Dencun upgrade in March).
Notable fast-growing projects include dYdX (a popular decentralized derivatives trading platform), Aptos (which drew significant attention earlier this year due to a notable price surge), and popular ecosystems such as XRP and Ledger (hardware wallet).
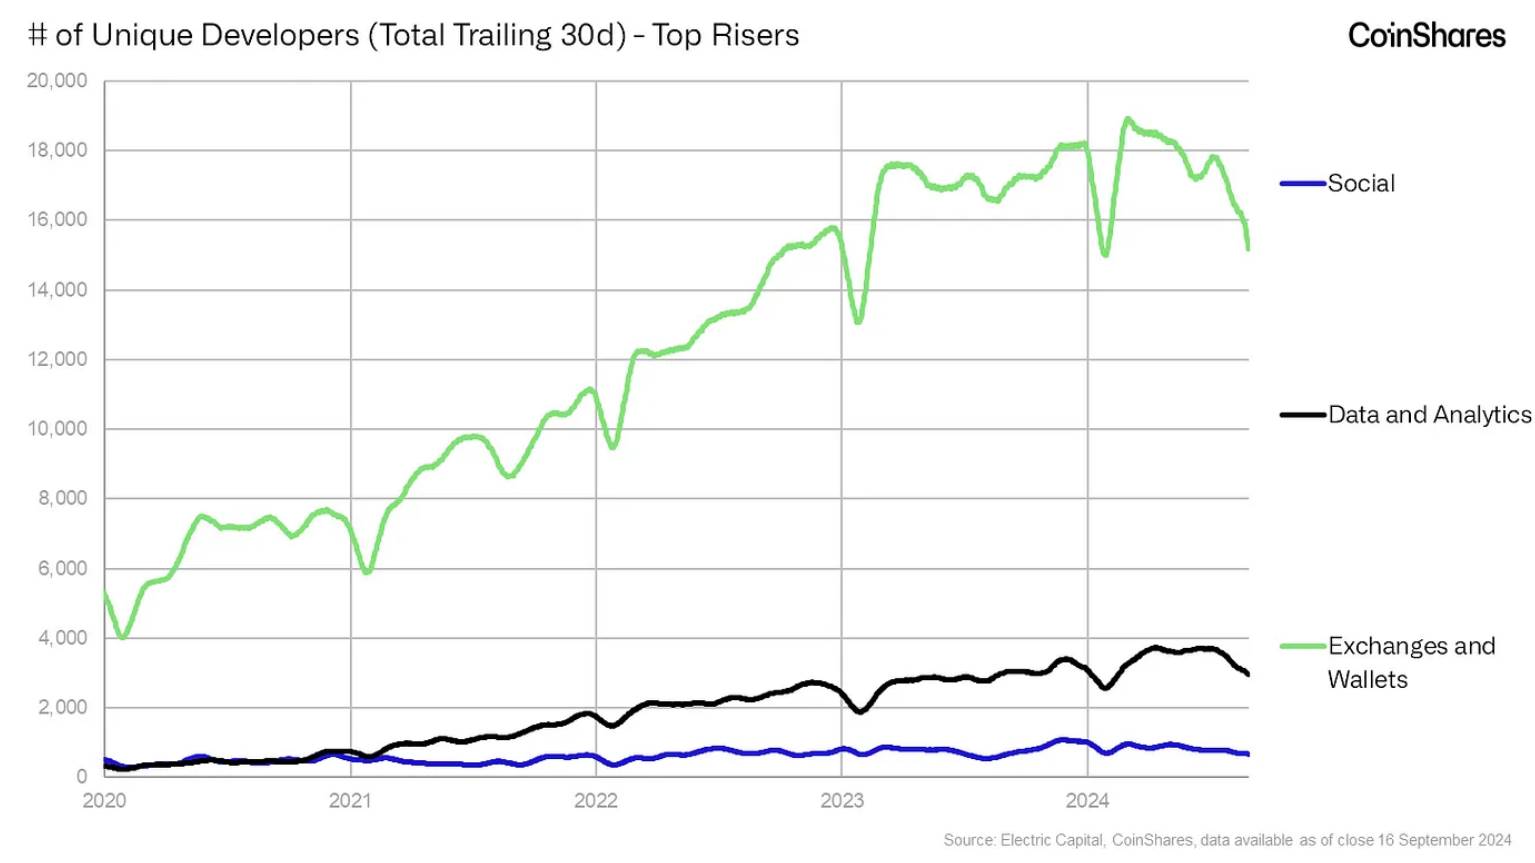
In terms of categories with the largest growth in contributors, trading platforms and wallets lead the pack. The rise of multiple trading platforms on Solana, along with intense competition in the Ethereum space, has driven developer activity aimed at capturing capital and market share from increasingly fee-sensitive users, while chasing volume-based token incentives (such as Hyperliquid and Jupiter).
Fastest-growing ecosystems are typically those starting small and gaining momentum, often driven by new product development or being part of a larger ecosystem undergoing major network upgrades (e.g., Base’s growth following Ethereum’s Dencun upgrade in March).
Notable fast-growing projects include dYdX (a popular decentralized derivatives trading platform), Aptos (which drew significant attention earlier this year due to a notable price surge), and popular ecosystems such as XRP and Ledger (hardware wallet).
In terms of categories with the largest growth in contributors, trading platforms and wallets lead the pack. The rise of multiple trading platforms on Solana, along with intense competition in the Ethereum space, has driven developer activity aimed at capturing capital and market share from increasingly fee-sensitive users, while chasing volume-based token incentives (such as Hyperliquid and Jupiter).
4. Fastest-Declining Ecosystems
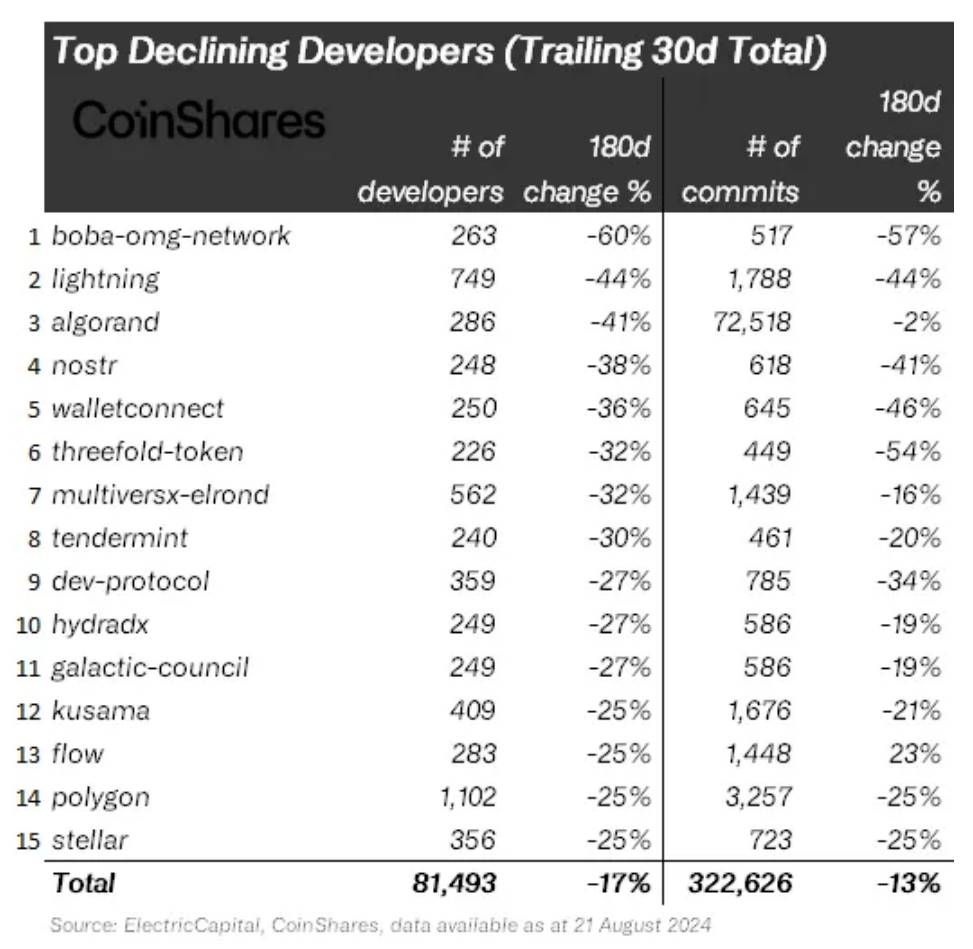
 When examining fastest-declining ecosystems, if we disregard less-known ones and focus on familiar names, some interesting patterns emerge. First, Lightning’s decline stands out amid fierce competition from emerging Bitcoin Layer 2 solutions. Despite being a rigorously tested protocol, Lightning has failed to generate sustained interest over time, giving way to renewed user attention toward protocols like Stacks, Babylon, and CoreDAO after potential yield opportunities emerged on Bitcoin.
Interestingly, contributor numbers for the decentralized social network Nostr have also declined, possibly linked to the rise of Farcaster (~50k daily active users). Declines in Algorand, Polygon, and Tendermint are also notable.
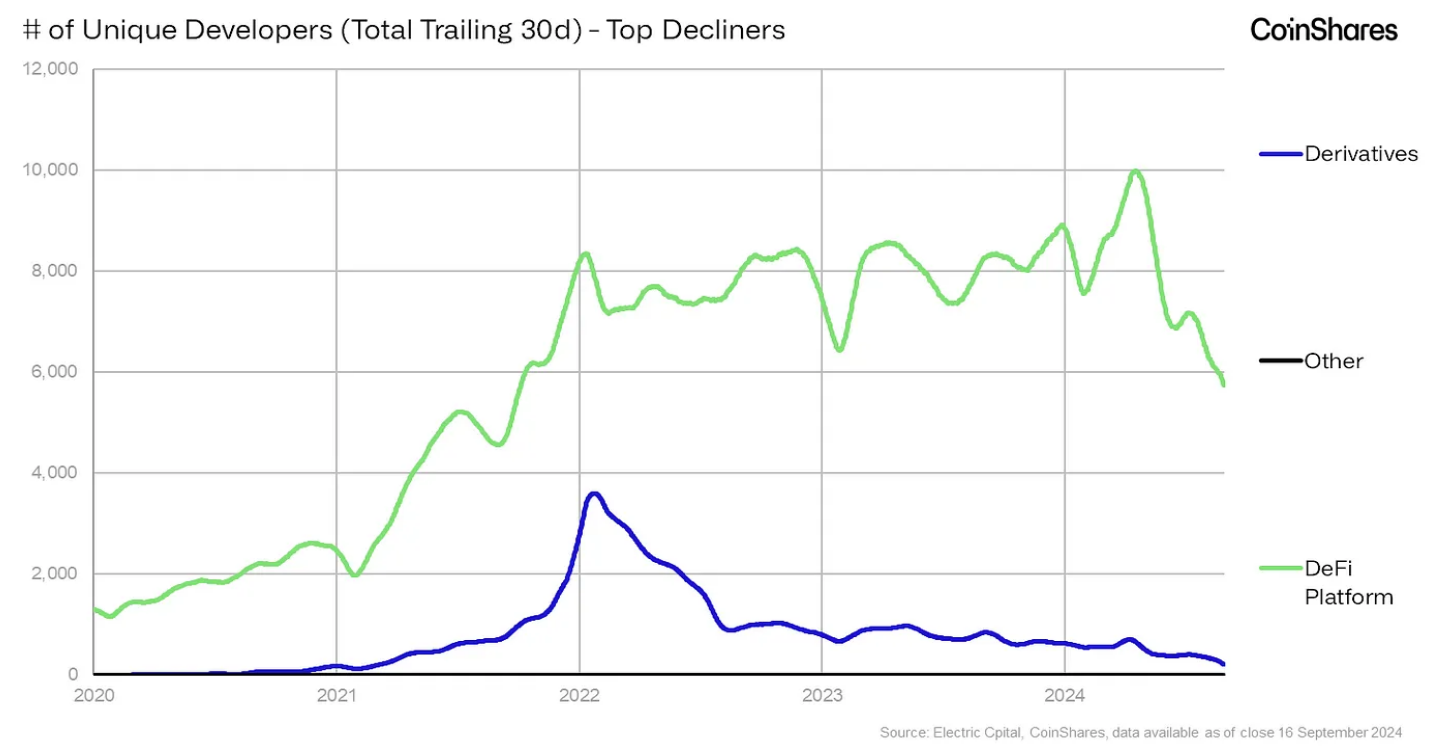
Among declining categories, DeFi platforms saw a clear reduction in contributors, as did derivatives platforms. The latter may reflect limitations in our classification method, as only pure derivatives platforms are included; platforms offering spot trading are categorized under “trading platforms and wallets,” a category previously noted as one of the fastest-growing.
When examining fastest-declining ecosystems, if we disregard less-known ones and focus on familiar names, some interesting patterns emerge. First, Lightning’s decline stands out amid fierce competition from emerging Bitcoin Layer 2 solutions. Despite being a rigorously tested protocol, Lightning has failed to generate sustained interest over time, giving way to renewed user attention toward protocols like Stacks, Babylon, and CoreDAO after potential yield opportunities emerged on Bitcoin.
Interestingly, contributor numbers for the decentralized social network Nostr have also declined, possibly linked to the rise of Farcaster (~50k daily active users). Declines in Algorand, Polygon, and Tendermint are also notable.
Among declining categories, DeFi platforms saw a clear reduction in contributors, as did derivatives platforms. The latter may reflect limitations in our classification method, as only pure derivatives platforms are included; platforms offering spot trading are categorized under “trading platforms and wallets,” a category previously noted as one of the fastest-growing.
5. Top Five by Market Cap
 Among the largest ecosystems by market cap, Ethereum’s leadership isn’t surprising, given its historically most active development environment and role as the birthplace of DeFi. Solana’s rise is clearly visible in the chart, contrasting sharply with the stagnation or decline seen in other ecosystems over the past few years. Interestingly, seasonal patterns exist across all developer statistics—activity typically drops significantly at year-end, likely due to holidays and breaks.
Within the top five, Ethereum and BNB Smart Chain show the most noticeable declines in activity. For BNB, this is somewhat understandable given CZ’s arrest and broader indicators pointing to waning network enthusiasm. For Ethereum, despite reaching nearly 5,000 core contributors at its peak, competition from other L1s and the rise of Ethereum Layer 2s have led to a sharp drop in core contributors.
Among the largest ecosystems by market cap, Ethereum’s leadership isn’t surprising, given its historically most active development environment and role as the birthplace of DeFi. Solana’s rise is clearly visible in the chart, contrasting sharply with the stagnation or decline seen in other ecosystems over the past few years. Interestingly, seasonal patterns exist across all developer statistics—activity typically drops significantly at year-end, likely due to holidays and breaks.
Within the top five, Ethereum and BNB Smart Chain show the most noticeable declines in activity. For BNB, this is somewhat understandable given CZ’s arrest and broader indicators pointing to waning network enthusiasm. For Ethereum, despite reaching nearly 5,000 core contributors at its peak, competition from other L1s and the rise of Ethereum Layer 2s have led to a sharp drop in core contributors.
6. Ethereum Layer 2
The Dencun upgrade on March 13 pushed Layer 2 activity to new highs. With fees typically below one cent, users who previously left Ethereum Layer 1 due to high costs are returning via Layer 2s. The following year-over-year metrics clearly illustrate this: - All Layer 2 TPS (transactions per second): 45 → 340 - All Layer 2 daily transactions: 3.4M → 15.2M - All Layer 2 daily active addresses: 780K → 1.82M It is widely believed that the average crypto user is extremely fee-sensitive. During the 2021 frenzy, users paid over $200² for a single token swap, while many others conducting low-value transactions migrated en masse to alternative chains.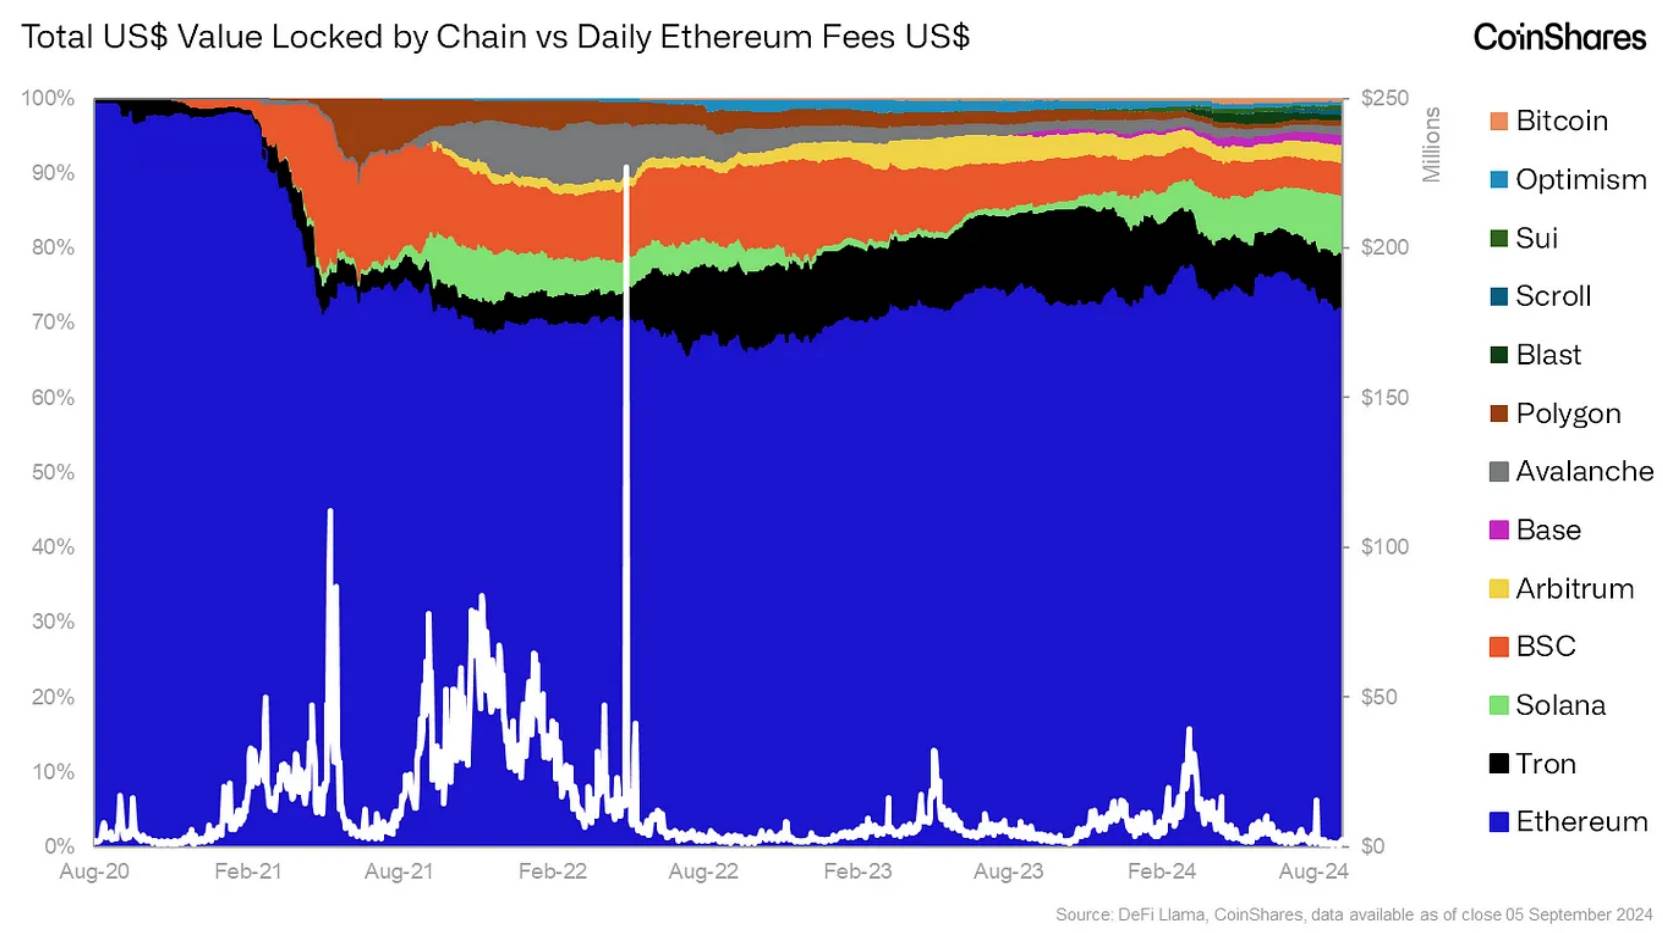 We expect high-value users, benefiting from stronger security, to remain on Layer 1 post-Dencun, while fee-sensitive users will at least partially return—but this time through available Layer 2 options.
Take Uniswap as an example. Examining usage metrics split by chain reveals supporting evidence:
We expect high-value users, benefiting from stronger security, to remain on Layer 1 post-Dencun, while fee-sensitive users will at least partially return—but this time through available Layer 2 options.
Take Uniswap as an example. Examining usage metrics split by chain reveals supporting evidence:
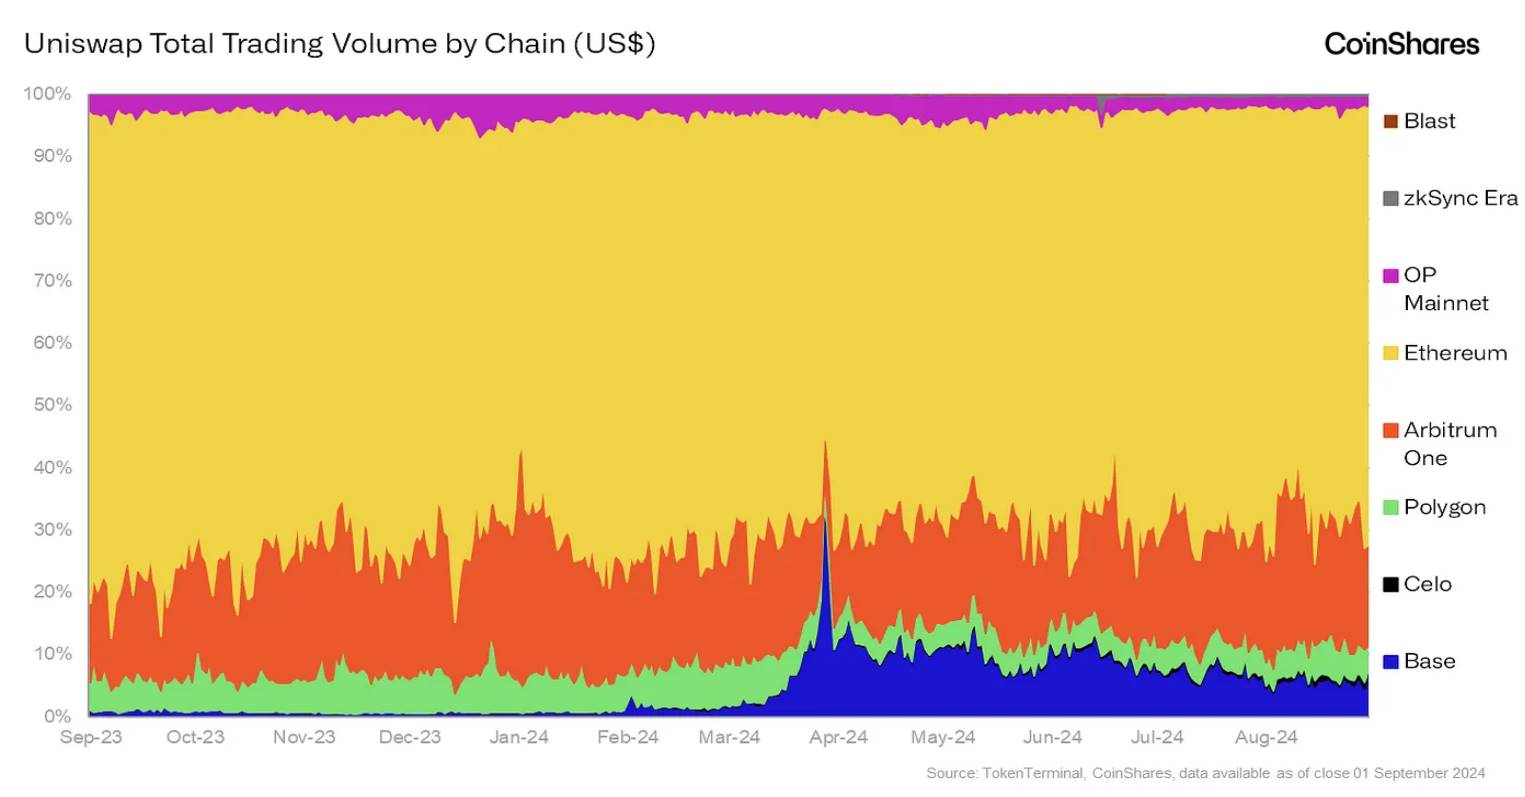
 After the Dencun upgrade, the number of addresses using Uniswap on Layer 2—especially Base—increased significantly. In fact, Base captured about 83% of the monthly active address market share. However, it must be emphasized that these are likely more fee-sensitive users conducting relatively low nominal-value trades (additionally, many of these addresses may hold balances below $10—the cost of clearing a wallet in good faith is extremely low compared to L1 Ethereum). The following chart precisely illustrates this phenomenon:
 As shown, Ethereum still dominates Uniswap’s transaction volume market share, even though its share of monthly active addresses per chain is only around 10%. This suggests that high-balance “whales” remain on Layer 1 because they are insensitive to fees. If you’re trading hundreds of thousands or even millions of dollars, even a spike in gas prices making a transaction cost hundreds of dollars represents only a tiny fraction of your position size.
Now looking at overall Layer 2 developer market share by protocol, we see that Base has firmly established itself as the leading ecosystem for contributors:
As shown, Ethereum still dominates Uniswap’s transaction volume market share, even though its share of monthly active addresses per chain is only around 10%. This suggests that high-balance “whales” remain on Layer 1 because they are insensitive to fees. If you’re trading hundreds of thousands or even millions of dollars, even a spike in gas prices making a transaction cost hundreds of dollars represents only a tiny fraction of your position size.
Now looking at overall Layer 2 developer market share by protocol, we see that Base has firmly established itself as the leading ecosystem for contributors:
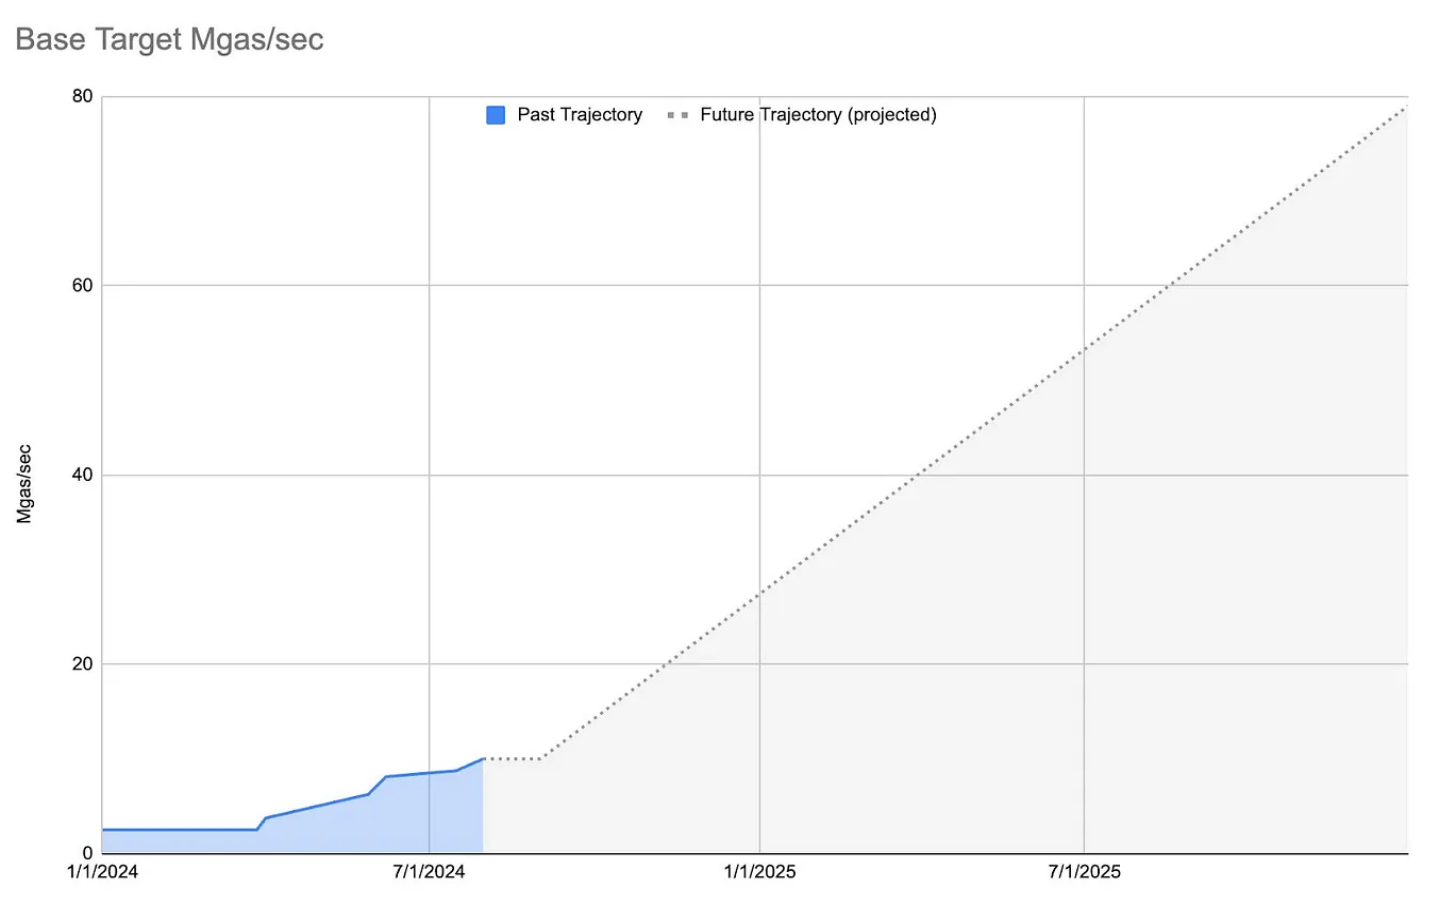
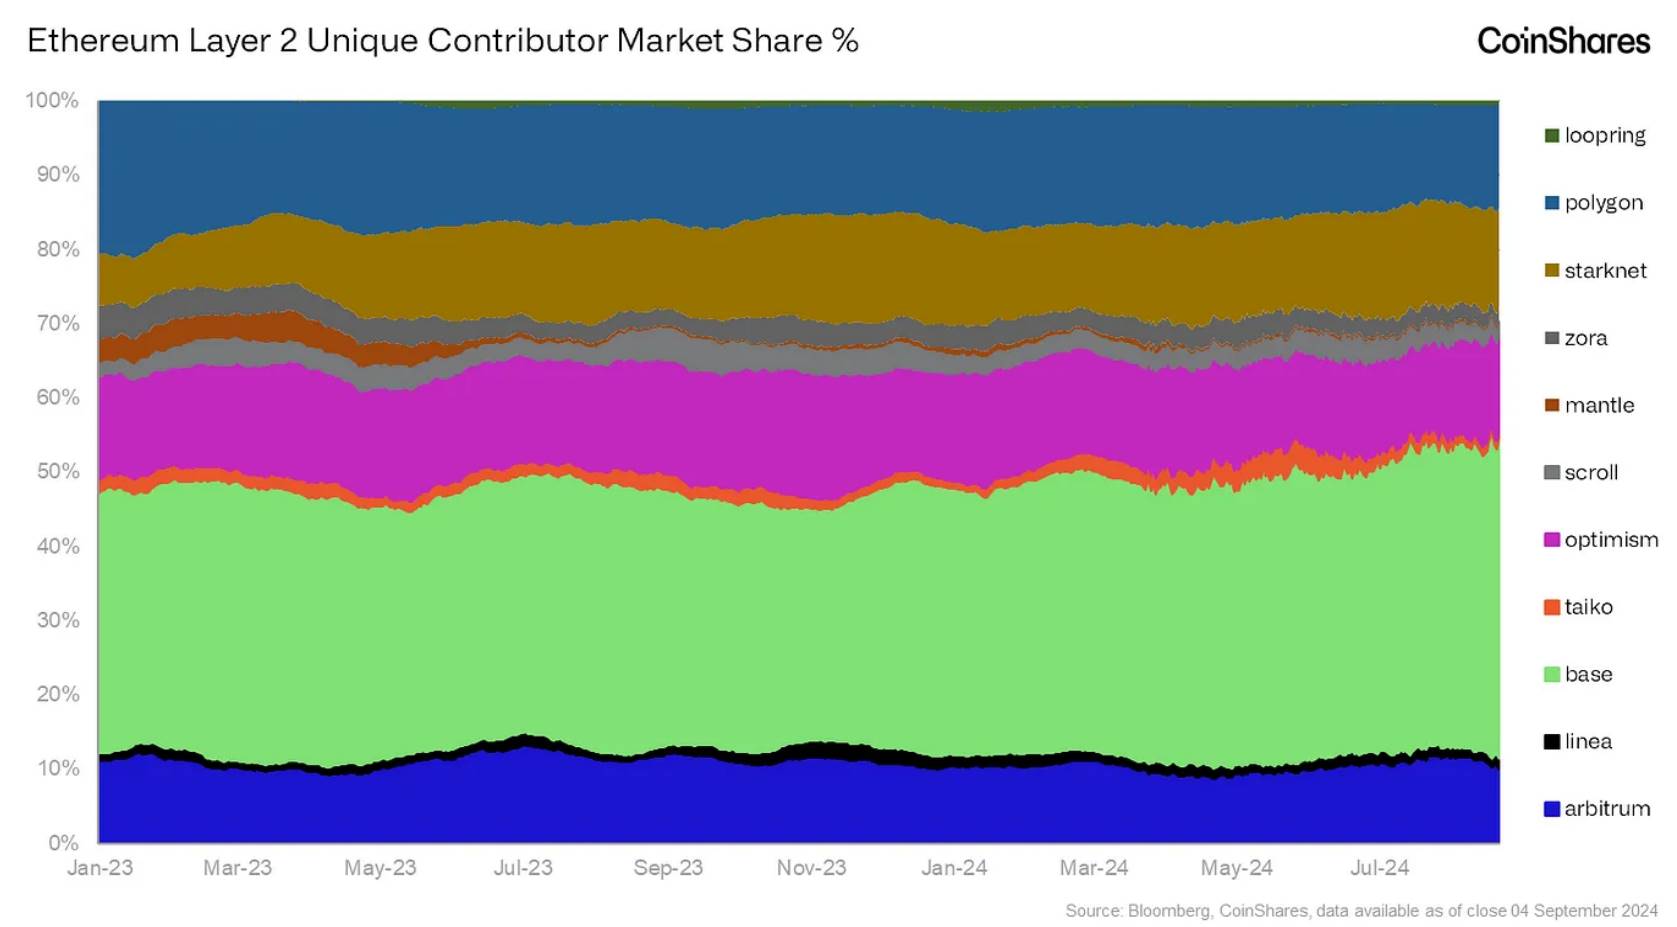 Currently, Base has the highest TPS among all major Layer 2 solutions at 46, compared to Arbitrum’s 16³. Moreover, Base has a clear roadmap for continuous network upgrades, targeting 80 Mgas/sec by the end of 2025. These ambitious plans could continue attracting developers to build consumer applications and infrastructure on the network.
 Given Coinbase’s backing of Base, we expect it to remain the Layer 2 solution with the most developers and, over time, become the ecosystem with the largest TVL and stablecoin supply (although this may take considerable time given Arbitrum’s current lead).
7. Conclusion
Overall, we’ve analyzed where developer attention lies and how it has shifted over time. Specifically, we examined ecosystems and categories with the largest increases and decreases in developer activity over the past year, delving deeper into the top five ecosystems by market cap and the Ethereum Layer 2 landscape. Using developer statistics to observe ecosystems is not about predicting the future value of a token or protocol, but rather assessing where potential value is being built—concentrations of human capital are more likely to produce sophisticated DeFi platforms, consumer applications, or revenue-generating enterprises. Overall, monitoring developer dynamics and activity provides valuable insights into where innovation is likely to emerge. Understanding long-term trends—including ecosystems once popular with developers that are now fading and those regaining attention—is equally important. As previously noted, the methodology used in this analysis will be regularly reviewed and refined to strike the right balance between accuracy and insight over time. In the future, we will also focus on analyzing ecosystems with native base tokens to better assess comparative relative valuations.Join TechFlow official community to stay tuned
Telegram:https://t.me/TechFlowDaily
X (Twitter):https://x.com/TechFlowPost
X (Twitter) EN:https://x.com/BlockFlow_News
Add to Favorites
Share to Social Media


