Under broad and volatile fluctuations, Bitcoin's current status from a macro-cycle data perspective
TechFlow Selected TechFlow Selected
Under broad and volatile fluctuations, Bitcoin's current status from a macro-cycle data perspective
Five key indicators to see how far the bull market has progressed.
 Navigating Web3 tides with focused insights
Author: Chandler, Foresight News
In 2024, the crypto asset market experienced extreme volatility, particularly with Bitcoin’s price oscillating persistently between $50,000 and $70,000 for several months. This fluctuation has been both frequent and unpredictable—neither exhibiting traditional trending behavior nor following typical bull or bear market cycles—forcing us to reevaluate the market's internal logic and operational mechanisms.
A defining feature of the current market is the clear divergence in investor strategies. Long-term holders and short-term traders have adopted markedly different approaches amid this heightened volatility. Long-term holders typically maintain stable positions during turbulent periods to weather uncertainty, while short-term traders actively exploit volatility through frequent trading to capture quick profits. Particularly noteworthy are institutional investors, especially those investing via spot Bitcoin ETFs, whose strategies have become increasingly complex. These institutions must reassess their portfolio allocations across various spot Bitcoin ETFs, including shifting holdings from Grayscale’s high-fee Bitcoin Trust (GBTC) to lower-cost alternatives. At the same time, they must carefully evaluate potential risks to ensure their investment strategies remain aligned with evolving market dynamics.
Against this backdrop, on-chain metrics have emerged as essential tools for understanding the current market landscape. By analyzing on-chain data, we can detect subtle shifts in market sentiment, track changes in investor behavior, and identify underlying trends. When combined with historical on-chain indicators from previous bull markets, these insights help paint a comprehensive picture of today’s Bitcoin market and provide a scientific basis for forecasting future movements.
Bitcoin MVRV Z-Score: Still Less Than Half of Previous Bull Market Peaks
MVRV (Market Value to Realized Value) is a key metric in Bitcoin and broader cryptocurrency markets used to assess market sentiment and price trends. It compares Market Value (MV)—the current market cap calculated by multiplying Bitcoin’s price by its circulating supply—with Realized Value (RV), which sums up the value of all Bitcoins based on their last movement price. Realized Value filters out short-term speculative noise by reflecting the actual acquisition cost of existing holdings.
The MVRV Z-Score applies standard deviation analysis to highlight extreme divergences between market value and realized value. Represented by an orange line, it effectively identifies periods when market value significantly exceeds realized value. A Z-Score entering the pink zone typically signals a market top, whereas values in the green zone suggest Bitcoin is substantially undervalued.
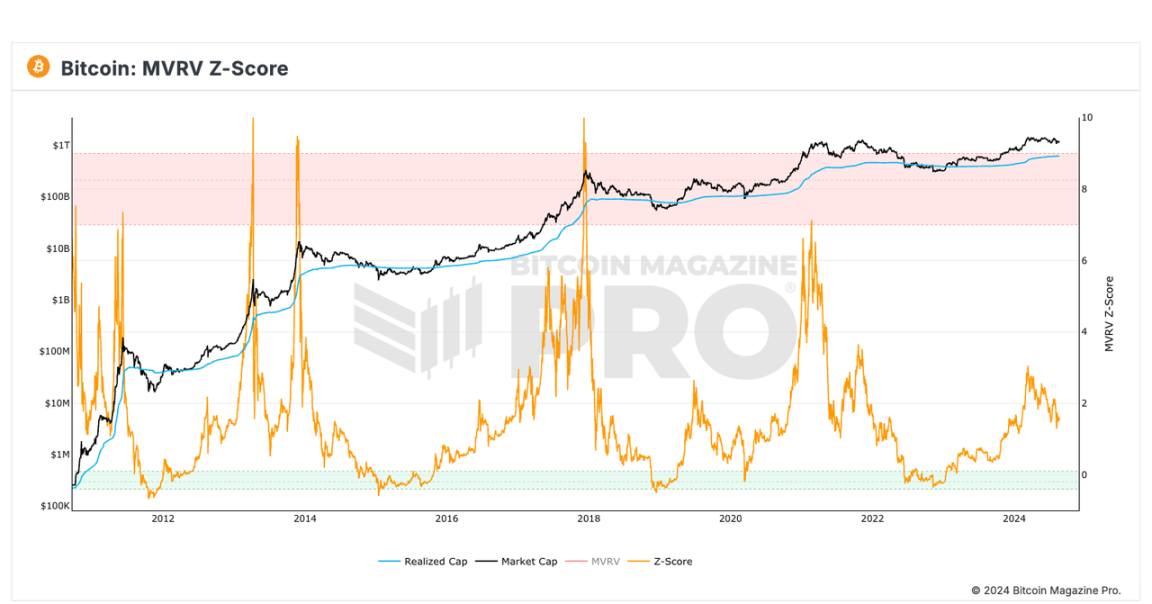
Historical data shows that extreme highs or lows in the MVRV Z-Score often coincide with market turning points. For instance, the peaks of the 2017 bull run and the troughs of the 2018 and 2022 bear markets correspond clearly with extreme Z-Score values. While the 2021 bull market peak did not reach prior highs, it briefly entered the pink "market top" zone. In contrast, despite Bitcoin surpassing its previous all-time high in 2024, the MVRV Z-Score remains below half of historical peak levels.
Puell Multiple: Current Peak Only Reached 2.4
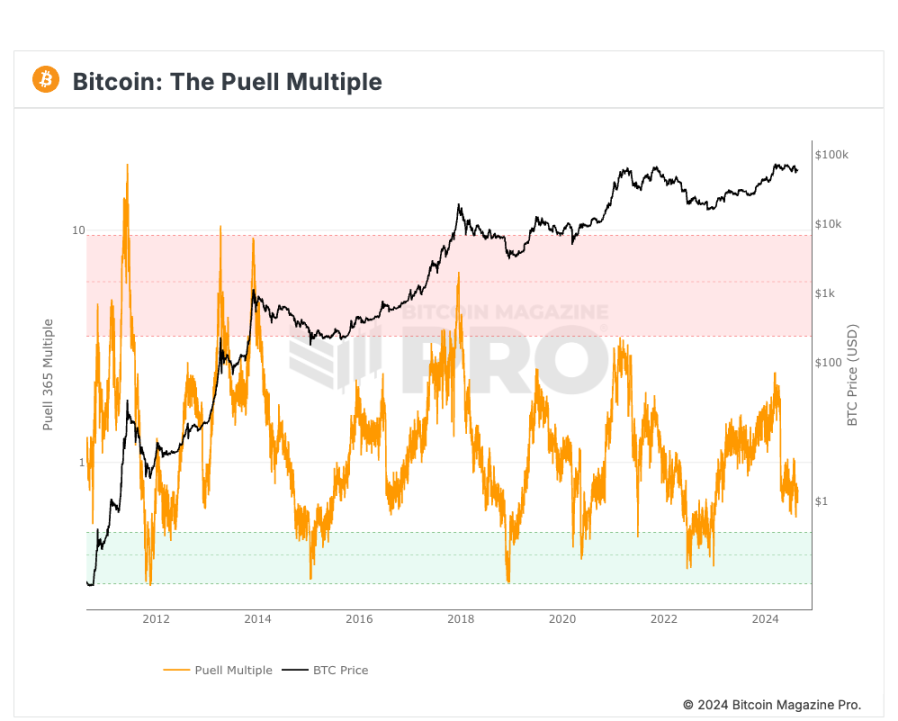
The Puell Multiple is another cyclical indicator closely correlated with market tops. It measures the ratio of current miner revenue to the 365-day moving average of miner revenue. Miner revenue primarily consists of the market value of newly issued Bitcoin (which miners receive as block rewards) plus transaction fees. The formula is: Puell Multiple = Daily Miner Revenue / 365-Day Moving Average of Miner Revenue.
This metric serves as a valuable reference for determining whether Bitcoin’s price has deviated from fair value. Since selling newly mined Bitcoin is miners’ primary source of income—used to cover capital expenditures on hardware and electricity costs—the historical average miner revenue acts as a proxy for the minimum threshold needed to sustain operations. When the Puell Multiple falls into the green zone, daily issuance value is abnormally low, historically presenting a strong buying opportunity. Conversely, when it enters the red zone, miner revenues are well above historical norms, often signaling a market top and an optimal time to take profits.
During the March 2024 rally, the Puell Multiple only reached 2.4, far below previous cycle peaks, indicating the market has not yet approached saturation. Compounding this, the post-halving reduction in mining rewards has further squeezed miner margins. According to financial results disclosed by BitFuFu for Q2 2024, the average self-mining cost of BTC—including direct expenses such as electricity, hosting, and hash rate purchases (excluding depreciation)—was $51,887 per BTC, compared to $19,344 per BTC in the same period of 2023. As a result, mining costs now approach or even exceed Bitcoin’s market price, placing immense pressure on miner profitability.
The sharp decline in the Puell Multiple reflects the market's response to rising production costs. Although Bitcoin’s price rose around the halving event, the Puell Multiple failed to reach historical highs, suggesting the market has not fully absorbed these structural changes or delivered the anticipated price surge. This may indicate a new phase for Bitcoin, where miners face higher costs and shrinking margins. Over the medium to long term, this could reduce Bitcoin supply inflows into the market, potentially providing some price support.
PlanB’s 200-Week Moving Average Heatmap: The Correction May Be Ending
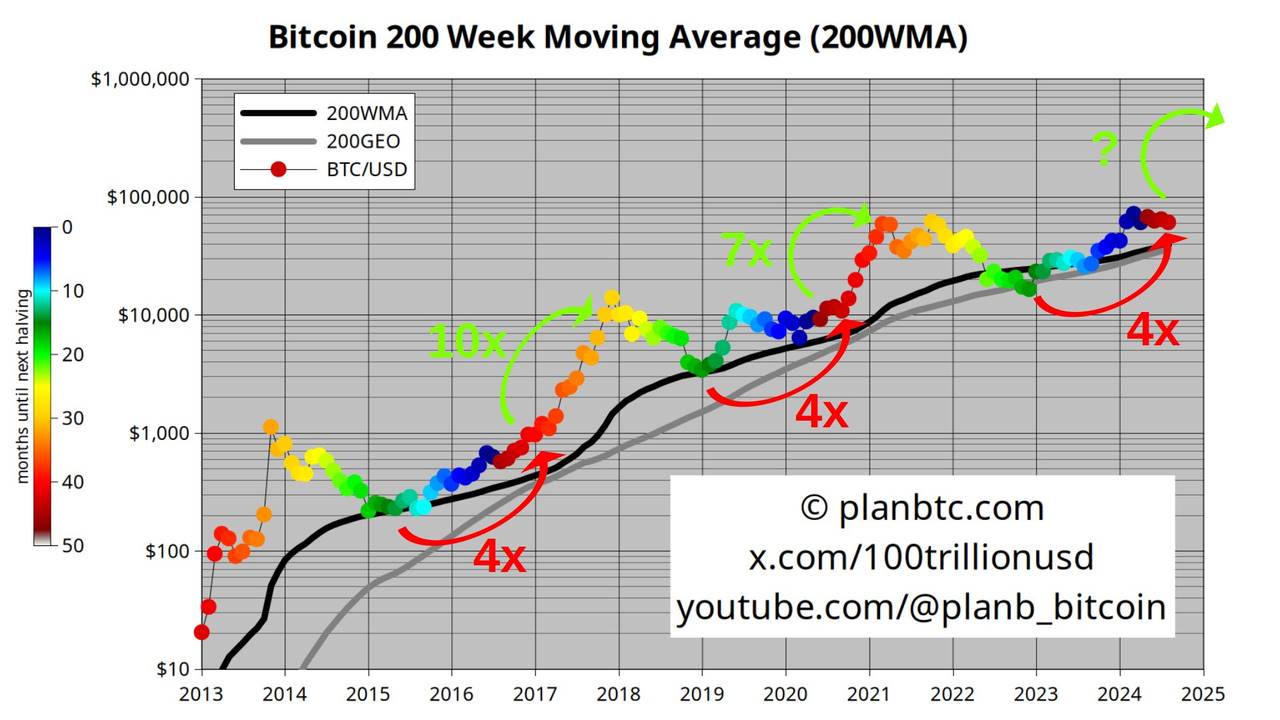
PlanB’s 200-week moving average (200WMA) is a critical indicator for analyzing Bitcoin’s long-term trend, widely regarded as a major support and resistance level and a reliable gauge of market sentiment. During the 2018–2019 bear market and the 2020 volatility triggered by the COVID-19 pandemic, the 200WMA consistently acted as a strong support. Even during the 2021 bull run, despite multiple corrections, each time the price neared the 200WMA, it found solid support and resumed its upward trajectory.
Historically, when orange and red dots appear on the price chart relative to the 200WMA, it suggests the market is overheated—a signal often interpreted as an ideal time to sell. Recently, PlanB noted that according to the 200WMA heatmap, Bitcoin has increased fourfold since its 2022 bottom. Historically, such stages have led to gains of 7–10x from this point forward.
RHODL Ratio: Speculative Enthusiasm Has Moderated
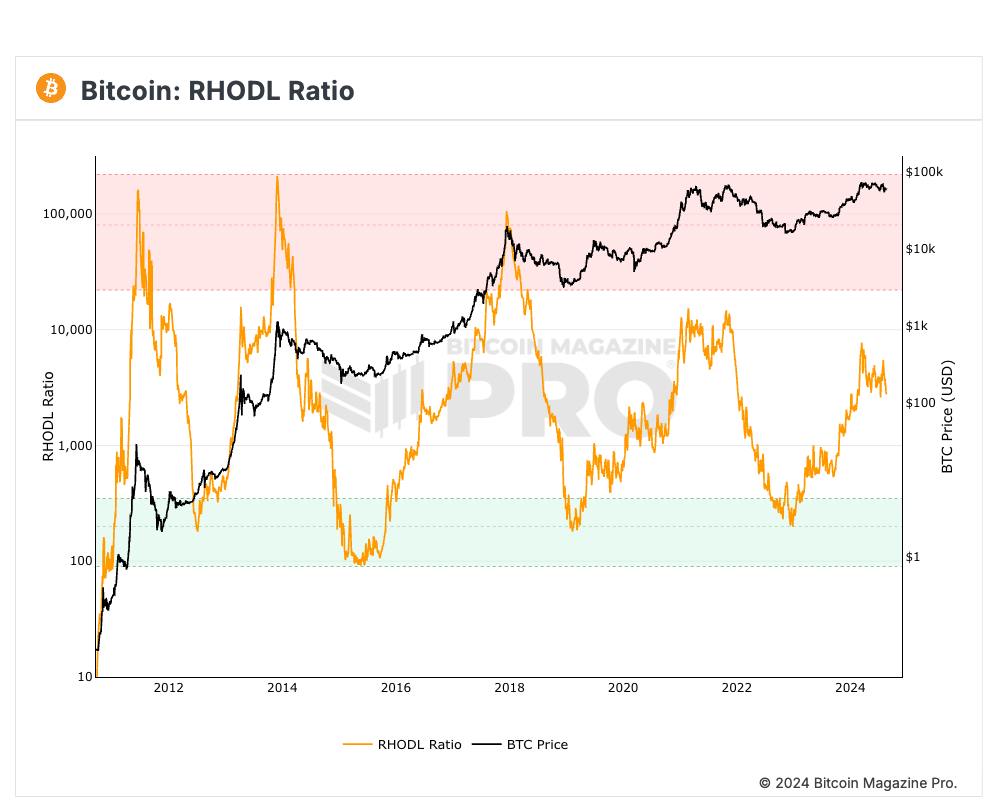
The RHODL (Realized HODL) Ratio, introduced by blogger Philip Swift (@positivecrypto) in June 2020, is a vital metric for evaluating speculative activity and holder behavior in the Bitcoin market. It compares the volume of Bitcoin held over different timeframes—specifically short-term (1 week to 1 month) versus long-term (1 to 2 years) UTXOs (Unspent Transaction Outputs)—to assess market activity and speculation levels. The RHODL Ratio is calculated by dividing the amount of long-term UTXOs by short-term UTXOs. A higher ratio implies more short-term holders, indicating greater speculative intensity; a lower ratio indicates dominance by long-term holders and a more stable market.
In practice, the RHODL Ratio excels at identifying market cycle peaks. When the 1-week band significantly exceeds the 1–2 year bands, it often signals market overheating and an approaching price top. Such conditions push the RHODL Ratio into the red zone, traditionally seen as a favorable window for profit-taking. Currently, the RHODL Ratio does not indicate that Bitcoin has reached a bull market peak. Although prices briefly spiked after breaking previous highs, the RHODL Ratio has trended downward over recent months amid ongoing volatility. This decline reflects gradually cooling market enthusiasm. However, due to persistent sentiment swings, short-term holder activity remains elevated—suggesting that while overall speculative fervor has diminished, short-term trading continues actively, and the market has not yet fully cooled down.
LTH/STH Realized Cap Distribution: The Main Uptrend May Not Have Begun
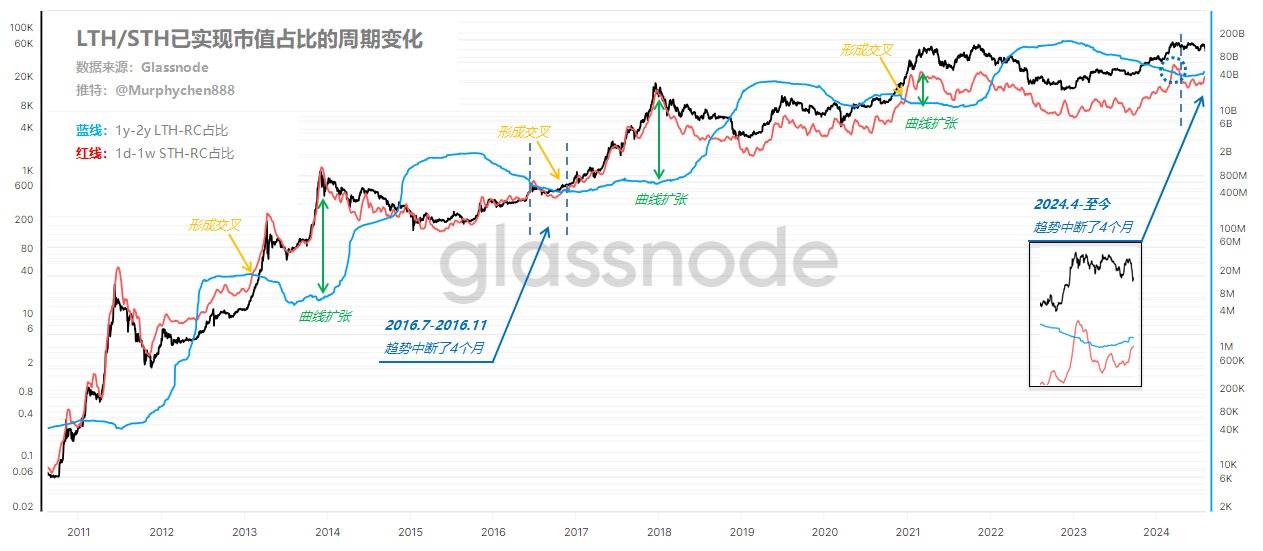
The LTH/STH realized cap distribution, analyzed by on-chain researcher @Murphychen, offers a useful framework for observing Bitcoin’s market trends. By tracking wealth distribution between Long-Term Holders (LTH) and Short-Term Holders (STH), we gain insight into cyclical transitions.
At bear market bottoms, long-term holders typically control most of the market’s wealth, pushing the blue line (LTH realized cap share) to its cyclical peak. Conversely, at bull market tops, short-term holders dominate supply, lifting the red line (STH realized cap share) to its highest level—coinciding with peak prices. When the red line crosses above the blue line, it often signals the beginning of a “main uptrend” and the start of a new bull phase. Conversely, a red-line cross below blue frequently marks the end of a bull run.
On March 9, 2024, the red line briefly crossed above the blue line, only to reverse and fall below again on April 15. This short-lived crossover was likely driven by temporary FOMO sparked by positive news around ETF approvals, prompting short-term investors to absorb coins from long-term holders. However, without sustained capital inflow, the rally quickly fizzled, failing to establish a durable upward trend. A similar pattern occurred between July and November 2016, when the market stalled for about four months. While the current market has shown short-term fluctuations, this fleeting breakout is insufficient to confirm the arrival of the cycle’s “main uptrend.”
In summary, although Bitcoin’s price in 2024 has undergone intense volatility and surpassed prior highs, multiple key on-chain indicators suggest the market has not yet reached the euphoric levels seen in previous bull runs. Both the MVRV Z-Score and Puell Multiple show upward momentum but remain well below historical peaks. Meanwhile, the 200-week moving average continues to provide strong support, hinting that the correction phase may be nearing its end. Additionally, the declining RHODL Ratio and ambiguous LTH/STH realized cap crossovers further suggest that market heat is gradually fading—not yet cold, but no longer boiling—with continued near-term volatility expected.
These metrics collectively indicate that the market remains in a transitional phase and has not entered the classic “main uptrend” of a bull cycle. Yet, in this complex and uncertain environment, we may be witnessing a new kind of bull market—one that cannot be fully understood through past analogies. The launch of spot Bitcoin ETFs has accelerated the maturation of Bitcoin’s bull case, bringing in substantial institutional capital, enhancing market participation and liquidity, while simultaneously introducing new layers of complexity. As sentiment evolves and capital reallocates, a new upward phase may still lie ahead.
Join TechFlow official community to stay tuned
Telegram:https://t.me/TechFlowDaily
X (Twitter):https://x.com/TechFlowPost
X (Twitter) EN:https://x.com/BlockFlow_News
 Foresight News