Markets Bet on "Trump Trade": How Will the U.S. Election Impact Asset Prices?
TechFlow Selected TechFlow Selected
Markets Bet on "Trump Trade": How Will the U.S. Election Impact Asset Prices?
The election itself cannot be a reason to trade bullish.
 Navigating Web3 tides with focused insights
Author: Lisa, LD Capital

I. Overview of the Election
On June 28 (Beijing time), Biden and Trump held their first debate in the 2024 presidential election. Trump clearly outperformed, while Biden’s poor performance triggered widespread public concern about whether his advanced age and mental condition would allow him to serve effectively. After the debate, Trump's approval ratings surged significantly. He also holds a decisive advantage in swing states, leading in all seven key battleground states: North Carolina, Arizona, Georgia, Nevada, Wisconsin, Michigan, and Pennsylvania.
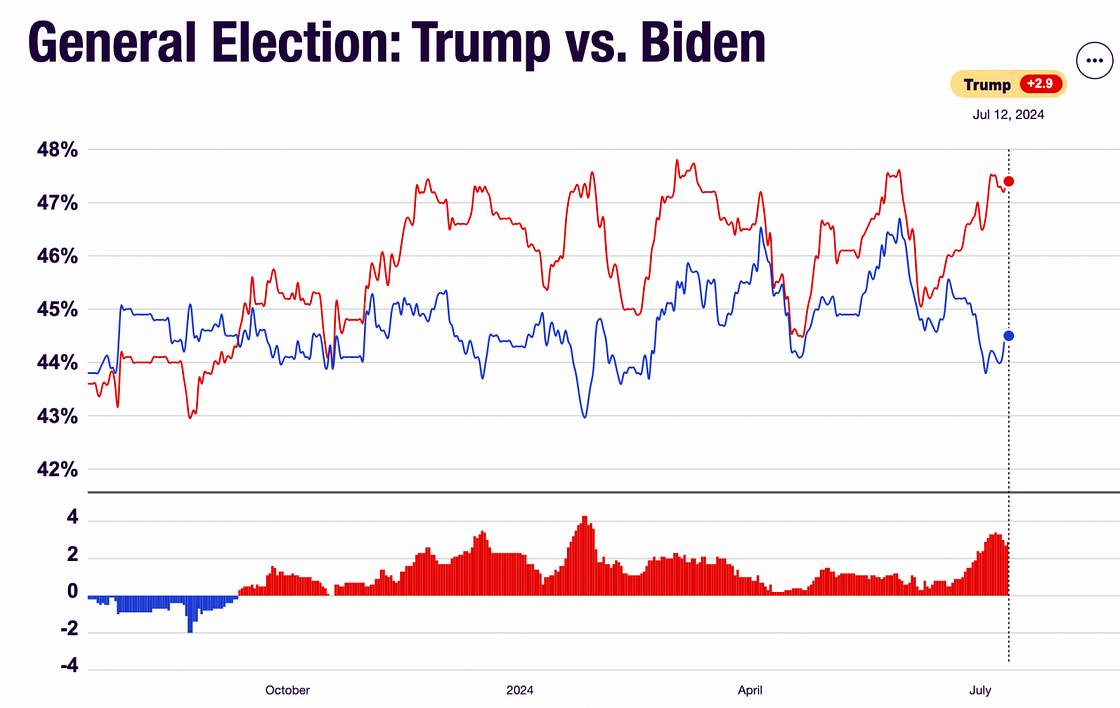
Source:
https://www.realclearpolling.com/polls/president/general/2024/trump-vs-biden
There are three critical upcoming dates in the campaign:
1) Party National Conventions: The Republican National Convention will be held from July 15–18, 2024, followed by the Democratic National Convention from August 19–22, where each party will formally nominate its presidential and vice-presidential candidates.
2) Second Candidate Debate: September 10, 2024.
3) Election Day: November 5, 2024.
II. Key Policy Differences
Biden and Trump hold largely consistent positions on infrastructure, trade, foreign policy, expanding investment spending, and incentivizing manufacturing reshoring. However, they differ significantly on tax policy, immigration, and new energy industries.
1) Taxation
Trump proposes further reducing the corporate income tax rate from 21% to 15%, without advocating for increased fiscal spending. In contrast, Biden's "Balancing Act" plan calls for higher taxes on corporations and high-income individuals, raising the corporate tax rate to 28%, while continuing student loan relief. During his previous term, Trump’s tax cuts boosted U.S. stock earnings and encouraged repatriation of overseas capital. The proposed tax reduction this cycle is less aggressive than before (the prior reform cut the rate from 35% to 21%), so its stimulative effect is expected to be weaker. CICC estimates that under Trump’s proposal, S&P 500 net profit growth in 2025 could rise 3.4 percentage points to 17%, up from the market consensus of 13.7%.
2) Immigration
Since Biden took office in 2021, there has been a significant increase in illegal immigration into the United States. Compared to Biden’s more lenient immigration stance, Trump advocates stricter immigration controls but with relaxed requirements for “high-level” talent. Tighter immigration policies could weaken U.S. economic growth momentum and accelerate wage inflation.
3) Industrial Policy
The two candidates have major differences in energy policy. Trump supports returning to traditional energy sources, accelerating permits for oil and gas exploration, increasing fossil fuel development to maintain U.S. cost advantages in energy and electricity, and potentially eliminating green subsidies for electric vehicles and batteries. Biden, on the other hand, continues to advocate for advancing clean energy development.
4) Trade Policy
Both Biden and Trump support high tariff policies, which may raise costs of imported raw materials and consumer goods, creating headwinds for CPI disinflation. Trump’s approach is notably more aggressive. Biden announced in May new tariffs on Chinese imports, covering only $18 billion in goods, with some hikes not taking effect until 2026. Trump, however, proposes imposing a baseline 10% tariff on all imports into the U.S., plus an additional 60% or higher tariff on Chinese goods, along with “specific tariffs” on certain regions or sectors.
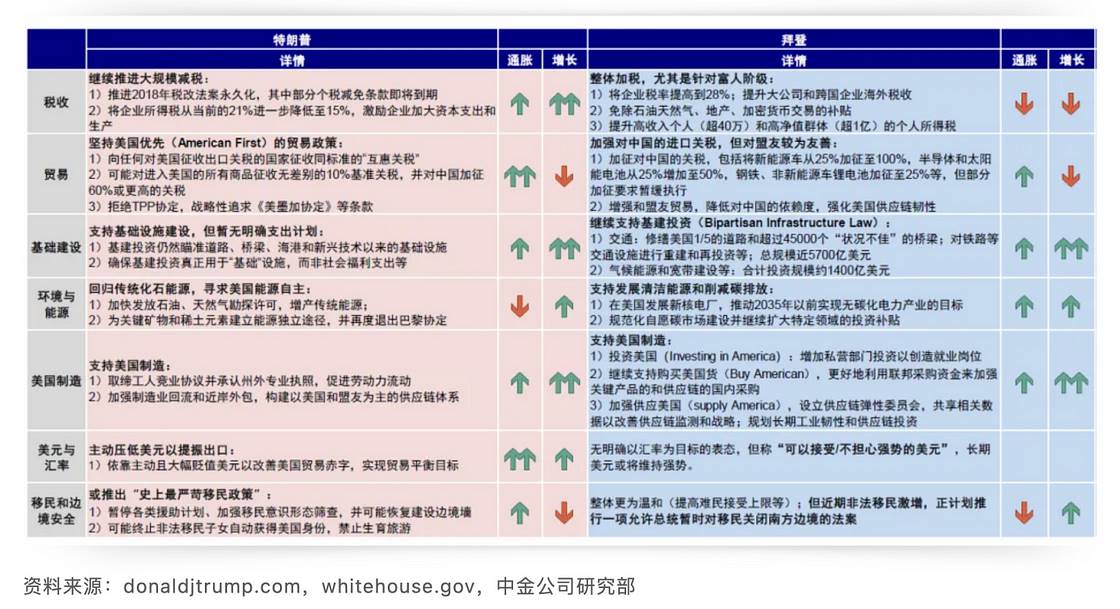
As shown above, Trump has significantly more green arrows, indicating that his tariff policy, domestic tax cuts, and immigration restrictions are generally unfavorable for inflation moderation.
III. General Characteristics of Asset Prices in Election Years
First, from a full-year perspective, overall market performance and changes in the federal funds rate during election years do not significantly differ from non-election years.
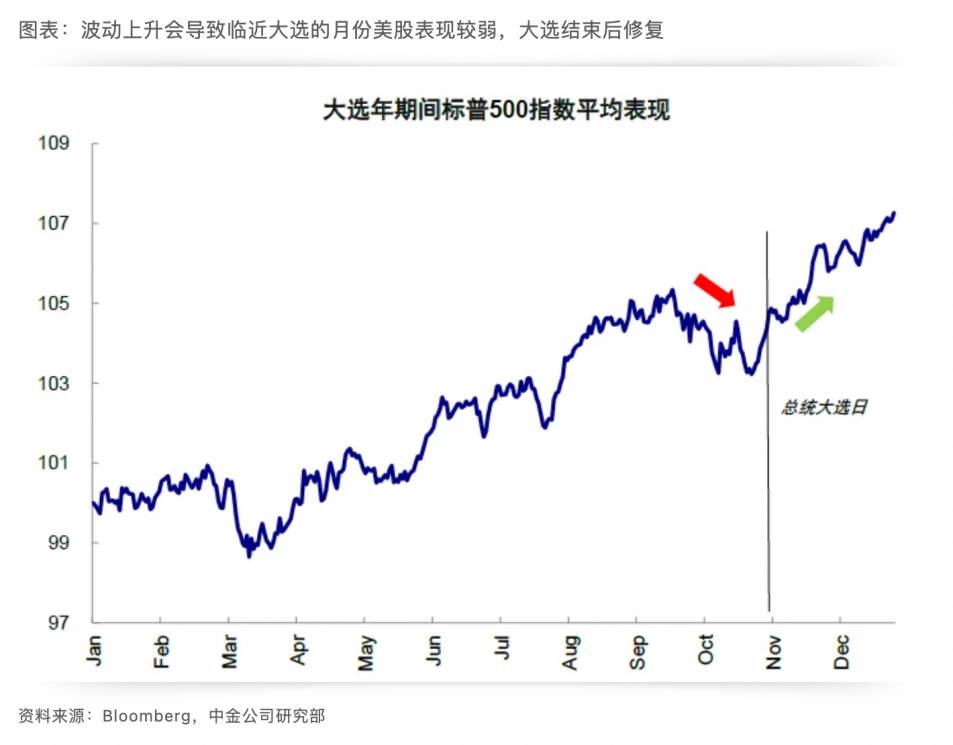
When analyzed by quarter and month, in the pre-election period (mainly Q3 of the election year), fluctuations in the federal funds rate are notably smaller than in other quarters, while asset prices exhibit higher volatility. This is likely because monetary policy tends to remain on hold close to elections to avoid perceptions of political influence, whereas asset prices react to uncertainty around election outcomes. Contrary to the typically strong seasonal pattern in October–December in non-election years, stock performance in October preceding an election tends to be notably weaker.
IV. Market Performance Following Trump’s Previous Victory
On November 9, 2016, preliminary results of the U.S. presidential election were announced, with Republican candidate Donald Trump winning and becoming the 45th President of the United States. Trump’s victory exceeded market expectations, triggering asset price volatility. Markets began pricing in the so-called “Trump Trade,” leading to higher Treasury yields, a stronger dollar, and rising U.S. equities from November to December 2016. After these expectations were digested, related trades gradually faded. Below are price movements across various asset classes at that time (all weekly charts).
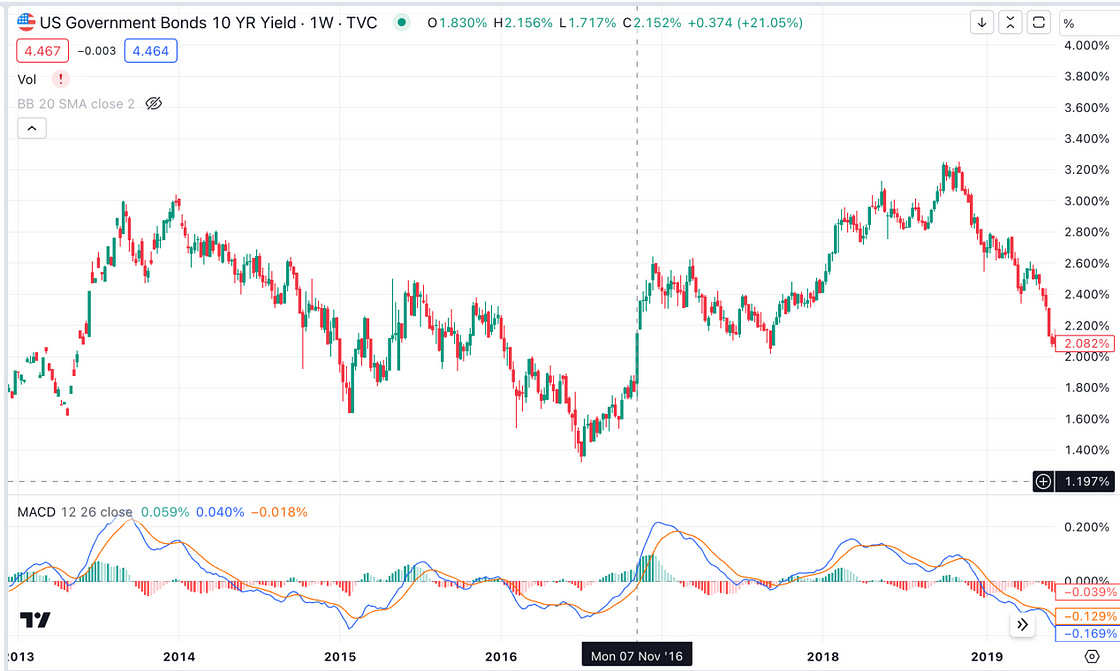
U.S. Treasury yields rose initially then retreated
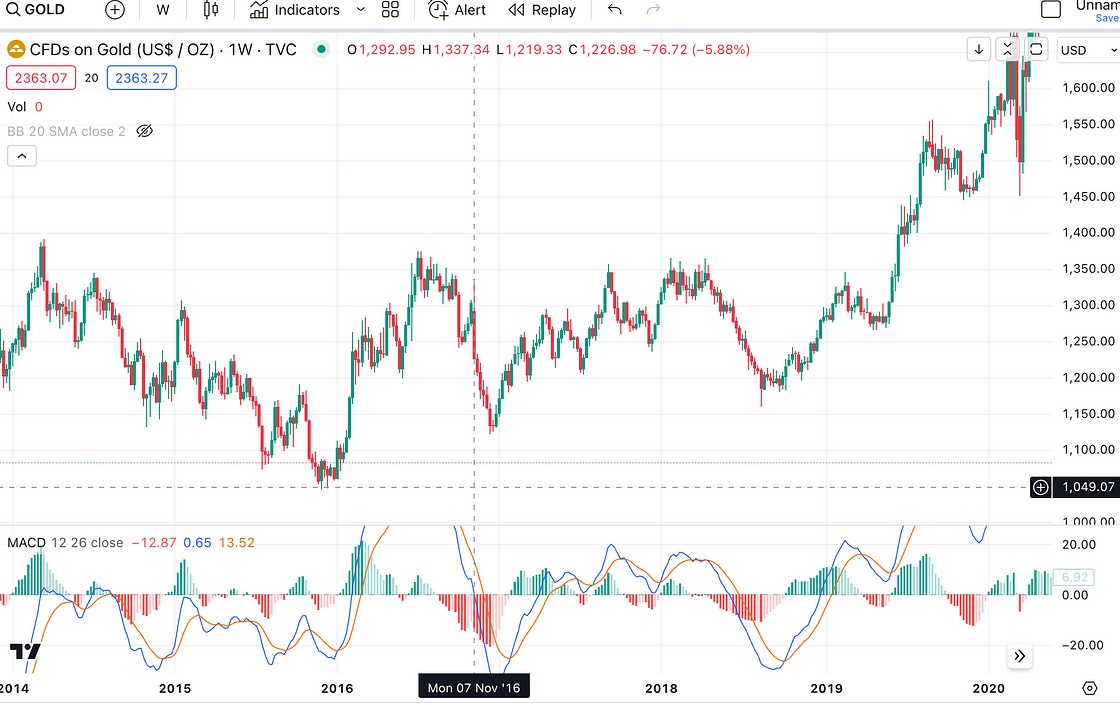
Gold initially declined, then rebounded in line with Treasury yield volatility
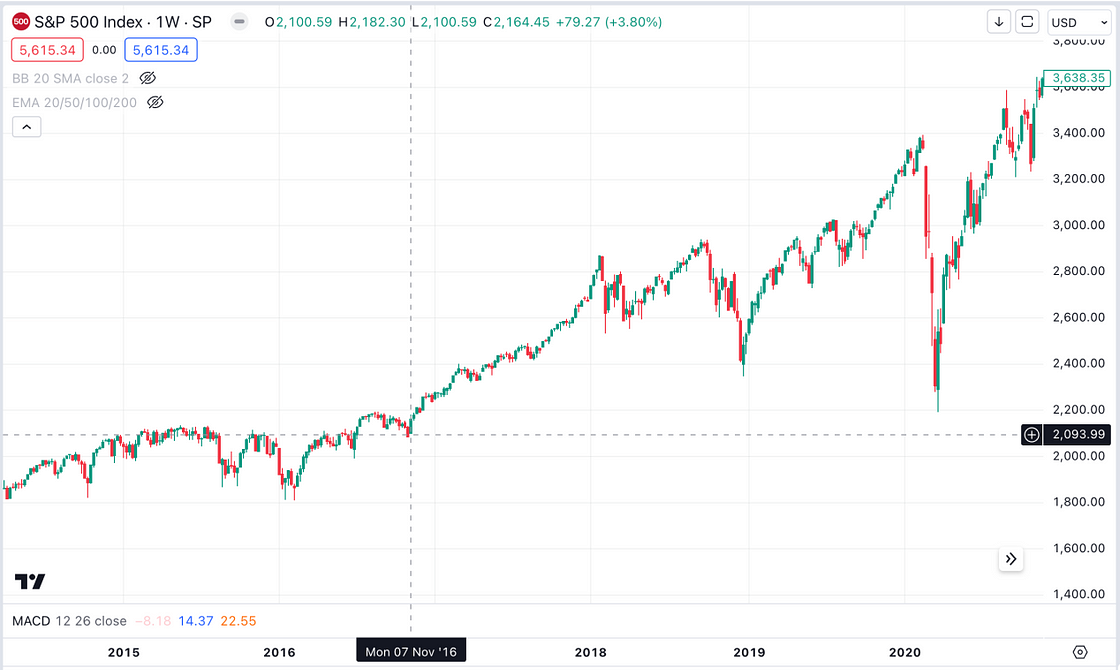
S&P 500 rose
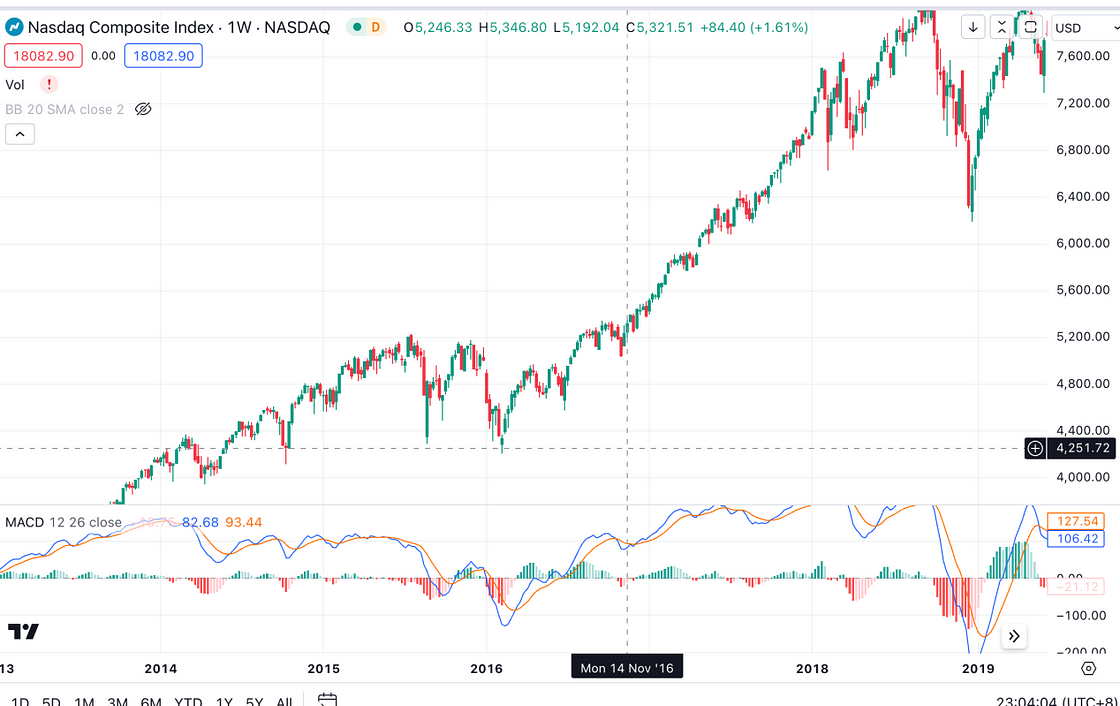
Nasdaq rose
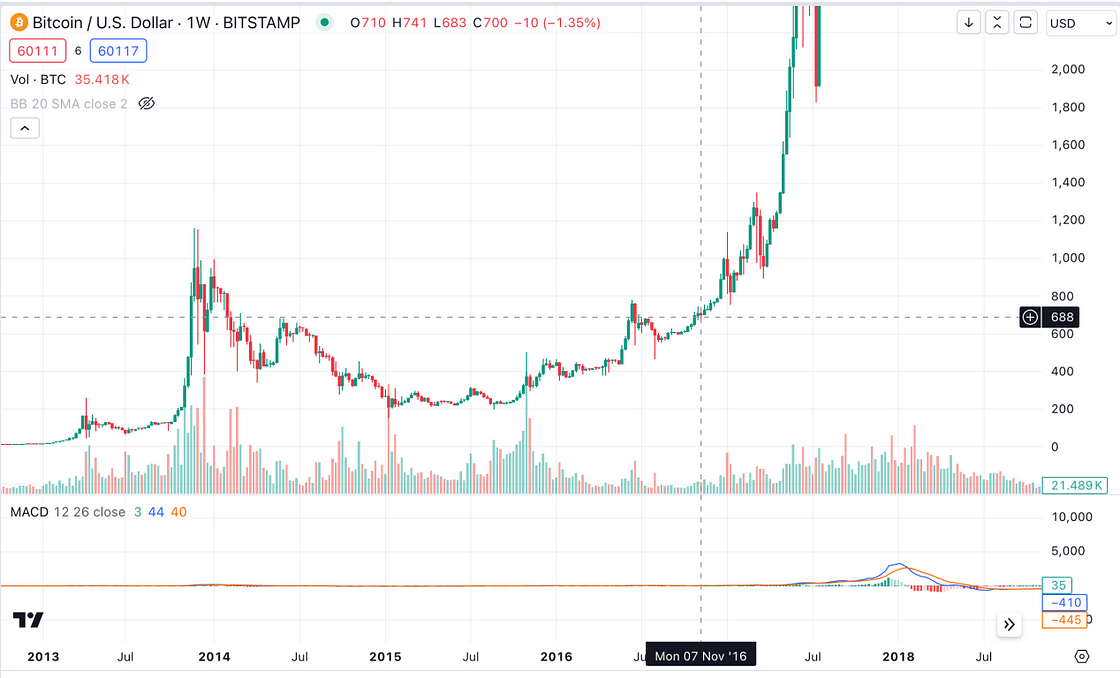
BTC rose
This time, the onset of “Trump Trade” has started much earlier. After the first debate, market expectations for a Trump victory strengthened markedly, prompting early positioning for “Trump Trade.” On the day following the debate, the 10-year U.S. Treasury yield spiked to around 4.5%.
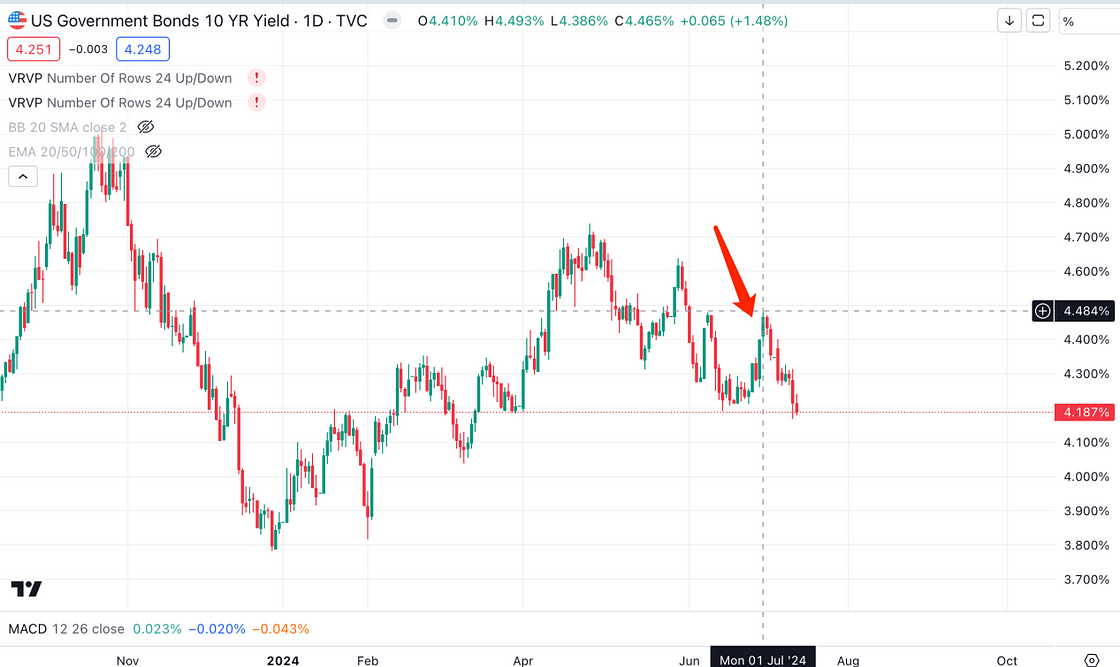
Adding to this, the shooting incident involving Trump on July 14 could generate sympathy votes. The most likely outcome now appears to be a Trump presidency with Republicans controlling both chambers of Congress. It is therefore foreseeable that the attempted assassination over the weekend will likely boost U.S. equity markets on the coming Monday.
V. Summary
Impact of the U.S. election on financial markets:
1) The election itself should not be used as a rationale for bullish trading; the simplistic logic that Democrats need a rising stock market to win re-election does not hold;
2) Around October in a typical election year, markets face downside risks due to elevated volatility;
3) Trading on election outcomes (“Trump Trade”) primarily involves going long CPI (meaning betting against disinflation, not necessarily expecting outright inflation), long Treasury yields (again, meaning providing resistance to downward pressure rather than absolute increases), short gold, long U.S. equities—though the magnitude may be smaller than during Trump’s last victory—and long BTC (on the view that BTC tends to follow U.S. equities, and deviations are unsustainable over the long term; additionally, Trump is crypto-friendly).
Join TechFlow official community to stay tuned
Telegram:https://t.me/TechFlowDaily
X (Twitter):https://x.com/TechFlowPost
X (Twitter) EN:https://x.com/BlockFlow_News
 Cycle Capital Research