








Insight Data Issue 05 | OKX Web3 & 0xScope: A Guide to On-Chain Data Analysis—How Can Beginners Take the First Step?
TechFlow Selected TechFlow Selected
Insight Data Issue 05 | OKX Web3 & 0xScope: A Guide to On-Chain Data Analysis—How Can Beginners Take the First Step?
This episode was co-hosted by the OKX Web3 team and the 0xScope team, focusing on topics such as "How to Establish a Methodology for On-Chain Data Analysis."
 Navigating Web3 tides with focused insights
Summary: In the cryptocurrency market, data has always been a crucial factor in making trading decisions. How can we cut through the noise and uncover effective data to optimize our trading strategies? This is an ongoing topic of interest for the market. As part of this effort, OKX has launched the "Insights on Data" column in collaboration with leading industry data platforms such as CoinGlass, AICoin, Coingecko, and 0xScope, aiming to develop more systematic data methodologies based on common user needs, offering valuable references for the broader market.
Below is the fifth installment of this series, jointly prepared by the OKX Web3 team and the 0xScope team, focusing on topics such as "how to build a methodology for on-chain data analysis," which we hope will be helpful to you.
About 0xScope: 0xScope is a leading Web3 data analytics and AI-powered data provider. It is building a universal Web3 LLM aimed at lowering barriers for users to understand and interact with Web3 through artificial intelligence. Since 2022, 0xScope has accumulated extensive Web3-related data, now adopted by nearly 200 professional Web3 institutions. Its products Scopescan and Scopechat have together attracted over one million users to date.
About OKX Web3: The team brings together top-tier talent with deep technical expertise and rich industry experience, continuously innovating and implementing new solutions in the crypto space while prioritizing user experience and security. Currently, the OKX Web3 Wallet stands as one of the most comprehensive decentralized multi-chain wallets available, supporting over 90 public chains and integrating five core modules: wallet, trading, NFT marketplace, DeFi, and DApp discovery. Users can access their multi-chain tokens, NFTs, and DeFi assets via app, browser extension, or web platform.
1. On-chain data analysis is important—how should beginners get started?
0xScope: First, grasp the fundamental concepts and logic—such as address, amount, sender (from), receiver (to), and gas fees. Begin by using and understanding basic blockchain explorers, then leverage additional tools for deeper analysis.
Commonly used platforms and tools include on-chain data platforms, blockchain explorers, and APIs. On-chain data platforms (e.g., ScopeScan, ScopeChat, Nansen, Glassnode, Dune Analytics) offer convenient data access and analytical capabilities. Blockchain explorers (e.g., Etherscan, Blockchain.com Explorer) allow manual queries of blocks, transactions, and account details. Additionally, many blockchain networks and data providers (e.g., Etherscan API, CoinGecko API) offer APIs that enable programmatic retrieval of on-chain data.
Furthermore, on-chain data analysis generally falls into two categories: transactional and investigative. Transactional analysis helps identify early alpha or trends by examining on-chain activity, or supports strategy development through fundamental analysis of specific assets. Investigative analysis focuses on tracing fund flows, mapping potential relationships between addresses, or uncovering root causes behind anomalous events through data correlation.
OKX Web3: On-chain data analysis involves inspecting and interpreting data directly recorded on blockchains to gain insights into network activity, user behavior, and market trends. For newcomers looking to start with on-chain analysis, here are some key steps:
First, become familiar with blockchain explorers like Etherscan and learn how to interpret basic transaction data and wallet activity. Second, monitor key on-chain metrics such as active addresses, transaction volume, and supply distribution. Third, explore user-friendly on-chain analysis tools like Nansen, DeBank, and Glassnode to visualize complex data clearly.
Start with basic indicators—track simple data points like daily active addresses or number of transactions. Understand how on-chain data correlates with market movements and trader behavior, and analyze historical data to identify patterns linked to price changes. Finally, combine on-chain analysis with fundamental and technical analysis for a more holistic perspective.
2. Which key metrics should be prioritized?
0xScope: It really depends on your goals and use case:
If your strategy is based on fundamental or long-term trading, we recommend focusing on these 10 metrics:
• Transaction Count: Total number of transactions on the blockchain network within a given period, reflecting overall network activity and usage;
• Active Addresses: Number of unique addresses involved in transactions during a certain timeframe. More active addresses indicate higher user engagement;
• Newly Created Addresses: Number of new addresses created within a time window. Growth indicates new user acquisition and network expansion;
• Transaction Fees: Total fees paid by users for transactions. High fees may signal strong demand and network congestion, reflecting willingness to pay for priority processing;
• Average Transaction Value: Average amount per transaction. Higher values suggest larger transfers, providing insight into capital flow and user habits;
• Liquidity: Tradable asset volume in decentralized exchanges (DEXs). High liquidity contributes to market stability, lower slippage, and greater depth;
• Token Holder Concentration: Distribution of token ownership, e.g., percentage held by top 10/50/100 holders. High concentration increases volatility risk and reflects market centralization;
• Total Value Locked (TVL): Total value of assets locked in DeFi protocols. High TVL often signals popularity and trust in a protocol, indicating its scale and adoption;
• Smart Contract Invocations: Number of calls made to smart contracts over time. Frequent invocations show high usage and community engagement;
• Developer Activity: Frequency of code updates and number of contributors in a project’s repository. Active development suggests continuous improvement and strong community support.
If your strategy focuses on short-term trading or trend capture, pay attention to overbought/oversold conditions on DEXs, which reflect abnormal market demand fluctuations, as well as large deposits or withdrawals on exchanges, which may reveal institutional buying or selling intentions.
If you're pursuing copy trading, focus more on “smart money” activity. For example, historical returns of smart money help identify consistently profitable traders; trading frequency and volume reflect their market participation level. Success rate measures accuracy, while holding duration reveals whether their strategy is short- or long-term. Asset diversification shows portfolio breadth, and transaction costs indicate efficiency. Risk-adjusted returns assess profitability relative to risk exposure. Smart money reputation within the community adds qualitative context. Liquidity provision behavior may also influence their trading patterns. These metrics collectively enhance understanding of smart money moves.
For risk detection, we recommend monitoring at least these 10 key indicators:
• Anomalous Transaction Volume: Transactions significantly exceeding normal levels, potentially signaling attacks or suspicious activities like hacks or illicit fund movement;
• Large Transfers: Transactions above a certain threshold, possibly indicating theft, money laundering, or evasion attempts;
• Transaction Frequency: Number of transactions per unit of time. Unusually high frequency could indicate automated attacks or fraud;
• High Volume from New Addresses: Recently created addresses conducting numerous transactions shortly after creation—often used by attackers to obscure identity;
• Smart Contract Calls: Interactions involving smart contracts, which may be targets or tools in attacks. Analyzing them helps understand attacker tactics;
• Token Transfers: Movement of specific tokens across the network. Abnormal transfers may point to theft or unauthorized movements;
• Anomalous Gas Fees: Fees significantly higher or lower than average. Attackers might use high gas to front-run or low gas to hide micro-transactions;
• Transaction Time Intervals: Time gaps between consecutive transactions. Short intervals may indicate bot-driven or scripted attacks;
• Anomalous Protocol or Contract Activity: Sudden spikes in activity for specific protocols or contracts, possibly due to exploits or internal issues;
• Account Balance Changes: Significant shifts in wallet balances, useful for detecting stolen or moved funds.
Ultimately, these metrics represent traces left behind by major players. Beginners can study these patterns to sense market dynamics.
OKX Web3: For beginners, we recommend starting with these four key metrics to better understand blockchain networks and market dynamics:
• Active Addresses: Offers insight into network usage and economic activity. Tracking changes helps gauge real-world adoption and user engagement.
• Transaction Volume: A vital indicator of market activity, helping assess buy/sell pressure. High volume suggests active participation; low volume may indicate观望 (wait-and-see) sentiment.
• MVRV (Market Value to Realized Value) and NUPL (Net Unrealized Profit/Loss): These provide deep insights into market valuation and investor sentiment. MVRV helps determine if an asset is overvalued or undervalued, while NUPL reveals whether investors are collectively in profit or loss.
• Supply Distribution: Shows concentration of token ownership. Helps identify whether tokens are overly centralized, which could affect liquidity and market stability.
As beginners grow comfortable with these foundational metrics, they can gradually incorporate more advanced ones—such as on-chain transaction fees, mining difficulty, and network hash rate—to deepen their understanding of blockchain ecosystems.
3. How can on-chain data help identify emerging Web3 projects?
0xScope: A simple method is to check the daily gas consumption leaderboard. Contracts showing sudden spikes in gas usage often correspond to trending or newly popular projects.
A more efficient approach is using the Etherscan Chrome GAS plugin, which displays current gas levels directly in your browser toolbar. When you notice a spike, refer to the Top Gas Consumers list on our platform or Etherscan’s Gas Tracker to see where gas is being spent—this often leads to discovery of new projects.
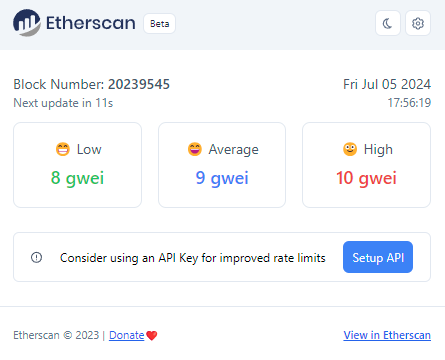
We commonly use Scopescan’s Top Gas Consumer ranking. If you follow it regularly, you’ll notice that top spots on Ethereum are usually occupied by Uniswap Router, USDT contract, Banana Gun, and other Telegram bots. If you spot an unfamiliar contract, check if it has labels on Scopescan or Etherscan. Advanced users can investigate who deployed it and where the gas originated. Another method is checking our Project Explorer rankings—if an unknown project suddenly appears in TVL Rank or User Rank, it’s worth investigating.
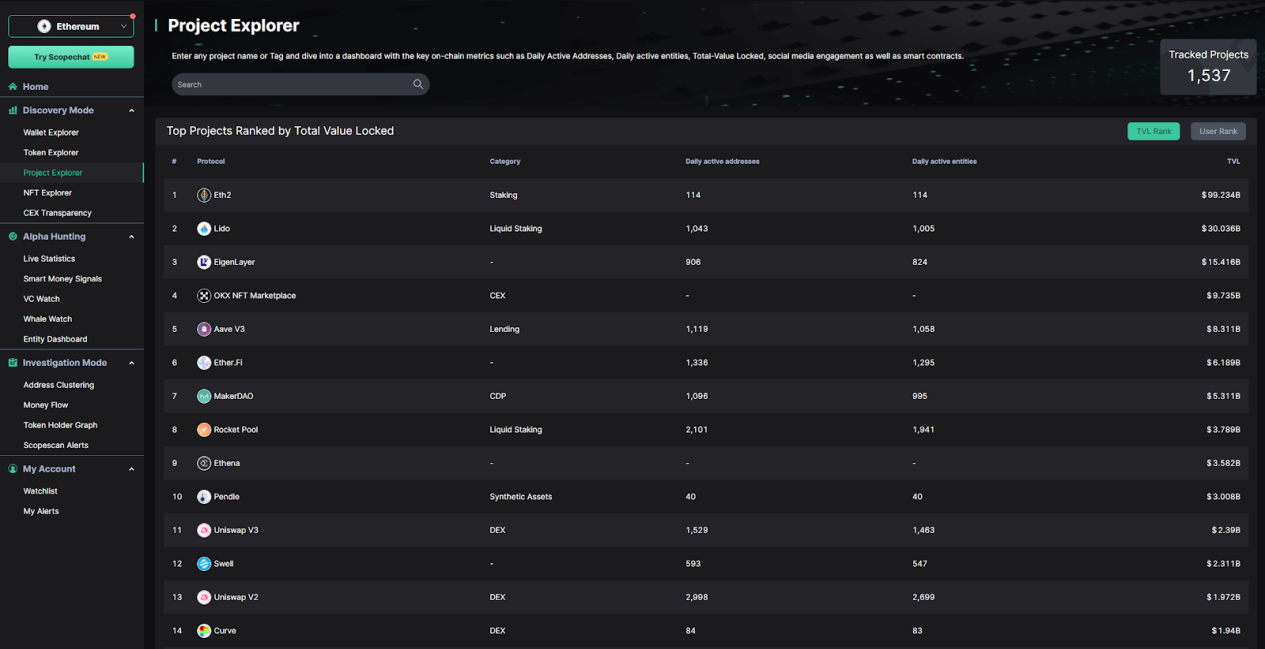
OKX Web3: There are multiple ways to identify emerging on-chain projects. First, monitoring on-chain activity is essential—track new smart contract deployments, rising transaction volumes, and unique addresses interacting with contracts. Analyzing a new project’s gas consumption provides insight into its level of activity and development progress within the ecosystem.
Second, leverage data aggregation platforms like Dune Analytics, Nansen, and Glassnode, which offer customizable dashboards to efficiently track key metrics of emerging projects. These tools can monitor TVL growth in DeFi, daily active users of dApps and games, and assess token transfer volume and holder growth.
Beyond on-chain data, cross-referencing off-chain signals is also critical. Monitor social media traction and community growth, review GitHub repositories for developer activity, and analyze token price trends and exchange trading volumes. Combining all these sources enables a comprehensive evaluation of a project’s potential.
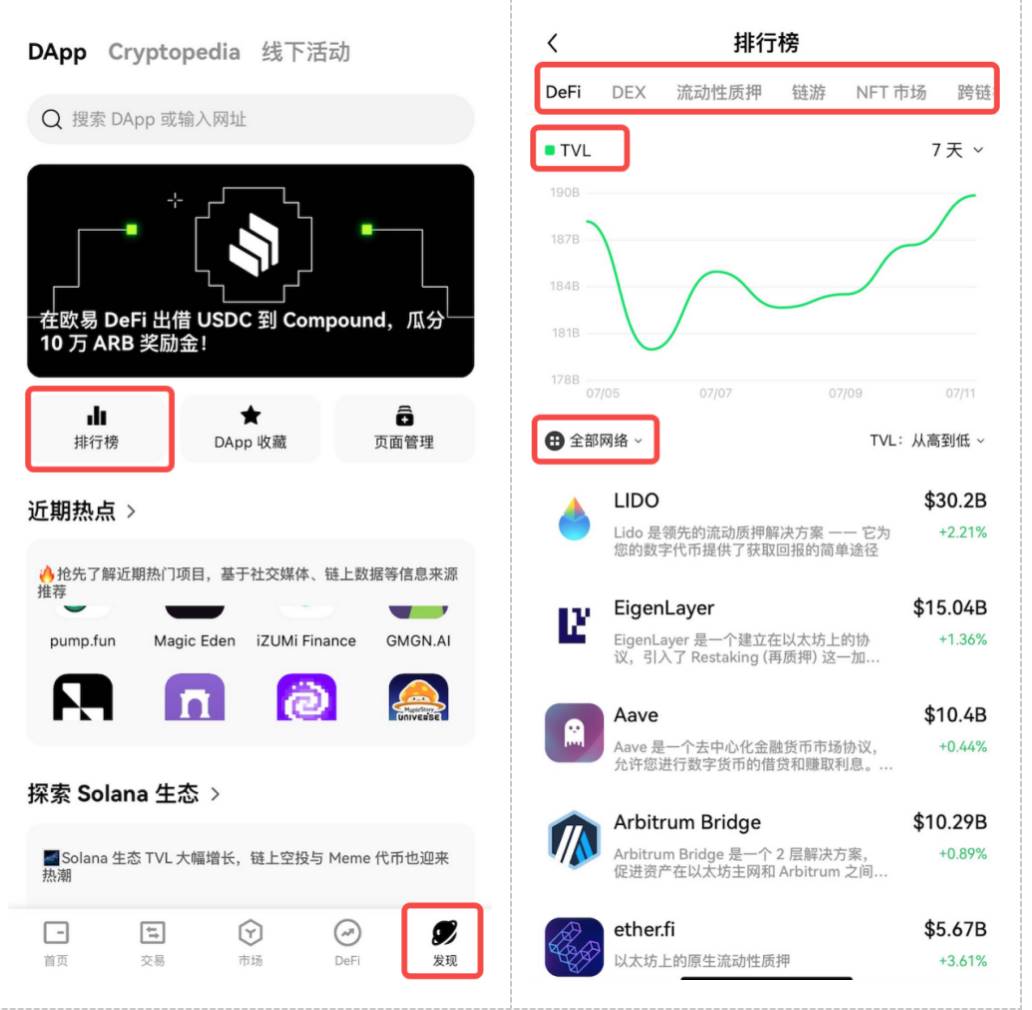
But if this seems too cumbersome, simply visit the Discovery section in the OKX Web3 Wallet to easily view rankings of DeFi protocols, DEXs, and other on-chain metrics such as TVL, DEX trading volume, and lending activity—all in one place.
4. What are common pitfalls and precautions in on-chain data analysis?
0xScope: We believe there are several common misconceptions and important considerations in on-chain data analysis:
First, misunderstandings around address labeling and activity. For instance, a transfer doesn’t necessarily mean a buy or sell, and exchange deposits/withdrawals don’t always reflect actual trading intent. Market makers frequently deposit and withdraw to provide liquidity, so only significant deviations from normal levels should be treated as potential market signals.
Second, most users operate multiple addresses, so analysis should consider aggregate behavior rather than isolated addresses. However, sophisticated actors may move funds via centralized exchanges, meaning purely on-chain analysis may miss key movements. Overreliance on a single data source is risky—combine on-chain data with off-chain insights. For example, when markets fluctuate suddenly, checking relevant news (e.g., macroeconomic announcements) provides essential context.
Third, influencers often highlight selective transactions without analyzing the underlying addresses or entities. Analysts must dig deeper themselves to understand the full story behind the data. Lastly, choose data products with long-standing operations and strong reputations to ensure reliability and accuracy.
OKX Web3: We fully agree with 0xScope’s perspective. Newcomers must be aware of several common pitfalls in on-chain data analysis.
First, data accuracy and reliability are paramount. On-chain data can be incomplete or distorted by various factors. Be cautious of potential data manipulation by project teams or large holders, which may mislead analysis.
Second, misinterpretation is common. Context is crucial—avoid drawing conclusions from isolated data points without considering broader market conditions.
Third, overreliance on a single metric is risky. Avoid basing decisions on just one or two indicators. Instead, use a combination of metrics and cross-reference with off-chain data for robust analysis.
Finally, recognize the gap between on-chain data and reality. Some activities—like off-chain trades or Layer 2 transactions—may not be fully captured. Understanding the limitations of your data is a critical step toward effective analysis.
Conclusion
This concludes the fifth episode of OKX's "Insights on Data" series, focusing on practical topics like how beginner users can establish a methodology for on-chain data analysis—offering guidance for those just entering the space. In future installments, we will continue exploring more practical data usage and analytical methods, providing valuable resources for traders and newcomers alike to learn about trading and the broader industry.
Risk Warning and Disclaimer
This article is for informational purposes only. The content reflects the authors' views and does not represent the position of OKX. This article is not intended as (i) investment advice or recommendation; (ii) an offer or solicitation to buy, sell, or hold digital assets; or (iii) financial, accounting, legal, or tax advice. We do not guarantee the accuracy, completeness, or usefulness of the information provided. Holding digital assets—including stablecoins and NFTs—involves high risk and prices may fluctuate significantly. You should carefully consider whether trading or holding digital assets is suitable for you based on your financial situation. Please consult your legal/tax/investment professionals regarding your specific circumstances. You are solely responsible for understanding and complying with applicable local laws and regulations.
Join TechFlow official community to stay tuned
Telegram:https://t.me/TechFlowDaily
X (Twitter):https://x.com/TechFlowPost
X (Twitter) EN:https://x.com/BlockFlow_News
 OKX
OKX






