

10 Charts Revealing the Current State of the Crypto Market: BTC Dominance Over 52%, Stablecoin Supply Up 14% in Q1
TechFlow Selected TechFlow Selected
10 Charts Revealing the Current State of the Crypto Market: BTC Dominance Over 52%, Stablecoin Supply Up 14% in Q1
Typically, the altseason triggered by the halving reduces Bitcoin's dominance, shifting momentum toward new altcoins. This hasn't happened yet, so there's still significant room for growth.
Written by: THE ALTCOIN INVESTOR
Translated by: TechFlow
Today I want to share 10 charts that can help you navigate the current cryptocurrency market.
Ten Charts on the State of Cryptocurrency
Glassnode and Coinbase have released their Guide to Crypto Markets, a quarterly series designed to provide detailed analysis of major developments in the crypto market.
Here are 10 charts from the report that caught our attention:
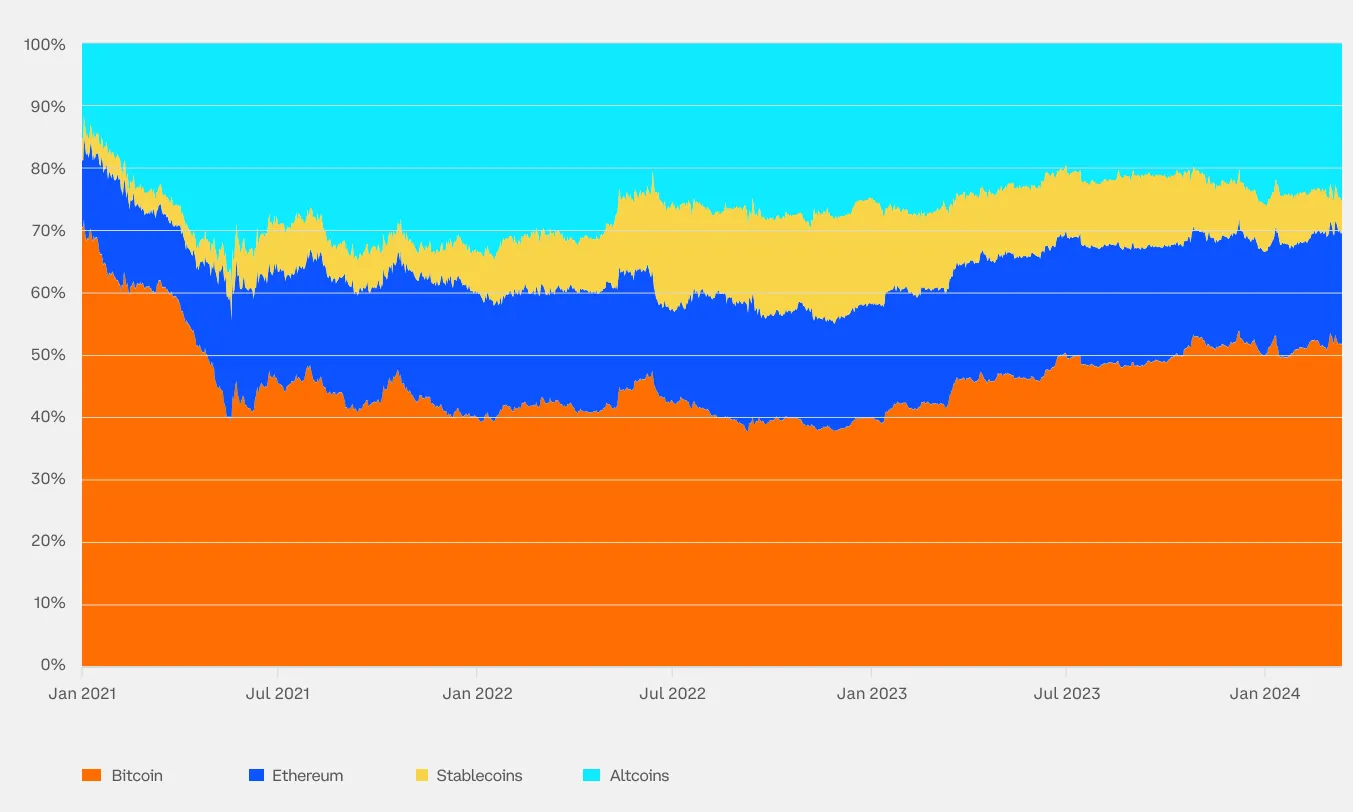
1. Bitcoin Dominance Rises from 50% to 52%

Typically, the altcoin season triggered by halving events reduces Bitcoin's dominance as capital shifts toward new altcoins. This hasn't happened yet, indicating significant room for growth ahead.
2. Cryptocurrency Correlations
Historically, cryptocurrencies have shown very low correlation with traditional asset classes, suggesting they can serve as a meaningful source of unique risk in many investment portfolios.
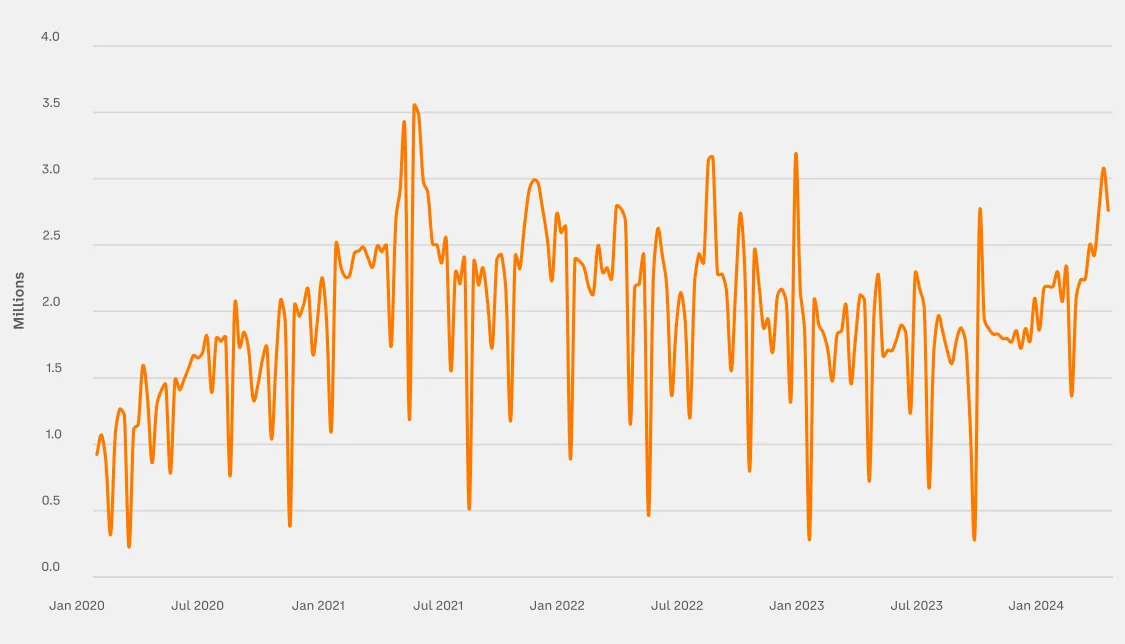
3. Stablecoin Supply Rose Over 14% in Q1
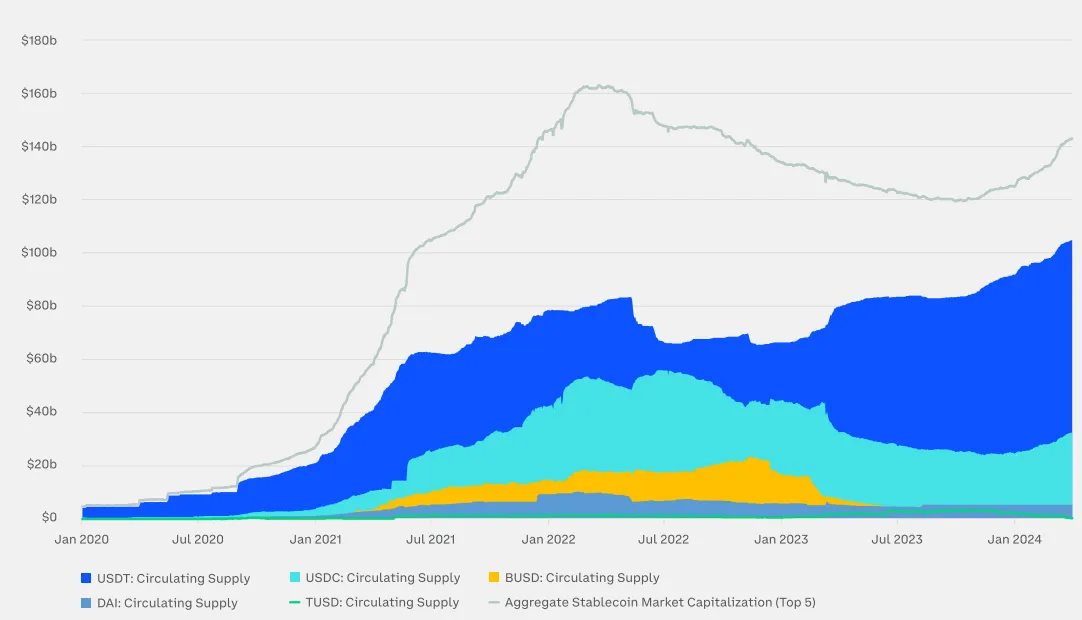
An important metric when evaluating stablecoins is the amount and nature of reserve assets they hold. As market participants continue increasing their use of stablecoins, supply rose over 14% in the first quarter.
4. Bitcoin Price Performance After Halving
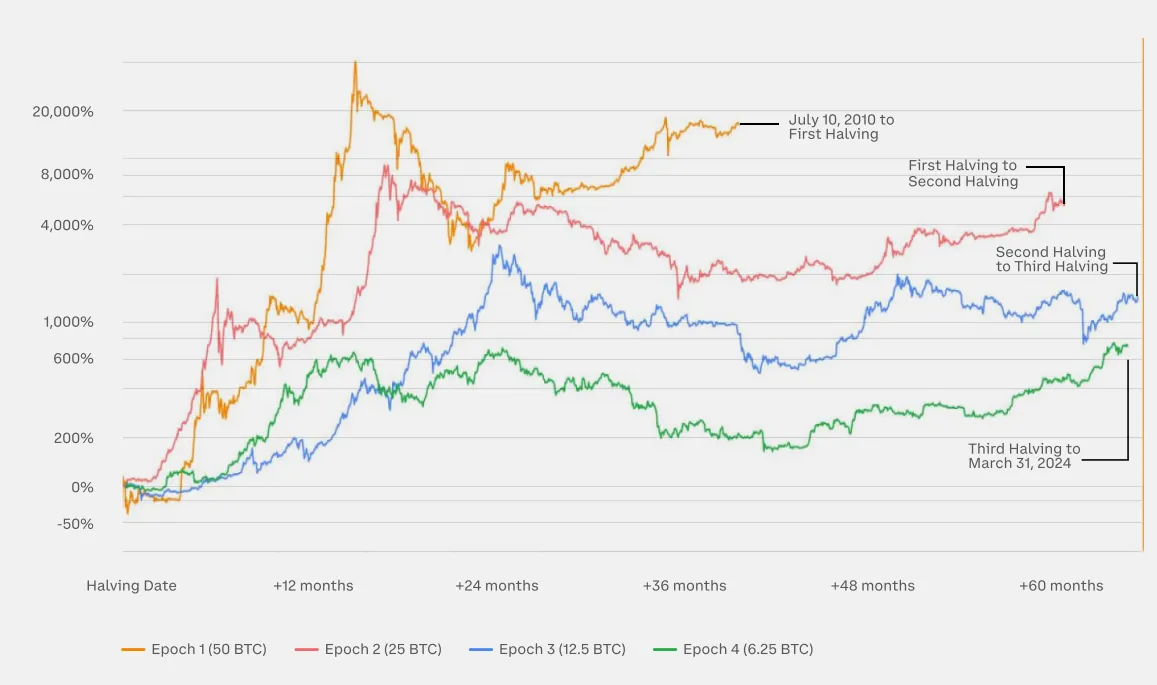
This chart measures Bitcoin’s total return across each halving cycle. In the 12 months following the first three halvings, prices:
-
Increased over 1000% after the first halving (red line)
-
Increased over 200% after the second halving (blue line)
-
Increased over 600% after the third halving (green line)
5. Bitcoin Available Supply
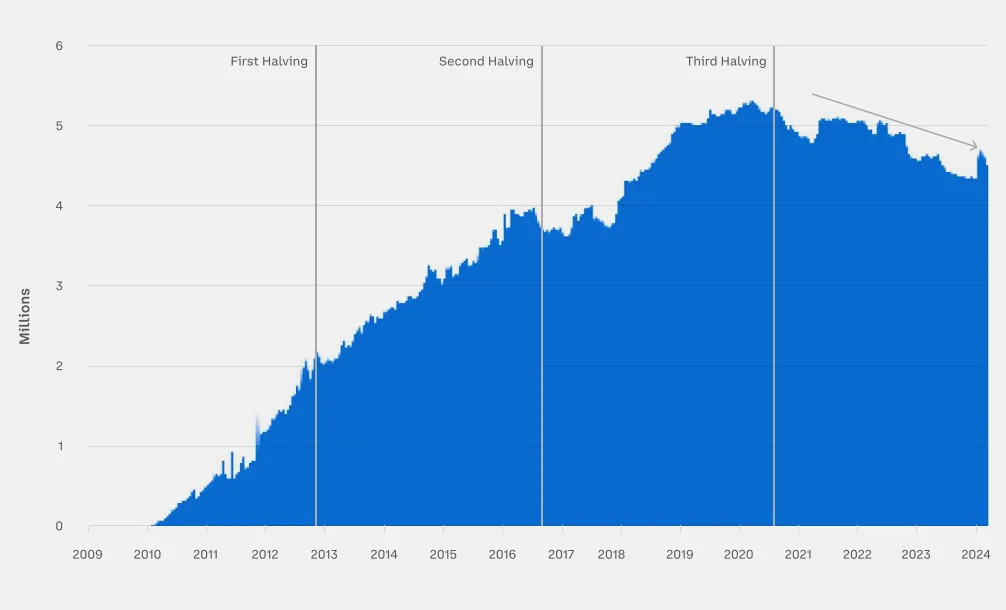
The difference between a token’s current circulating supply and its illiquid supply (lost wallets, long-term holdings, locked tokens) determines the quantity of available Bitcoin supply.
After peaking in early 2020, Bitcoin’s available supply has declined to around 4.6 million BTC—a significant shift before the fourth halving, contrasting with the steady rise in available supply observed during the previous three halving periods.
6. Bull Market Cycle Performance
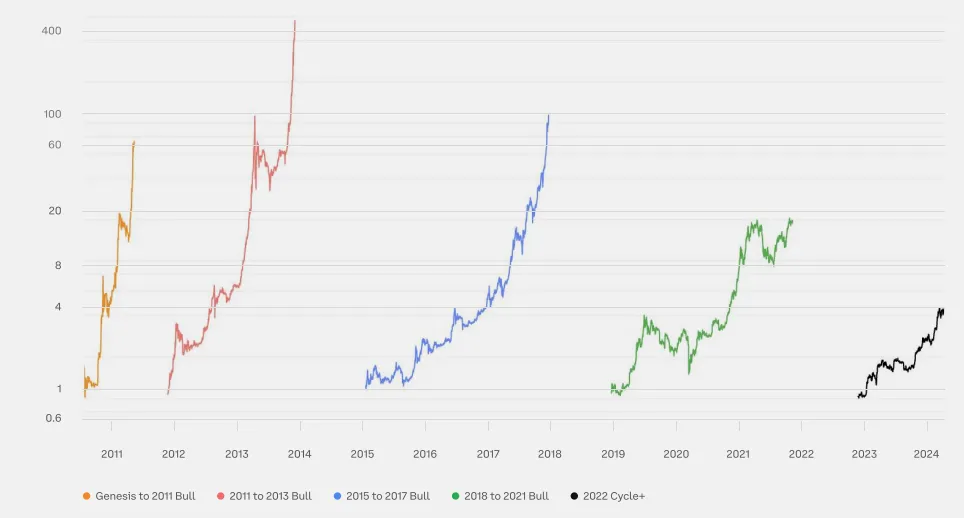
Bitcoin has historically exhibited exponential growth during bull markets, with prices surging multiples above their lows. The current bull cycle began in November 2022, and prices have already reached four times the low. As shown in the chart, the previous two bull markets (2015–2017 and 2018–2021) saw price increases of 100x and 20x respectively.
7. Bitcoin Price Performance Since Lows
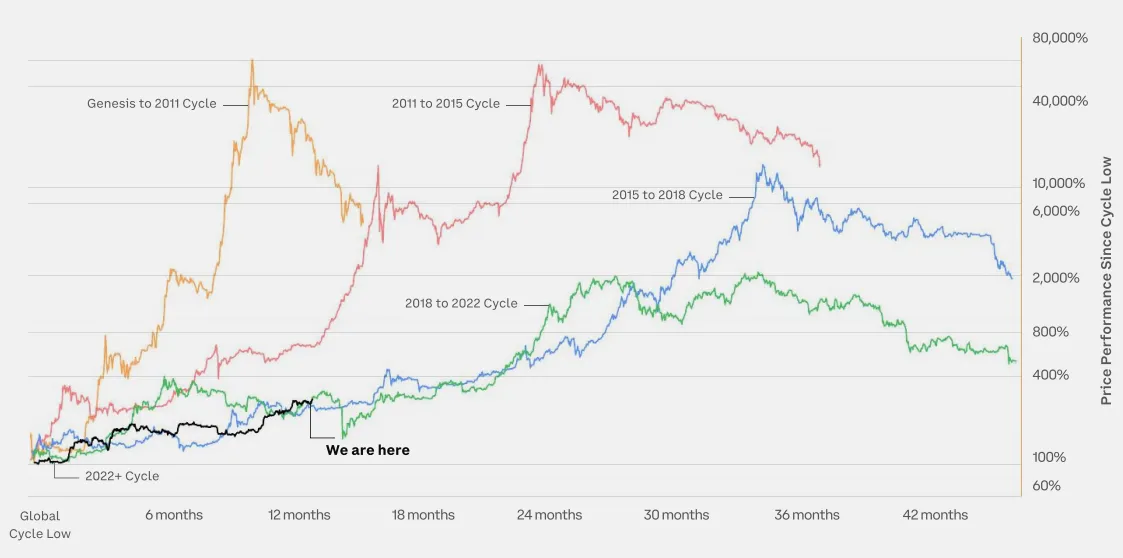
Bitcoin has completed four cycles, each including both bull and bear phases. This chart compares the current market cycle starting in 2022 with prior cycles. In this cycle, Bitcoin has risen over 400% within 17 months since its low. The current cycle most closely resembles the 2018–2022 cycle, where Bitcoin rose 1000% within 24 months after the low.
8. Ethereum Price Performance Since Lows
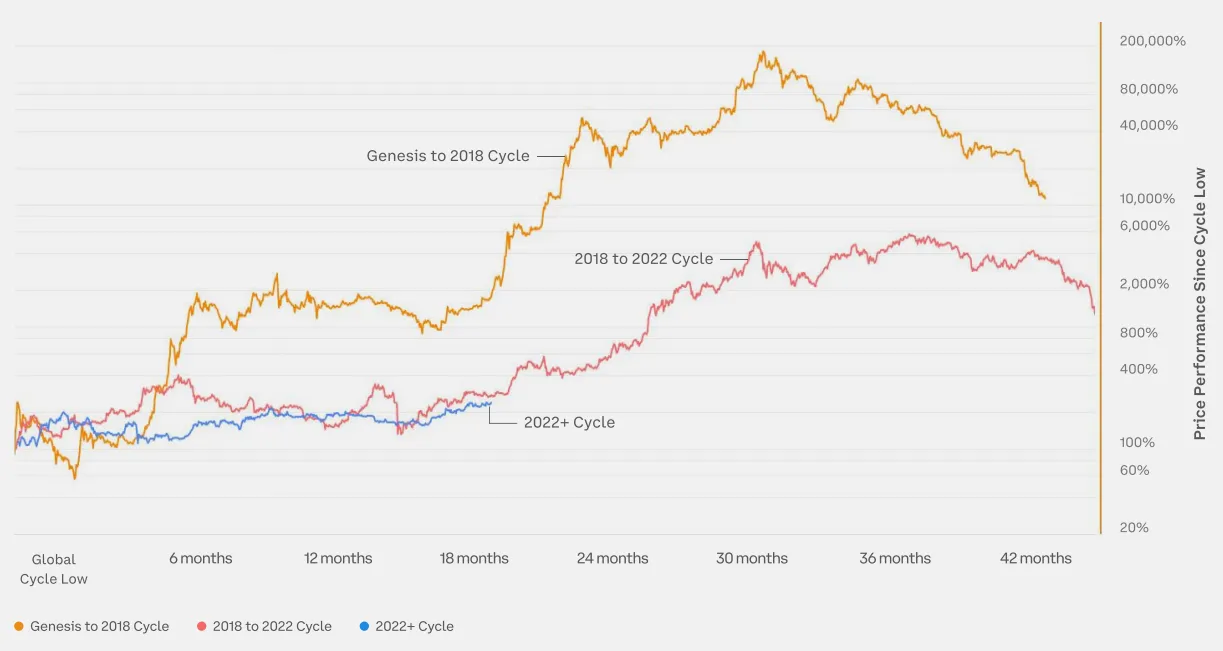
Ethereum has completed two full cycles encompassing bull and bear markets. This chart compares the current market cycle beginning in 2022 with earlier ones. In this cycle, Ethereum has risen over 200% within 17 months since its low. It most closely follows the 2018–2022 cycle, where Ethereum increased 400% within 24 months after the low.
9. Ethereum Supply in Profit
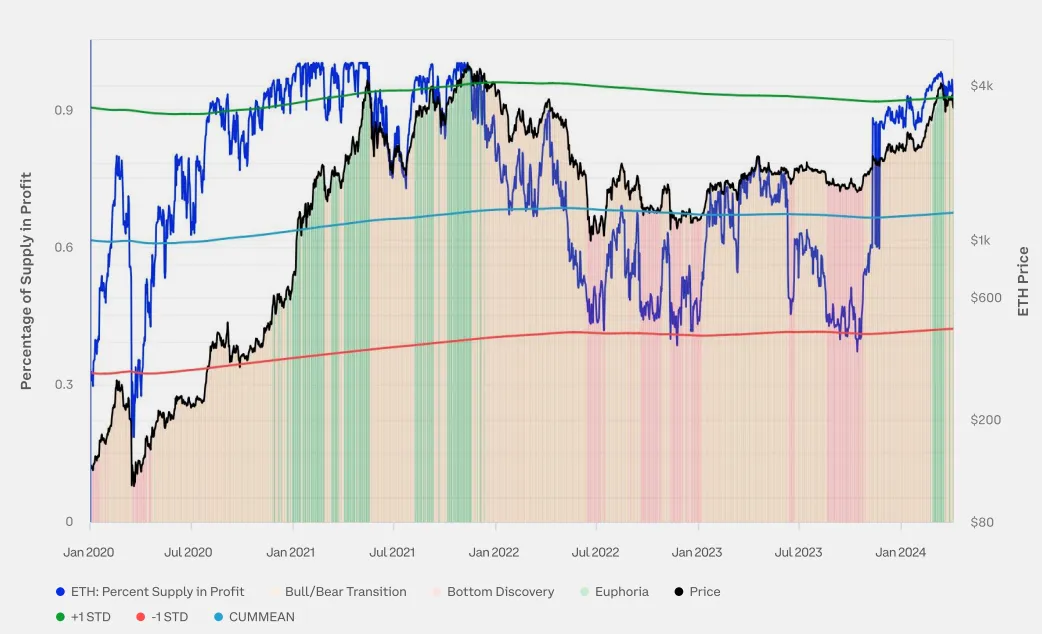
Monitoring supply in profit helps reveal the current position of cryptocurrency prices within the market cycle, as past crypto market cycles have been characterized by three phases:
-
Price bottom: In the final stage of a bear market, prolonged price declines lead to a rising share of loss-making supply (percentage of supply in profit < 55%).
-
Euphoria: During parabolic price surges in a bull market, the majority of supply becomes profitable (percentage of supply in profit > 95%).
-
Bull/Bear transition: A transitional phase between bottoming and euphoria, where supply in profit approaches equilibrium (percentage of supply in profit between 55% and 95%).
10. Ethereum Weekly Active Addresses Up 26%
With rising prices and the successful Dencun upgrade on Ethereum, active addresses grew 26% in the first quarter.
Join TechFlow official community to stay tuned
Telegram:https://t.me/TechFlowDaily
X (Twitter):https://x.com/TechFlowPost
X (Twitter) EN:https://x.com/BlockFlow_News


