A Comprehensive Analysis of DEX MEV: Occurrence, Development, and Breakthrough Innovations
TechFlow Selected TechFlow Selected
A Comprehensive Analysis of DEX MEV: Occurrence, Development, and Breakthrough Innovations
Exploring MEV solutions and development directions through comparing and understanding the characteristics of MEV across different DEXs.
 Navigating Web3 tides with focused insights
Author: xiaoyu, DODO Research
*Special thanks to the EigenPhi team for providing high-quality MEV data, and to EigenPhi researchers Yixin and Sophie for participating in discussions. This data and feedback were crucial to our analysis.
Hidden treasures always lurk within the dark forest. MEV (Maximal Extractable Value) extracts value from users on a first-come, first-served basis. From block congestion caused by priority gas auctions (PGA), to potential vulnerabilities between validators and block builders, concerns have emerged about public issues within the Ethereum ecosystem.
AMMs are the most direct target in the MEV extraction process. Due to the permissionless visibility of the mempool, DEX users inevitably face risks of attacks from MEV bots. At the same time, arbitrage bots play a vital role in improving price discovery efficiency across AMMs and markets.
In this report, we begin with an overview of common MEV types and market scale in DEXs, establishing a broad understanding of DEX MEV development stages. We then zoom in using block explorers to analyze specific MEV cases. By comparing and understanding MEV characteristics across different DEXs, we explore solutions and future directions for MEV.
A Comprehensive View — The Full Landscape of DEX MEV
DEX MEV primarily falls into three categories: sandwich attacks, arbitrage, and liquidations. According to EigenPhi data, over the past 30 days, arbitrage MEV on Ethereum generated $1.64M, sandwich attacks generated $1.74M, and liquidation MEV reached $21.01K. Clearly, arbitrage and sandwich attacks dominate DEX MEV profits, accounting for 99.38%, making them the focus of this report.
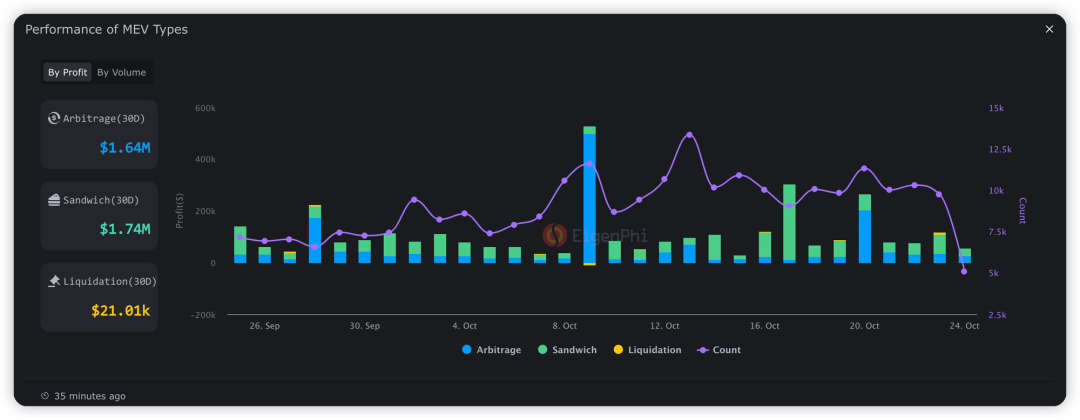
Performance of liquidation, sandwich attack, and arbitrage MEV over the past 30 days. Source: EigenPhi
Before proceeding, here is a brief explanation of how these three types of MEV attacks work:
-
Sandwich Attack: The attacker monitors unconfirmed transactions and bribes miners to insert their own transactions before and after the target transaction, manipulating its execution price to profit.
-
Arbitrage: In a DEX environment, arbitrage typically exploits price differences across trading platforms. Due to decentralization, price updates may lag. Arbitrageurs buy low on one platform and sell high on another to capture profit.
-
Liquidation: When a borrower’s collateral value drops below a predefined threshold, a liquidation event is triggered. Anyone can execute the liquidation, repaying creditors immediately. Liquidation bots insert a transaction right after the trigger to claim fees.
From the data, it's clear that liquidation MEV does not occur frequently. Large-scale liquidations usually happen during extreme market movements—understandable given the mechanics. For example, when BTC surged by 10 percentage points on October 23rd and 24th, liquidation MEV volume spiked to $561K that day, significantly higher than usual.
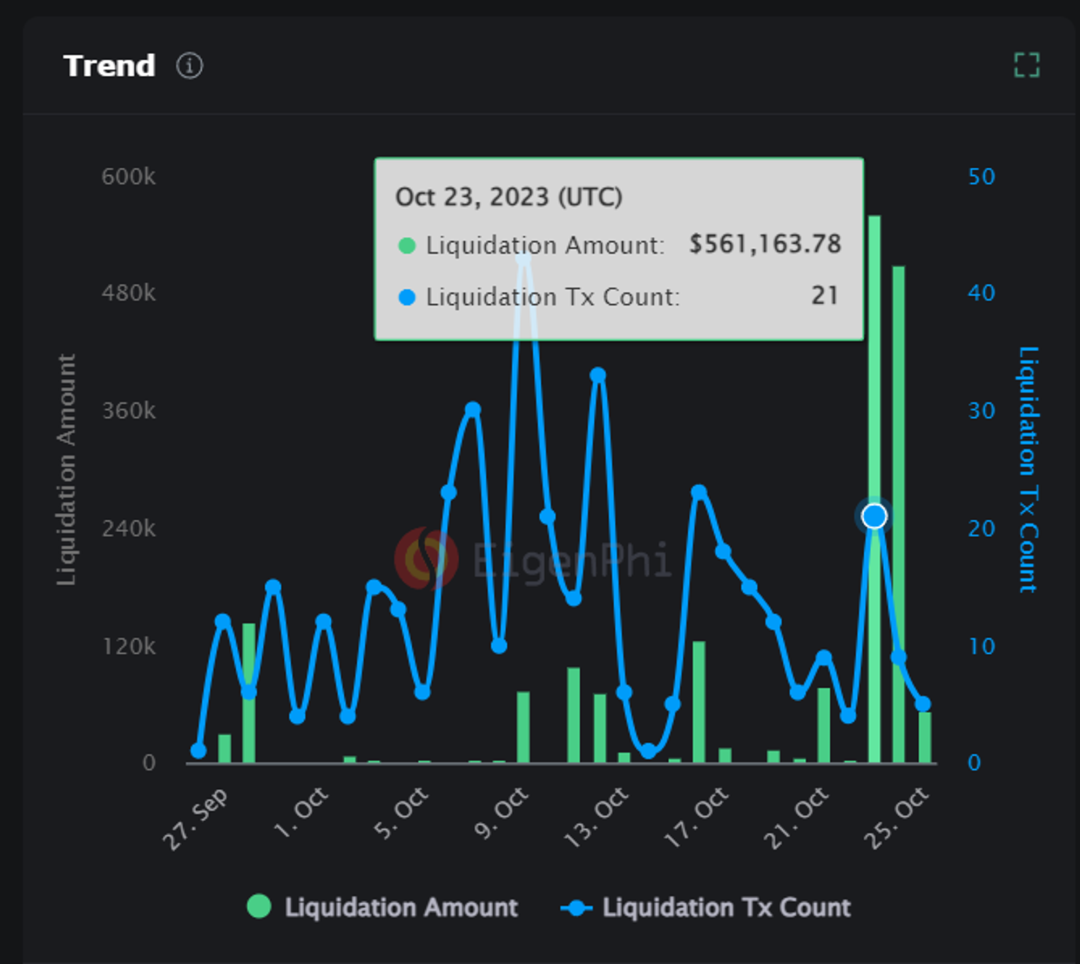
Scale and volume of liquidation MEV. Source: EigenPhi
The majority of sandwich attacks occur on top-tier DEXs, particularly Uniswap, which accounts for about three-quarters of the market share. Aggregators follow closely behind: 1inch v5: Aggregation and 0x: Exchange split the remaining MEV volume almost equally, together capturing 10% of total MEV. Metamask: Swap Router accounts for 4.8%.
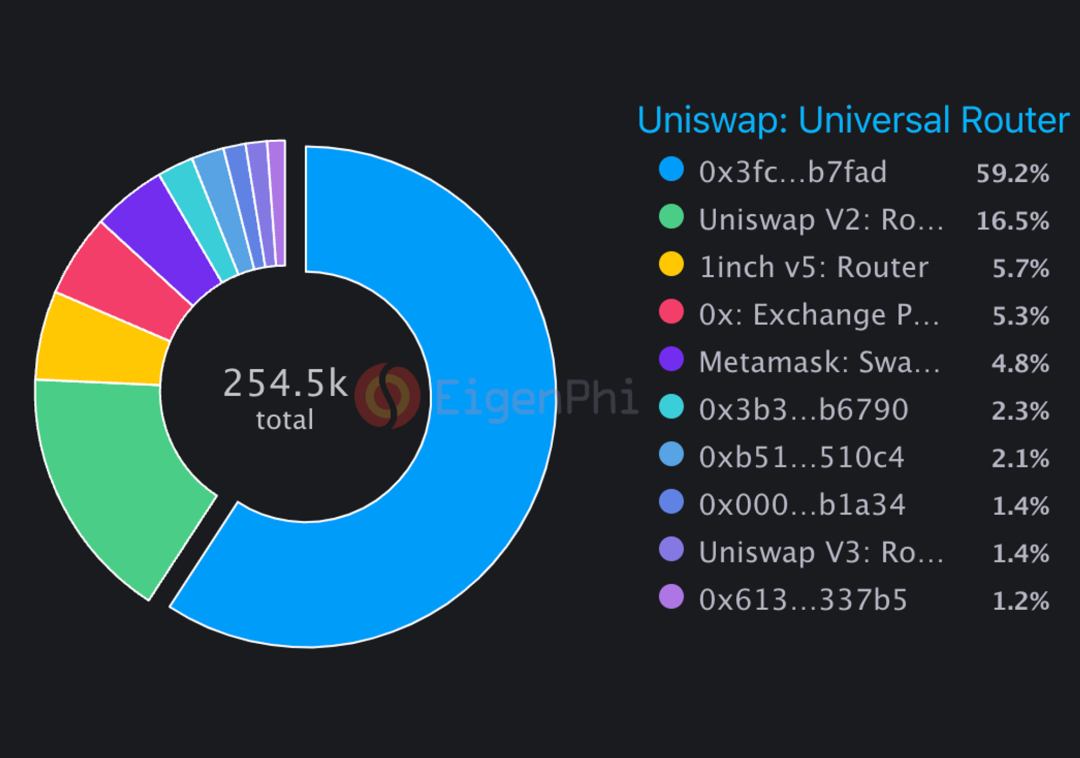
Distribution of sandwich attacks across routing paths. Source: EigenPhi
82.18% of individual profits fall between $0–$10, 6.84% between $10–$100, and 9.28% result in losses between $10–$100.
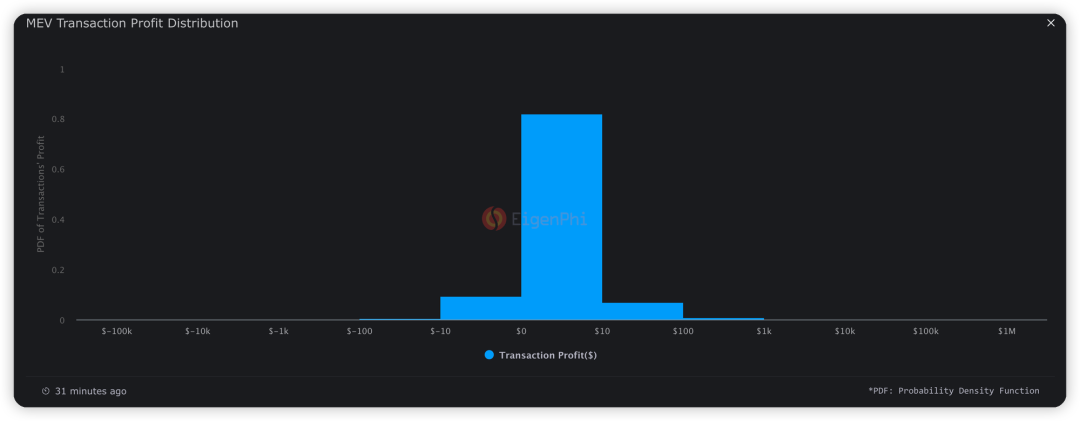
MEV profit distribution. Source: EigenPhi
Microscopic Insight — Observing MEV Through Block Explorers
To understand the MEV process and how MEV bots calculate profits, we selected a recent sandwich attack example from EigenPhi’s website to illustrate the full lifecycle of an MEV attack. This attack occurred at 21:00:35 on October 23, 2023. The attacker spent $634.93, earned $6,167.48, and made a net profit of $5,532.55.
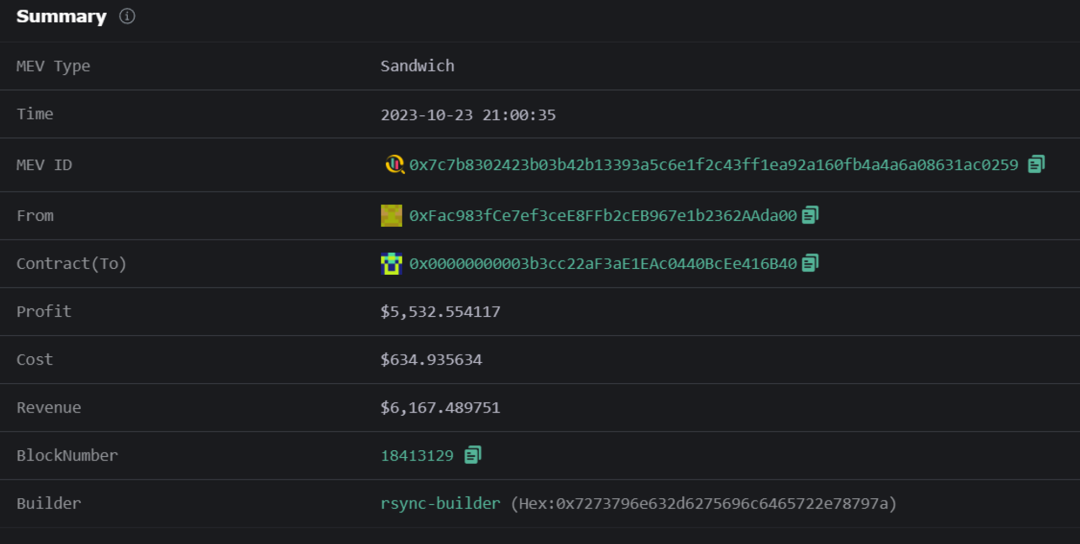
Example interpretation of an MEV attack. Source: EigenPhi
The entire sandwich attack consists of three steps: Front-run, Victim, Back-run. These three transactions are tightly packed together in block 18413129. To better explain each step, we used Etherscan’s Tag feature to label addresses: the “from” address of the victim transaction is labeled as "Victim", interacting addresses in front-run and back-run are labeled as "Attacker", while other labels come from network data.
Front-run: Buying Before You Do!
In the front-run phase, the attacker first transfers 304.03 WETH to Attacker 2, swaps it for 304.027 stETH via the Lido Curve pool with minimal slippage, then swaps the stETH for 259.59 WETH in the Uniswap V2: stETH 2 pool, causing liquidity imbalance. (The Lido pool holds 56,000 ETH paired with stETH.)
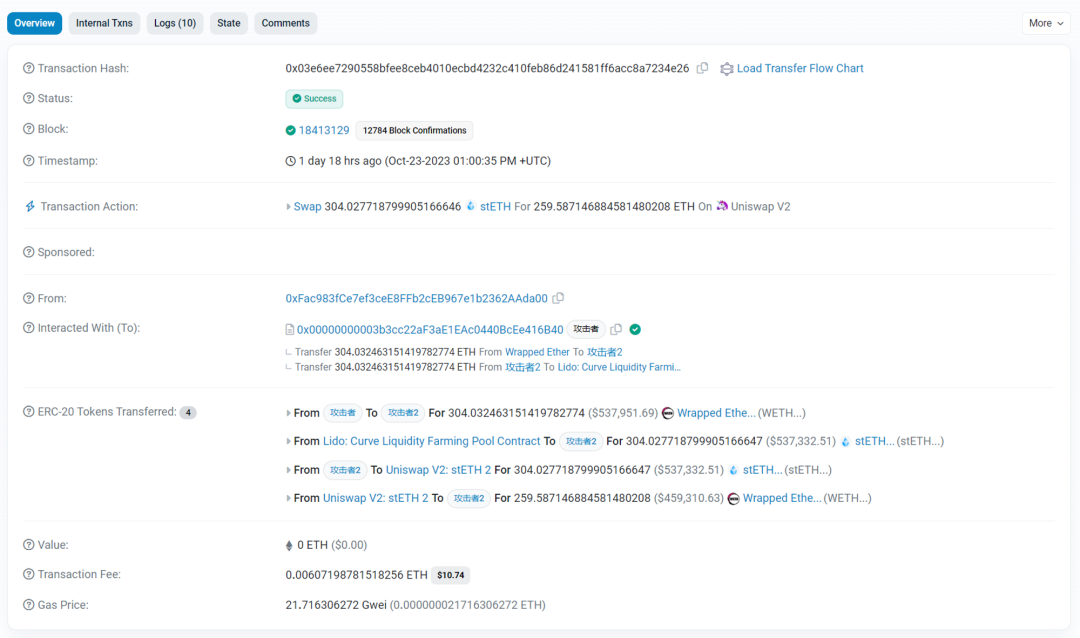
Front-run Transaction. Source: Etherscan
Victim: You Just Bought Overpriced Assets
Shortly after, the victim attempts to swap 20.37 stETH for 14.81 WETH through the same Uniswap V2 pool. However, due to the attacker’s large pre-swap shifting the AMM curve, the average price of WETH/stETH is artificially inflated. As a result, the victim suffers significant slippage—an MEV attack has occurred.
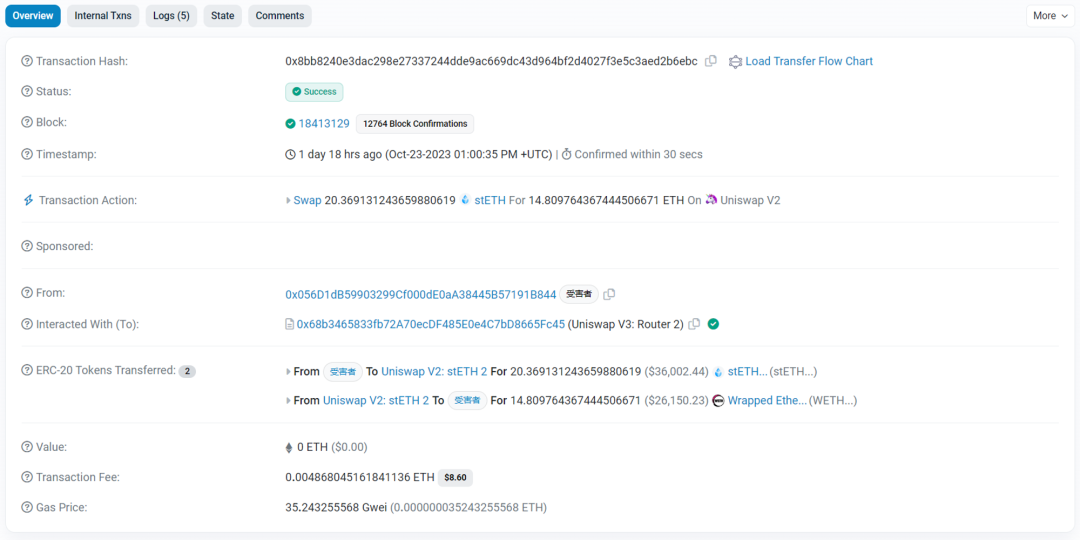
Victim Transaction. Source: Etherscan
Back-run: They Ran Away With the Money😭
Back-run: Subsequently, Attacker 2 swaps 259.59 WETH back into stETH, receiving 307.76 stETH (note: 3.76 more than initially). Finally, Attacker 2 uses the Lido Curve pool to convert stETH back into WETH with minimal slippage and sends it back to the original attacker—completing the profit cycle.
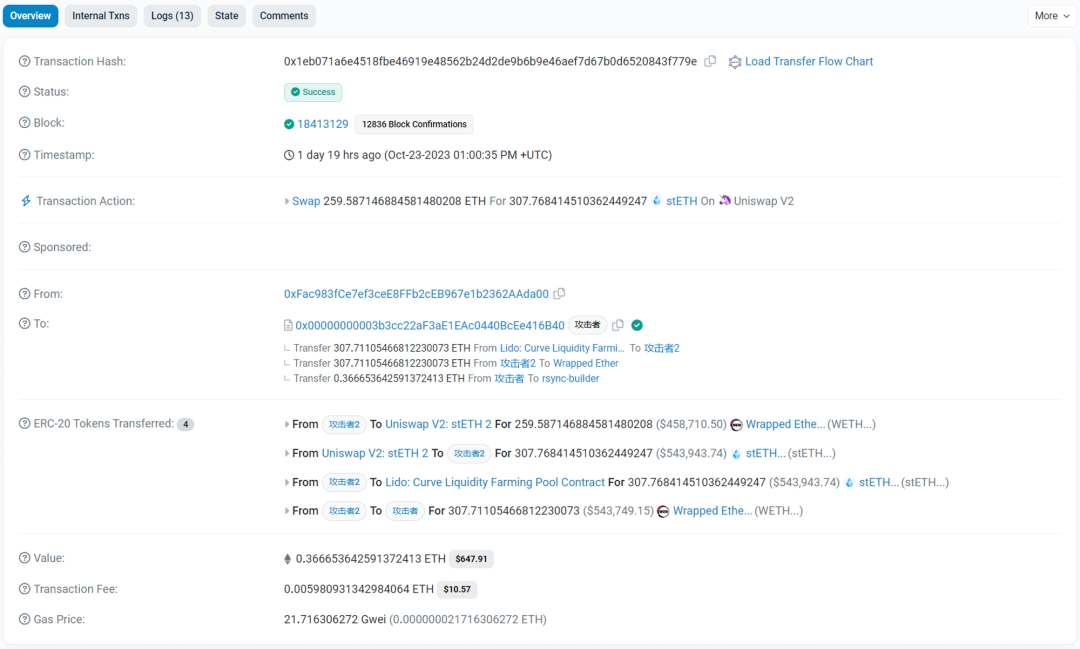
Back-run Transaction. Source: Etherscan
Settlement Summary
Total cost includes two gas payments plus a bribe of 0.3667 ETH to the miner. Revenue is 3.76 WETH, yielding a net profit of $5,532.55. On Curve, the quoted rate for the victim’s 20.3691 stETH was 20.359 WETH. Yet the victim only received 14.81 WETH—indicating a staggering 37.5% slippage.
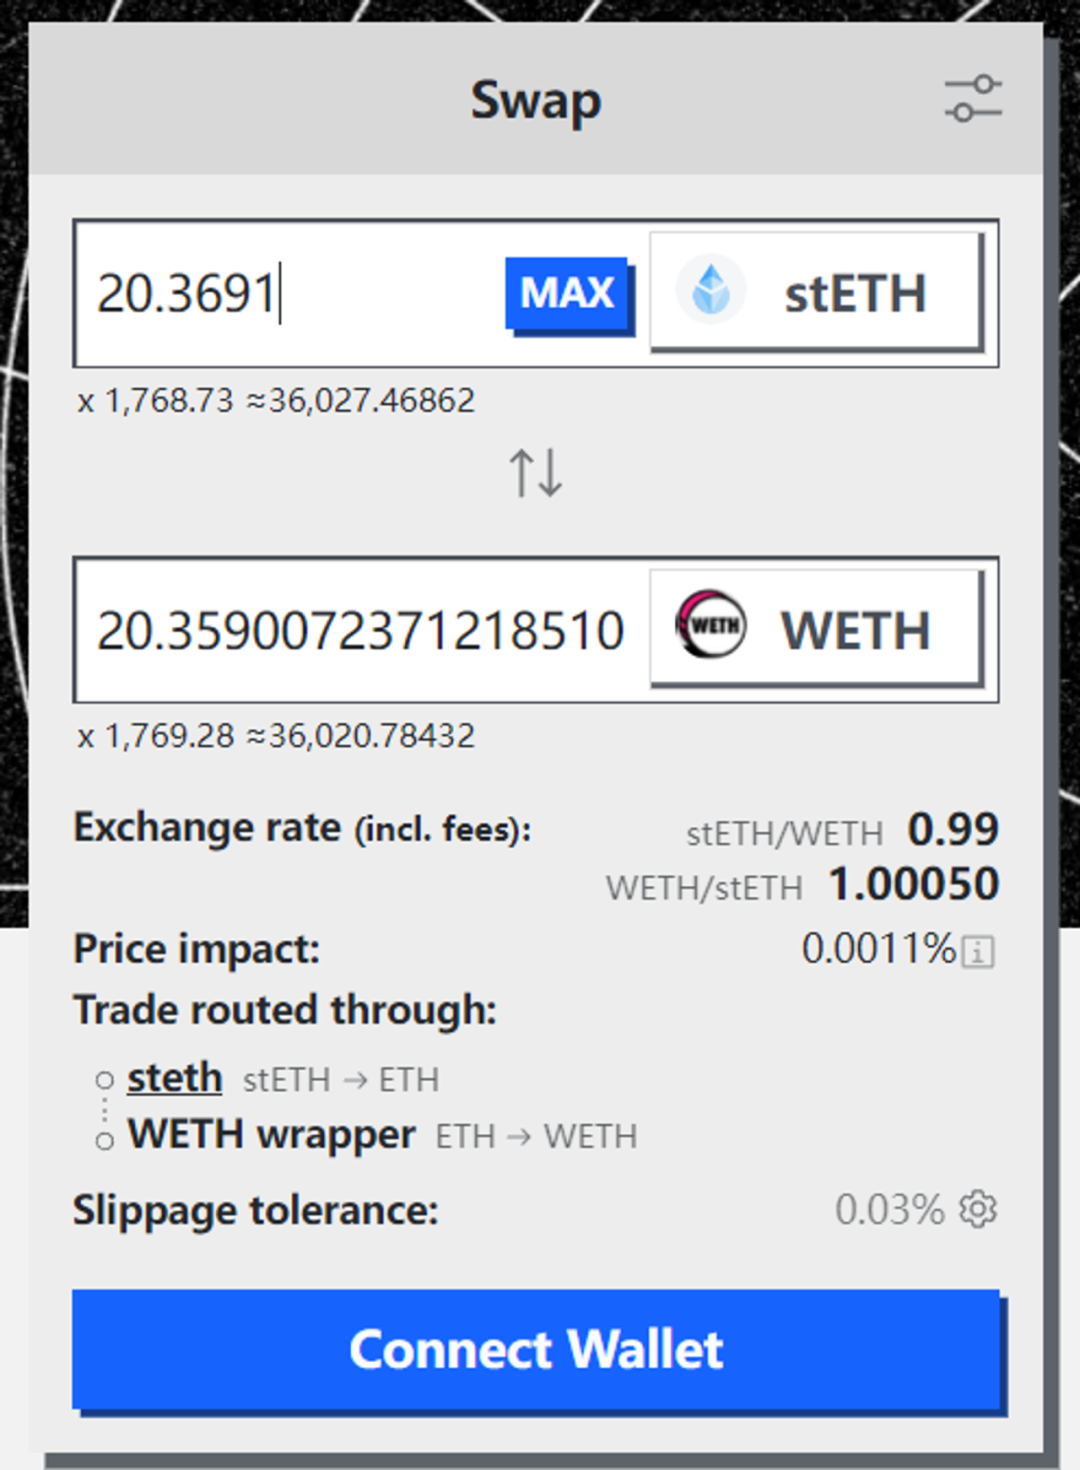
Quote for 20.3691 stETH on Curve UI. Source: Curve
Note: The term 'attacker' refers to the MEV bot; the actual beneficiary is the interacting address (the ‘from’ address 0xFac…da00).
Eigentx visualizes the above process using Token Flow diagrams, offering intuitive replay and review. Below are the Token Flows for Front-run, Victim, and Back-run respectively, with numbers indicating sequence for reader reference.
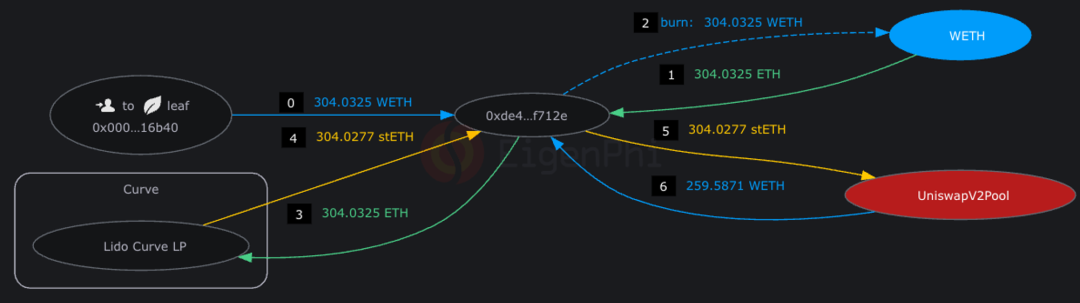

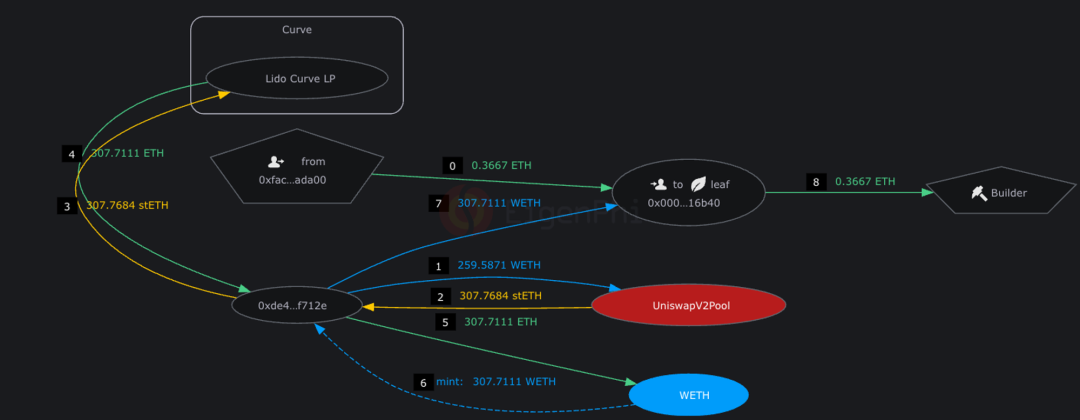
Token Flow visualization of sample MEV attack. Source: Eigentx
From this transaction, we can summarize the necessary conditions for MEV profitability:
-
First, a large swap must shift the AMM curve and liquidity balance
-
Transaction ordering must sandwich the victim’s swap between front-run and back-run
-
Ensure the victim’s swap stays within acceptable slippage bounds (otherwise the transaction fails)
In the first step, attackers often use flash loans to obtain large initial capital. Flash loans are unique to blockchain: as long as repayment occurs within the same transaction, substantial funds can be borrowed without any upfront capital. The second step requires bundling capabilities and rapid global broadcast of transactions, along with ETH bribes to miners to prioritize inclusion in blocks. MEV attackers also require precise calculations to ensure victims’ swaps do not exceed slippage limits, while optimizing bribe amounts to maximize profits and avoid being frontrun by competing MEV bots.
Detailed Analysis — MEV Across Different DEXs
We now analyze leading DEXs by trading volume on Ethereum: DODO, Uniswap, Curve, and PancakeSwap. Key metrics include TVL, trading volume, fee rates, and slippage. Using EigenPhi data, we start with Uniswap—the dominant DEX holding nearly 50% market share—to identify “universal patterns” of DEX MEV. Uniswap’s massive trading volume provides abundant samples for observation and serves as a useful benchmark due to its numerous forks. Then, by comparing MEV characteristics across other DEXs, we aim to uncover root causes and deepen our understanding of DEX MEV dynamics.
1. Uniswap – Typical MEV Bots' Activities
As the top DEX on Ethereum with nearly half the market share, Uniswap sees the highest number and volume of MEV transactions. Studying MEV on Uniswap allows us to derive several general insights:
-
Arbitrage bots, sandwich bots, and LPs do not have conflicting interests;
-
Frequency and profitability of arbitrage and sandwich attacks correlate with market volatility;
-
Pools with higher trading volumes are more susceptible to value extraction by sandwich bots;
-
Spatial arbitrage involving two venues is most common, though some single trades involve over 100 venues;
-
Profitability positively correlates with sandwich bot activity levels.
1.1 Arbitrage and Sandwich Bots vs. LPs – No Conflict of Interest
First, let's compare revenue scales between MEV bots and LPs. In its report “MEV's Impact on Uniswap,” EigenPhi analyzed income from V3 LPs versus arbitrage, sandwich, and JIT bots from January 1 to October 31, 2022, shown below. In terms of revenue size, the three types of MEV bots collectively earned over 25% more than LPs—amounting to $540 million. This suggests MEV bots may be competing with LPs, attempting to capture profits that would otherwise go to LPs from traders.
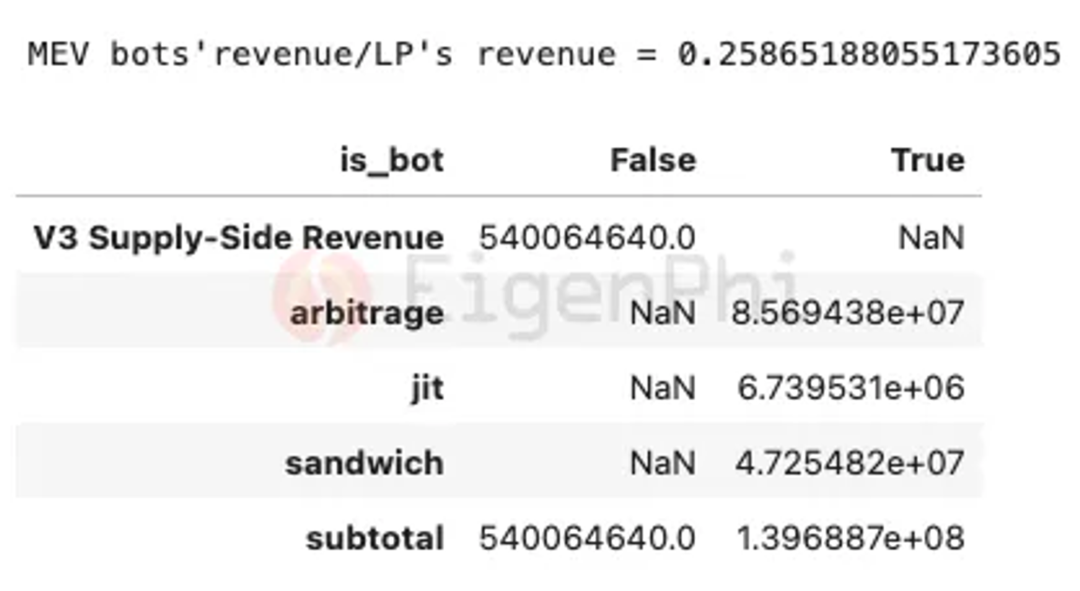
Profits from arbitrage, JIT, and sandwich attacks alongside LP fee income. Source: EigenPhi
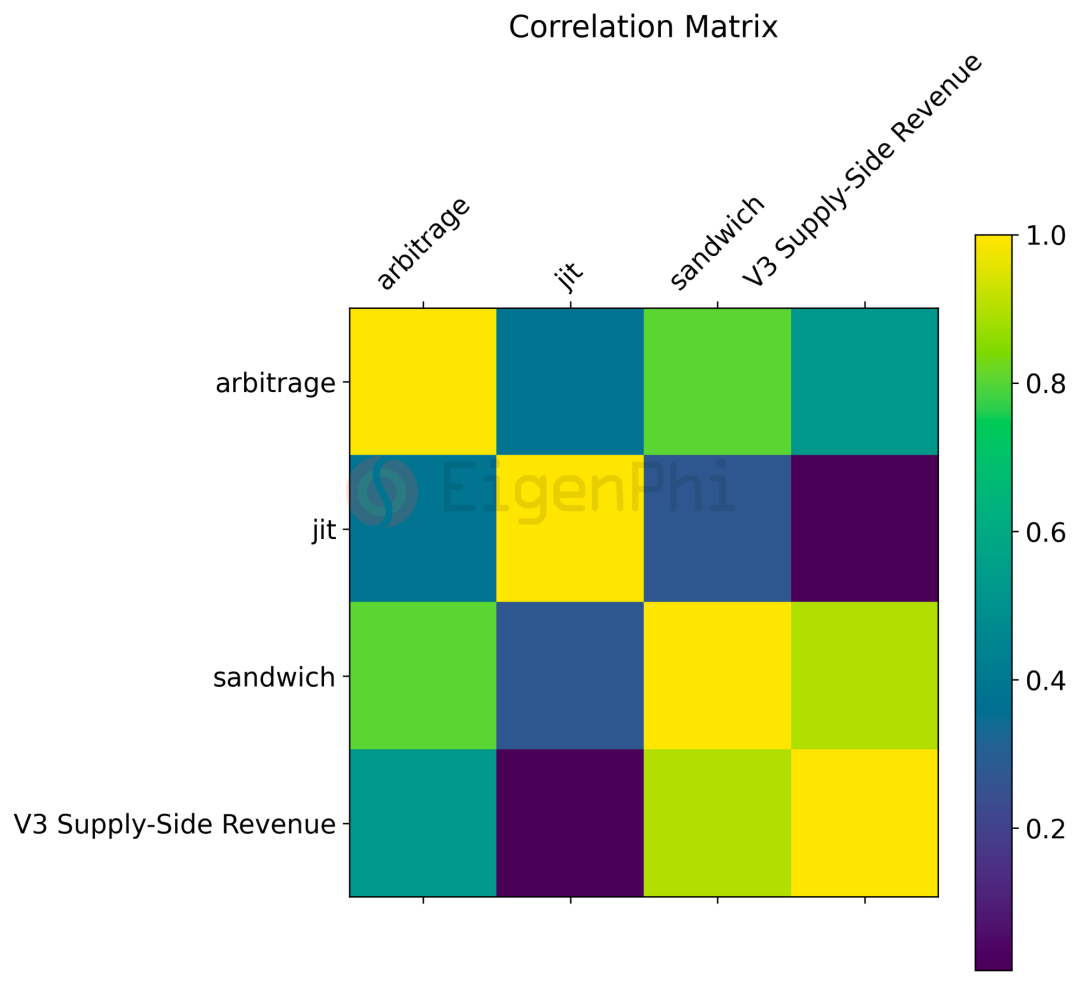
However, according to correlation coefficients presented by Messari on Dune, there is no negative correlation between arbitrage/sandwich bots and LP income—indicating no conflict of interest. This might be because sandwich attacks don’t only involve the two assets in a user’s trade pair but often route through major liquidity pools to exchange tokens like stablecoins USDC or DAI into required ETH. Thus, arbitrage and sandwich attacks generate additional trading volume beyond regular user trades, which doesn’t negatively impact LP income—instead, LP earnings likely fluctuate with overall market trends.
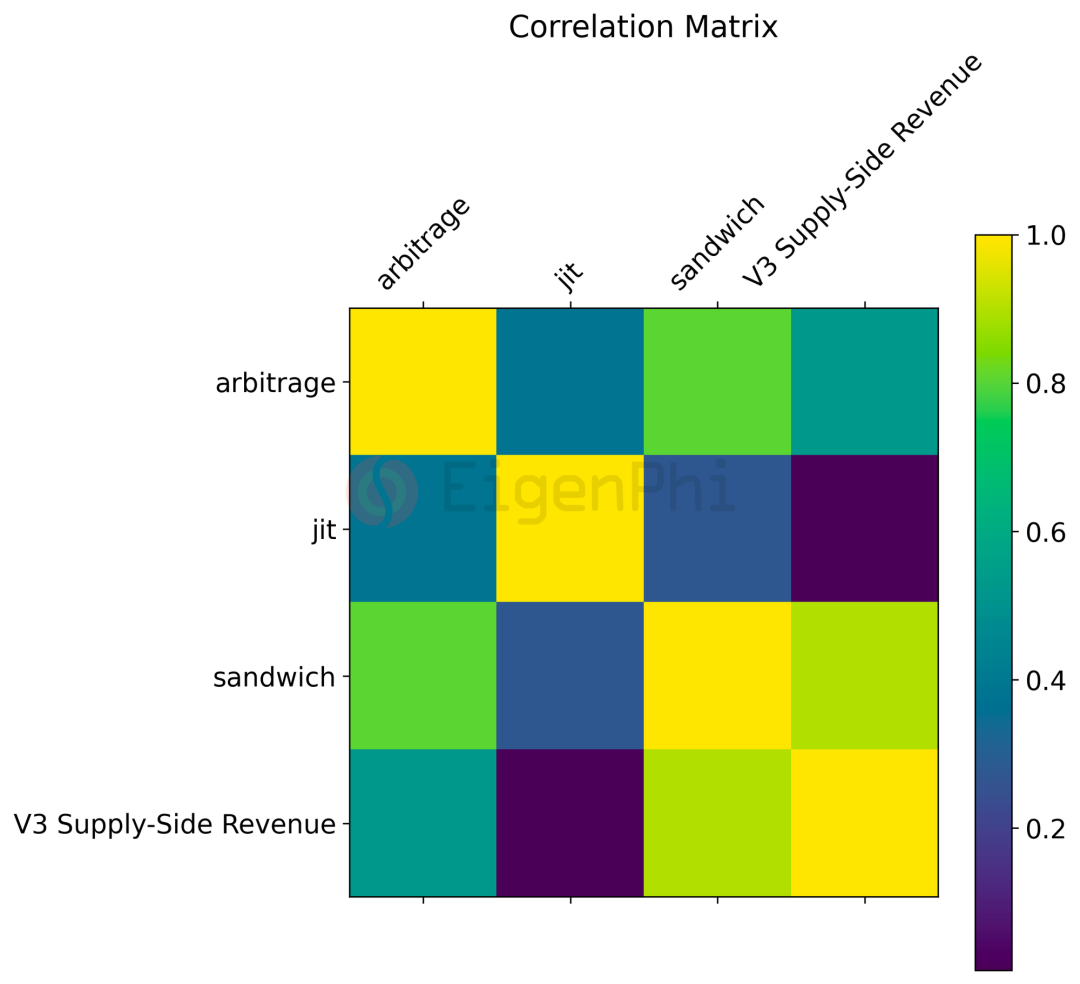
Correlation matrix between profits from arbitrage, JIT, and sandwich attacks and LP fee income. Source: Dune, @messari
1.2 Arbitrage and Sandwich Attacks Correlate with Market Volatility
To investigate factors affecting arbitrage and sandwich bot revenues, we examined their relationship with market volatility. Data from the EigenPhi report shows a clear link between ETH price changes and the frequency of arbitrage and sandwich activities (see chart below). As ETH price volatility increases, so does the combined count of these events—indicating a strong positive correlation.
Relationship between 7-day ETH price change (%) (volatility intensity) and arbitrage/sandwich activity counts. Source: EigenPhi
Several reasons may explain this phenomenon:
-
Market volatility amplifies price inconsistencies: Significant ETH price swings can create temporary price discrepancies across exchanges. Arbitrage bots exploit these gaps, increasing arbitrage activity during volatile periods.
-
Large price swings often coincide with low liquidity: Price volatility is often linked to market liquidity. In less liquid markets, large orders significantly impact prices, creating opportunities for arbitrage and sandwich trades.
-
Volatility stimulates trading activity: Increased ETH volatility heightens traders’ pursuit of potential profits, boosting market activity and enabling sandwich trades.
1.3 High-Volume Pools Are More Vulnerable to Sandwich Attacks
To identify which liquidity pools are more prone to MEV activity, EigenPhi merged Uniswap V3 pool metadata with grouped MEV activity parameters. Results show that among the top 10 trading volume pools, sandwich bots extracted over 80% of total profits—yet these pools accounted for only 20% of sandwich transactions.
This implies that high-volume pools offer richer profit opportunities for sandwich bots. Larger trading volumes mean deeper liquidity and greater capital movement, allowing even limited exploitable slippage to yield substantial returns. That said, smaller pools are not immune to sandwich attacks.
1.4 Other Interesting Observations
Additional insights from EigenPhi’s data help further understand DEX MEV patterns. For instance, analyzing the top 10 arbitrage combinations reveals that spatial arbitrage involving one Uniswap V3 pool and another venue is the most common pattern. The next two common patterns are triangular arbitrage involving one or two Uniswap V3 pools. Some single arbitrage trades may involve over 100 venues.
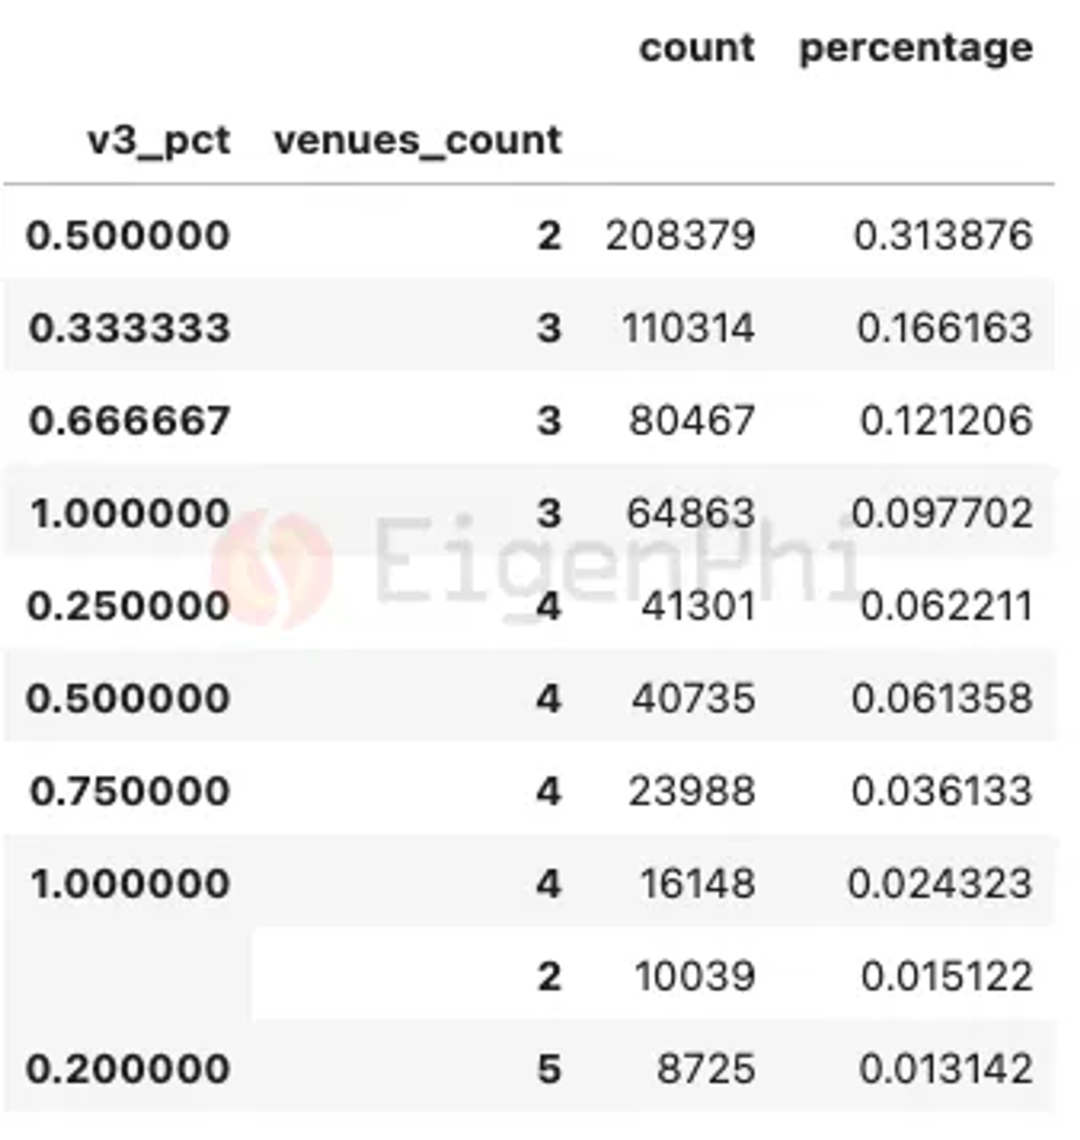
Distribution of number of venues involved in arbitrage patterns. Source: EigenPhi
Additionally, the relationship between total sandwich attack profits and total activity count shows a positive correlation between profitability and activity level. Most profitable bots successfully submitted over 1,000 transactions. (Note: The EigenPhi report mistakenly states '100'.) This means the more “hardworking” the sandwich bot, the higher its income.
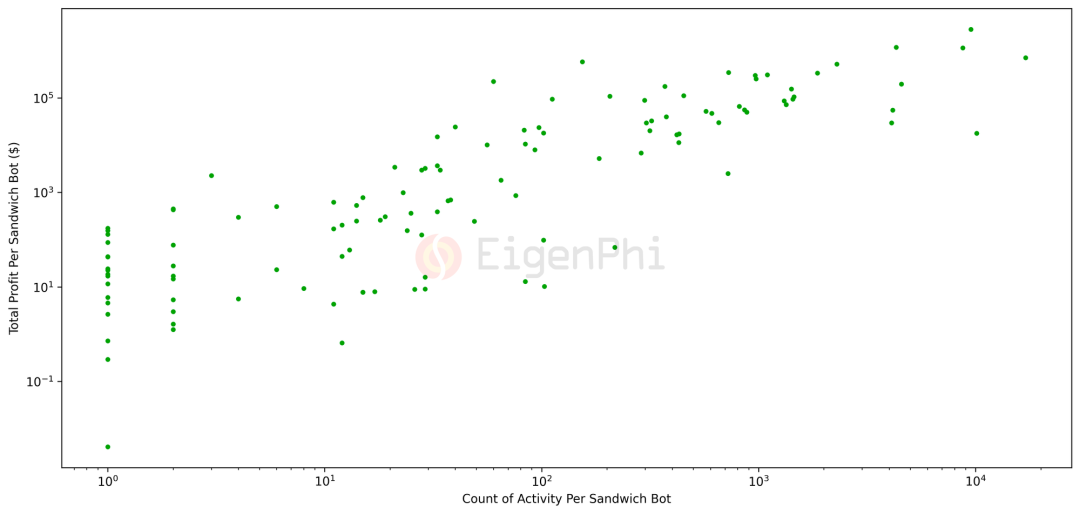
Scatter plot of sandwich bot attack frequency vs. profit. Source: EigenPhi
2. DODO – Where Does High Volume Come From?
DODO focuses on stablecoin trading, and its proactive market-making strategy delivers exceptional depth to stablecoin pools. Despite a market cap of just $42 million, DODO consistently ranks among the top three DEXs by trading volume. Two key characteristics define MEV on DODO:
-
MEV contributes significantly to DODO’s trading volume, accounting for approximately 60% of total volume;
-
Most MEV on DODO originates from 1inch routing.
2.1 MEV Accounts for ~60% of DODO’s Trading Volume
By comparison, Uniswap has a market cap of $41 billion. Thus, DODO achieves 8.6% of Uniswap’s trading volume with only 1% of its market cap. The reason lies in MEV exploiting DODO’s liquidity.
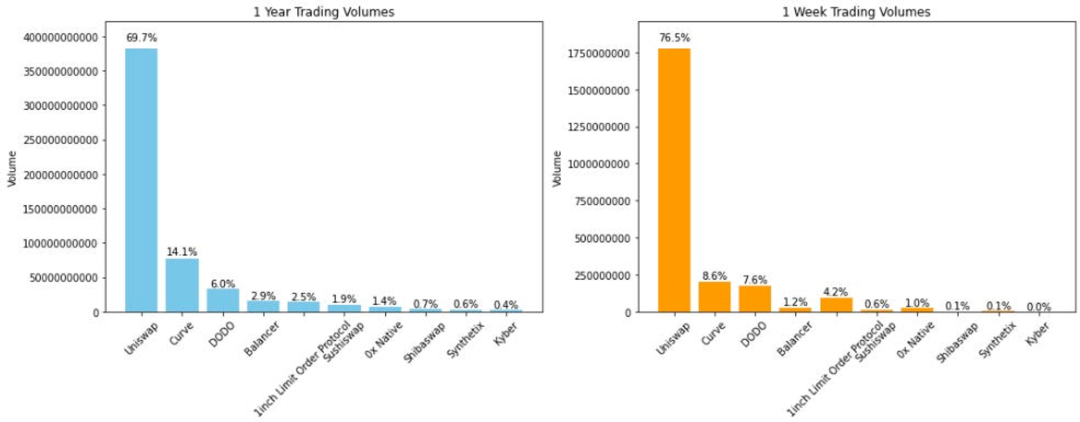
Trading volume distribution of top DEXs over the past year and week. Source: EigenPhi
Dune data shows DODO’s primary trading pairs on Ethereum are stablecoins. From our earlier universal insight—that high-volume pools are more vulnerable to sandwich attacks—we see alignment with DODO’s data: stablecoin pools are the main sites of MEV activity. According to EigenPhi’s report “DODO: Where Does High Volume Come From?”, DODO experienced 1,322 sandwiched transactions: 55.99% involving USDC-USDT, 44.01% DAI-USDT.
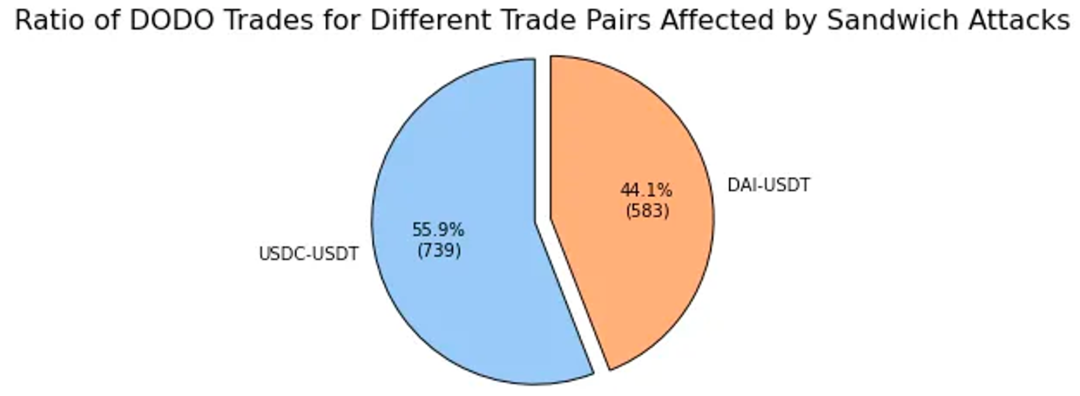
Pie chart showing affected trading pairs in sandwich attacks. Source: EigenPhi
Looking at trading volume distribution for these stablecoin pairs, around 60% comes from sandwich transactions. Although victim volume accounts for only about 2%, the preparatory front-run and back-run swaps contribute 60% of the volume for USDC-USDT and DAI-USDT pairs—because large swaps are needed to shift liquidity.
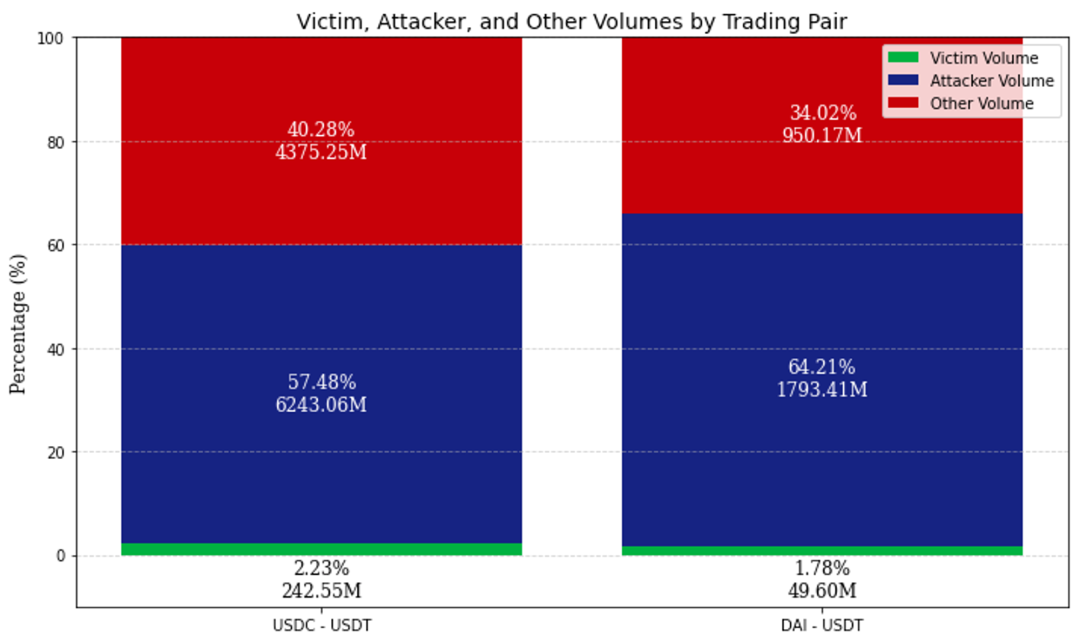
Volume distribution in USDC-USDT and DAI-USDT pairs. Source: EigenPhi
2.2 Most MEV on DODO Comes from 1inch Routing
DODO’s frontend typically includes slippage protection—transactions exceeding slippage thresholds fail. Stablecoin pairs default to 0.01% slippage tolerance. So why does such high MEV volume still occur?
According to EigenPhi data, over half of transactions from addresses attacked more than 20 times interacted with 1inch aggregator routing, as shown below. 1inch, as an aggregator, doesn’t provide liquidity directly but routes orders to other DEXs’ liquidity. Its Fusion mode offers three options:
-
Fast Mode: Suitable for users wanting immediate execution, but potentially worse prices;
-
Fair Mode: Users wait briefly for more attractive prices;
-
Auction Mode: Users auction their order, waiting up to ten minutes for the best price.
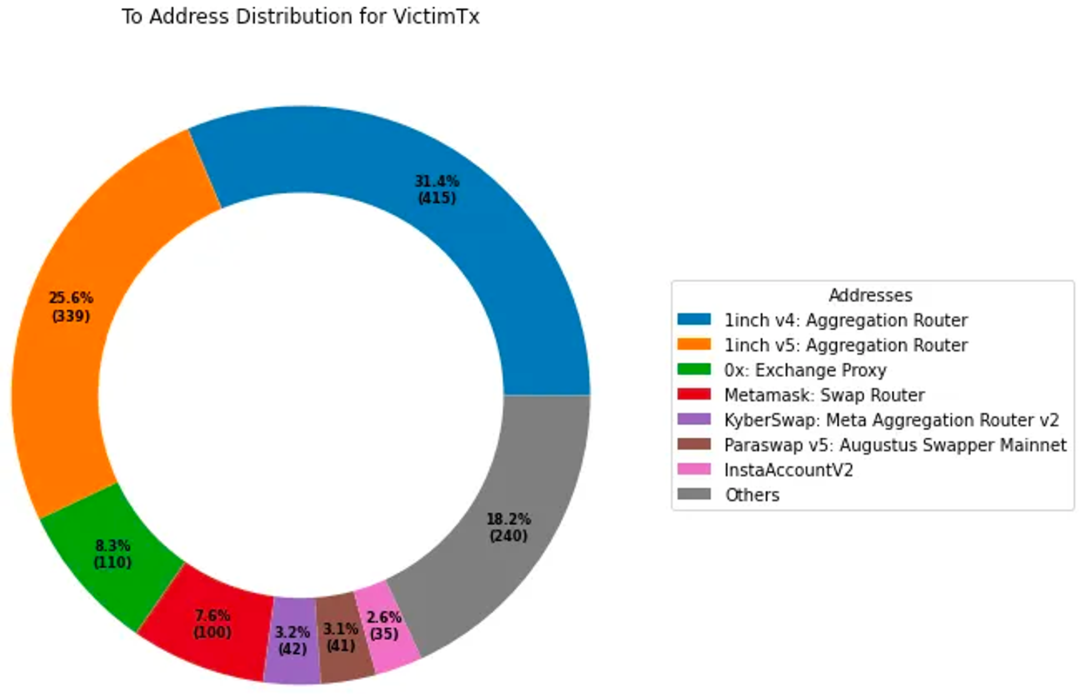
Routing distribution of addresses attacked over 20 times. Source: EigenPhi
In short, 1inch’s Fusion mode may sacrifice higher slippage for faster execution, reducing user wait times. While DODO’s frontend strictly protects users with tight slippage settings—defaulting to 0.01% for stablecoins and 0.5% for major assets like BTC and ETH—orders routed through 1inch bypass this protection, explaining why 1inch-aggregated trades remain vulnerable.
Traditional slippage settings mostly use fixed values—for example, Uniswap defaults to 0.3%. Such static configurations have limitations: excessive reversals frustrate users and cause losses. Conversely, during low-volatility periods, overly generous settings may leave trades exposed to MEV attacks.
DODO’s frontend introduced "dynamic slippage", using time-series models to predict optimal slippage tolerance. This helps users reduce potential losses during swaps while maintaining high success rates. Leveraging the ARIMA model—a proven and robust time-series predictor—dynamic slippage demonstrated 98% accuracy in backtesting.
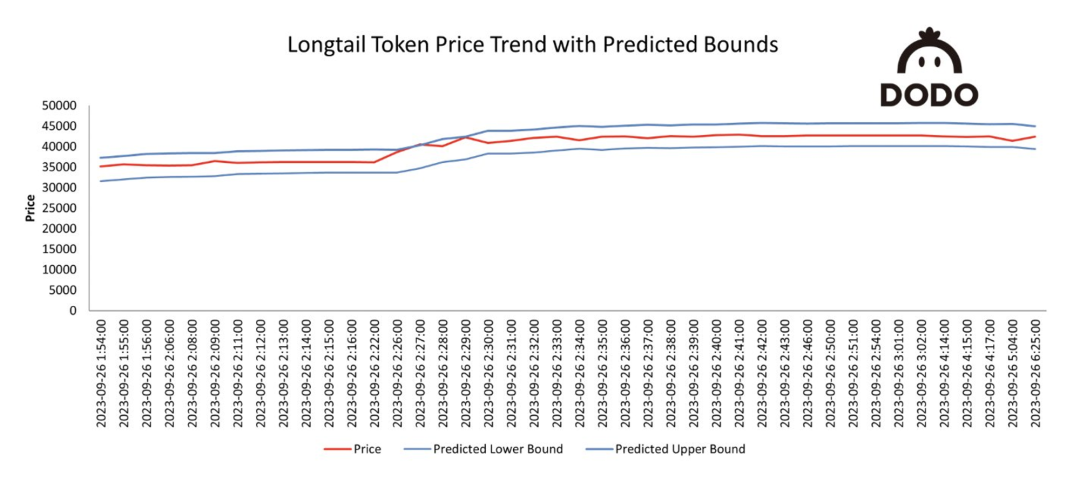
Diagram of “Dynamic Slippage”: Long-tail asset price and predicted bounds. Source: @DODO
3. PancakeSwap – ‘Uniswap’ of BNB Chain
PancakeSwap has long ranked second in trading volume after Uniswap, capturing about 15% market share. On BNB Chain, PancakeSwap is an absolute giant, monopolizing roughly 90% of the market. This aligns with EigenPhi’s MEV statistics: over 90% of total MEV on BNB Chain stems from activities involving PancakeSwap. Notable MEV characteristics on PancakeSwap include:
-
Pancakeswap v3 exhibits significantly lower MEV proportion on BNB Chain;
-
Sandwich attacks on Pancakeswap v3 are extremely rare.
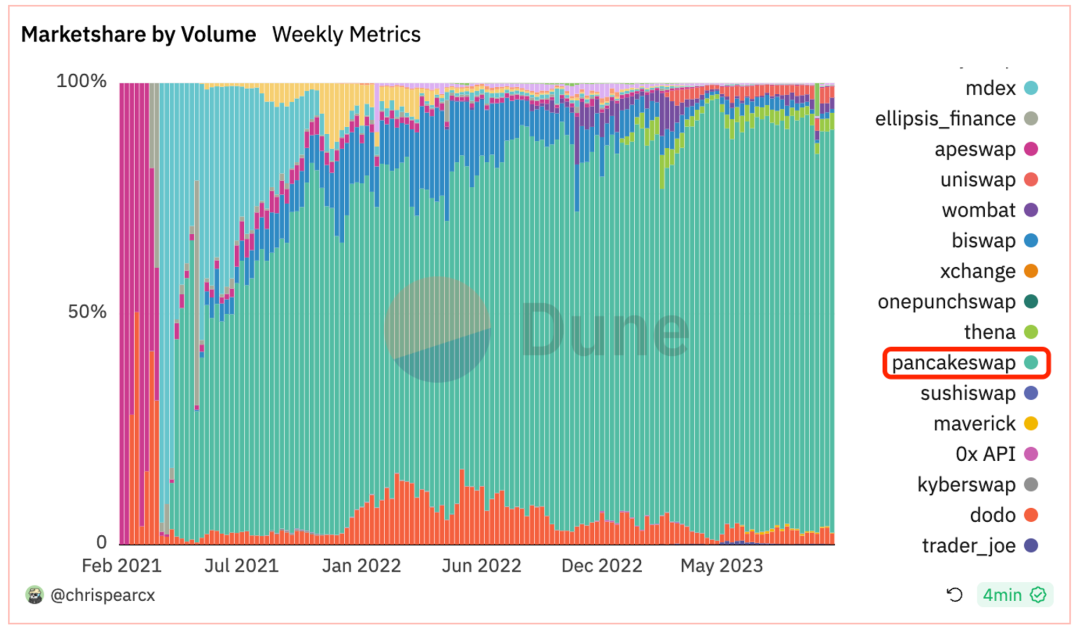
Market share of different protocols on BNB Chain. Source: Dune
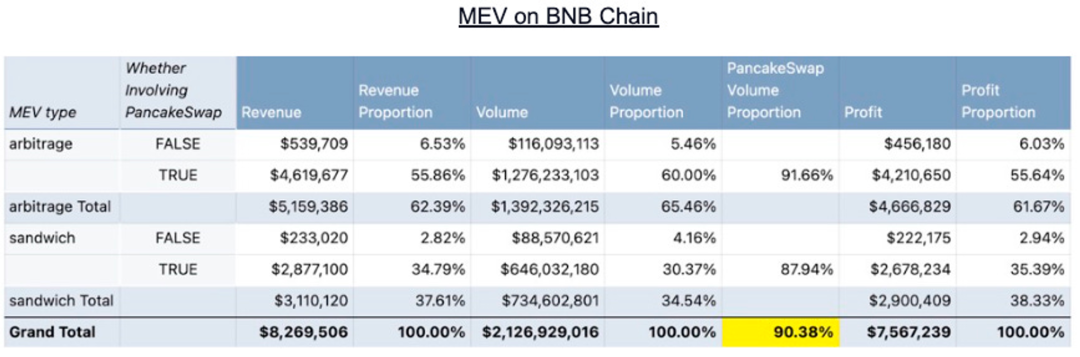
MEV revenue distribution, proportions, and Pancakeswap’s share on BNB Chain. Source: EigenPhi
3.1 Pancakeswap v3 Has Significantly Lower MEV Proportion on BNB Chain
Pancakeswap’s dominance on BNB Chain mirrors Uniswap’s on Ethereum, and their mechanism designs aren’t drastically different. One might naturally expect Pancakeswap v3 on BNB Chain to behave similarly to Uniswap v3 on Ethereum.
Yet, per EigenPhi’s report “PancakeSwap V3's Ascendancy in the MEV Market - A Comprehensive Study,” on BNB Chain, Pancakeswap v3 sees only 7.65% of trades affected by arbitrage and 1.92% by sandwich attacks. In contrast, Uniswap v3 on Ethereum maintains a relatively stable MEV transaction ratio of 50–60%. Two possible explanations exist:
-
Chain Infrastructure. Comparing PancakeSwap V3’s MEV ratios on BNB Chain (9.4%) versus Ethereum (30.3%) reveals fundamentally different MEV ecosystems between the two chains.
-
Protocol Diversity. PancakeSwap dominates BNB Chain, whereas Ethereum hosts a more diverse and rich protocol landscape, offering more MEV opportunities.
-
MEV Intermediaries. On Uniswap, sandwich attacks are a primary MEV source, but they’re rare on PancakeSwap. Services like Flashbots simplify MEV extraction on Ethereum, but such services are immature on BNB Chain.
-
MEV Infrastructure. Ethereum introduced mechanisms like MEV-Boost and MEV-Boost Relay, encouraging wider validator participation. These tools make MEV extraction more efficient. Ethereum has over 820k validators, while BNB Chain has only 29.
-
-
Trading Volume Impact. From Uniswap’s universal insight: MEV activity ratio strongly correlates with high trading volume under similar conditions. Higher-volume trades offer more MEV opportunities and larger profits. Comparing per-transaction volumes across both chains clearly shows ETH-chain transactions average about 10x those on BNB Chain.

Comparison of transaction sizes: PancakeSwapV3 on BNB Chain vs. UniswapV3 on Ethereum. Source: Dune
3.2 Sandwich Attacks on Pancakeswap v3 Are Extremely Rare
EigenPhi’s report also notes that compared to PancakeSwap V2, sandwich attacks on V3 are extremely rare, generating only 2.32% of total sandwich revenue. This difference may stem from V3’s mechanism features:
-
Fee Tier Adjustment: PancakeSwap V3 introduced four fee tiers (0.01%, 0.05%, 0.25%, and 1%), whereas V2 used a flat 0.25% fee. Liquidity providers can choose tiers based on market conditions and risk tolerance. This dynamic variation creates a more complex trading environment where MEV opportunities become unstable, as liquidity and trading patterns may shift over time.
-
Enhanced Smart Routing: By adding split-routing functionality and leveraging all available liquidity within the protocol, the trading engine saw overall improvements. The new smart router intelligently finds optimal routes by utilizing liquidity from PancakeSwap V3, V2, and StableSwap, supporting multi-hop and split routing. By optimizing paths and tapping multiple liquidity sources, PancakeSwap V3 may reduce the profitability of individual trades. Executing trades across multiple pools makes potential MEV opportunities more complex and harder to exploit. The smart router also leverages integrated market makers to deliver best execution. Users can enable or disable certain liquidity sources, offering greater flexibility and helping avoid potential frontrunning or backrunning in specific pools.
4. Curve – Haven of Arbitrage for the Clever
Launched in 2020 and known for StableSwap, Curve’s unique pricing curve differs from the constant product formula, resulting in lower slippage for stablecoin AMM markets. Curve boasts a robust ecosystem allowing users to exchange stablecoins with other DEX protocols at lower fees and slippage. Curve’s core offerings include:
-
Stablecoin Swaps: Classic liquidity pools include 3pool, LUSD/3Crv, etc.;
-
Stable Pegged Assets: e.g., Curve supports PoS and synthetic assets like stETH, frxETH;
-
Unstable Pegged Assets: After Curve V2, users can trade BTC, ETH, and USDC in Curve’s Tricrypto pools.
These features give rise to unique MEV behaviors on Curve:
-
Sandwich and arbitrage bot revenues account for 73% of Curve pool income, with highly active arbitrage;
-
80% of MEV bot profits are captured by 20% of bots;
-
Arbitrage opportunities correlate with market volatility intensity, whereas sandwich attacks do not.
4.1 Sandwich and Arbitrage Bot Revenues Account for 73% of Curve Pool Income, With Active Arbitrage
Curve’s 3Pool, also known as Tri-Pool, provides deep liquidity (~$3.4B) for DeFi’s top three stablecoins. Compared to other DEXs like Uniswap or SushiSwap, this depth and Curve’s optimization typically offer the most capital-efficient path for swapping USDT, USDC, and DAI—highly beneficial for arbitrageurs and traders. According to EigenPhi data, sandwich and arbitrage bot revenues account for 73% of total Curve pool income. Compared to Uniswap’s 25%, MEV activity on Curve is exceptionally intense.
Moreover, Curve hosts numerous pegged asset pools, which often present significant arbitrage opportunities. EigenPhi tracked daily revenues of arbitrage and sandwich bots, as shown below. On June 13, 2022, when stETH depegged, arbitrage bots generated substantial profits.
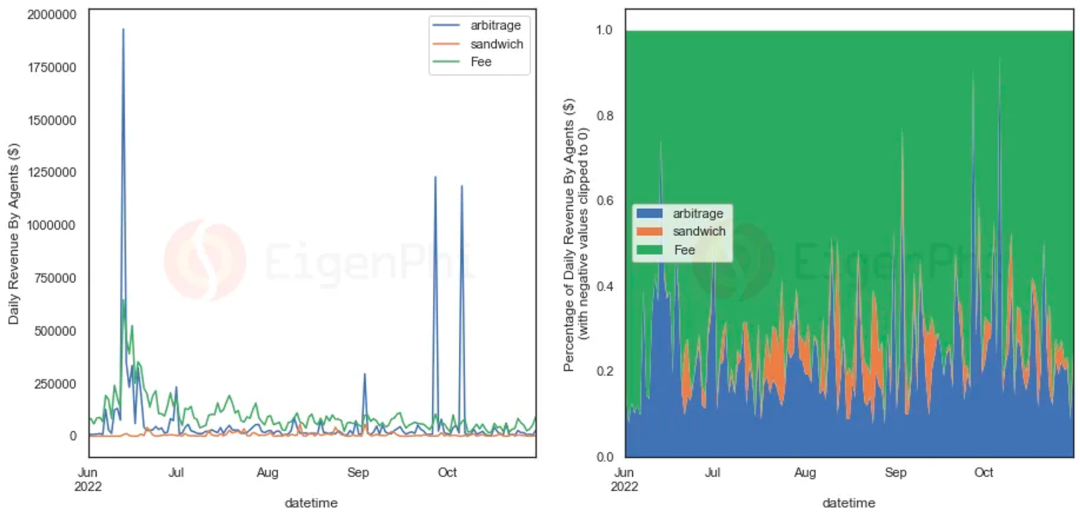
Line chart showing sandwich attacks, arbitrage income, and fee income on Curve over time, with proportions. Source: EigenPhi
4.2 80% of MEV Bot Profits Are Earned by 20% of Bots
In its report “10M Revenue Drain in 5 Months: MEV Impact on Curve,” EigenPhi plotted a box-and-whisker diagram of arbitrage and sandwich bot income distribution (shown below). The data shows a fat-tailed distribution: compared to normal distributions, fat tails imply higher probabilities of extreme outcomes—i.e., “smart,” high-profit bots generate most of the revenue.
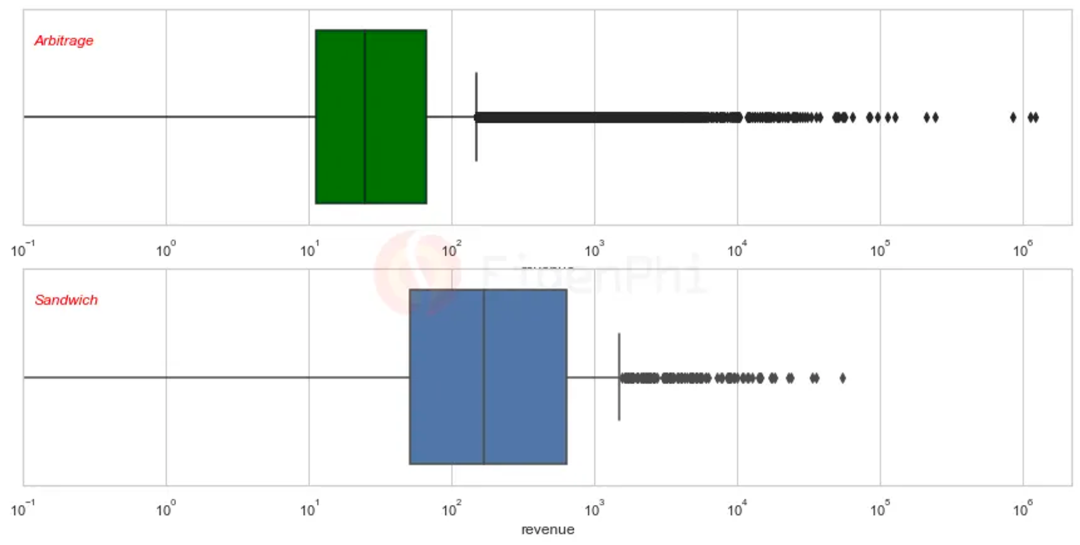
Box plot of arbitrage and sandwich income distribution (bars represent quartiles, middle line median). Source: EigenPhi
Per EigenPhi’s more granular data, the top 25% of arbitrage bots earn over 94% of total arbitrage revenue, and the top 25% of sandwich bots earn 87.8% of sandwich revenue. The most profitable sandwich bot executed only 14 sandwich attacks, yet generated over $46,000 in total profit across just two transactions in Curve’s stETH pool.
4.3 Arbitrage Opportunities Correlate with Market Volatility; Sandwich Attacks Do Not
When EigenPhi analyzed arbitrage and sandwich bot activity using 7-day volatility frequencies of ETH, BTC, and CRV, it found arbitrage opportunities correlate moderately with market volatility. However, sandwich attack opportunities appear unrelated to price volatility. This contrasts with Uniswap’s universal finding (correlation coefficient 0.6), suggesting that even during volatile markets, less sophisticated sandwich bots may still fail to execute attacks.
This finding reinforces point 4.2. Combined with the observation in 4.1 that arbitrage bot revenues far exceed sandwich attack revenues, we infer: compared to Uniswap, sandwich attacks on Curve are more difficult, while technically advanced arbitrage bots enjoy unparalleled opportunities on Curve.
One possible reason: Curve offers multi-asset liquidity pools like 3pool and Tricrypto, making sandwich attacks more complex than on Uniswap’s simpler pool structures. Multi-asset pools introduce extra variables and dynamics, making it harder for attackers to predict and manipulate prices effectively. This is also reflected in the fat-tailed income distribution—top high-profit bots capture the vast majority of MEV revenue.
Another reason: Curve hosts more stablecoin pools, meaning sandwich opportunities depend less on market volatility. The abundance of pegged asset pools creates fertile ground for arbitrage.
Emerging Solutions: Addressing DEX MEV
From the above, we see that MEV distribution across different DEXs can vary greatly, influenced by mechanisms, business models, and technology. Whether through chain infrastructure, algorithm optimization, or DEX-level innovation, the market is actively seeking solutions to mitigate MEV. We summarize five solution categories below.
1. Private RPC Nodes
A necessary condition for MEV is the permissionless visibility of the public mempool. Trading via private RPC nodes routes transactions directly to block proposers, effectively shielding them from public mempool exposure and preventing frontrunning.
PropellerRPC is a plug-and-play RPC solution. Upon receiving a user transaction, a dedicated PropellerSolver runs algorithms to search for potential backruns. If found, PropellerRPC bundles the original transaction and privately sends it to “honest” builders, returning all backrun profits to the user. Because the RPC submits privately to block builders, searchers cannot frontrun or sandwich the trade. Builders detected engaging in malicious behavior—such as reordering transactions at the user’s expense—are blacklisted as “dishonest.”
MEV-Share is an open-source protocol enabling users, wallets, and apps to internalize MEV created by their transactions. Specifically, it implements order flow auctions, allowing users to selectively share transaction data with searchers who bid to include them in bundles. Users decide how to redistribute the winning bids—e.g., to themselves, validators, or others. MEV-Share is trustlessly neutral, permissionless for searchers, and favors no particular block builder. It aims to reduce the centralizing effect of exclusive order flow on Ethereum while enabling wallets and order flow sources to participate in the MEV supply chain. Users can submit transactions to Flashbots MEV-Share nodes to earn MEV rebates.
The core difference between PropellerRPC and MEV-Share lies in approach: one uses algorithms to find backruns and return profits; the other uses auctions to engage all searchers in competitive bidding, redistributing profits to users. Both prevent MEV by bypassing the public mempool, sending user transactions privately to reduce exposure. Most DEXs now integrate private RPC nodes as optional features.
2. Mechanism Innovation – Batch Auctions
Instead of submitting a transaction, users send signed orders. All pending orders are batched and sent to solvers for optimal execution. Optimization leverages off-chain coincidence of wants (CoW) and on-chain liquidity. Dutch auctions select the best solution, with third parties paying gas to submit on behalf of users. Batch auctions allow intra-batch trades to settle at uniform clearing prices, eliminating miner incentives to reorder transactions.
Batch auctions offer many benefits: reduced risk of frontrunning or sandwiching, improved prices, increased usable liquidity, and optimized routing. Detailed arguments can be found in our other report “CowSwap: The Future Intent-Based DEX?”. However, two disadvantages exist:
-
Difficulty determining which solver offers the optimal solution. For a single order, maximizing user surplus is straightforward. But when multiple users are in one transaction, evaluating solver solutions becomes hard. One solution may benefit User A but not B or C; another may favor B but not A or C. The market hasn’t settled on a decentralized, reliable standard to judge solver performance.
CoWSwap proposes a “maximize surplus” strategy, selecting the solution that maximizes total surplus across all participating users. This collective-optimum principle guides solvers to optimize all orders, potentially achieving complex cross-order “coincidence of wants” to maximize overall efficiency and user satisfaction. It serves as a valuable reference.
-
Longer wait times than single transaction execution. For illiquid assets, AMM curve effects may cause significant price drift during execution delays. However, for large traders—especially those not needing instant settlement, like DAOs—this offers a superior alternative. It enables better execution prices, reduced market impact, enhanced slippage protection, and fee savings through batching. This explains why 1/3 of DAO trading volume occurs on CoWSwap (source: Dune).
3. Mechanism Innovation – Order Outsourcing
Projects like CoW, UniswapX, and 1inch Fusion aim to solve MEV through mechanism innovation. If Uniswap represents the DEX industry baseline, order outsourcing may even be a trend. Offloading order execution to specialized fillers simplifies the process. Users sign orders; execution logic moves off-chain. Counterparties execute with guaranteed fallback results, enforced by smart contracts.
Specifically, UniswapX outsources routing complexity to third-party fillers. These fillers compete to execute user trades using on-chain liquidity (e.g., Uniswap v2/v3) or their own private liquidity, while covering gas costs. Anyone can become a filler for UniswapX, and Dutch auction pricing ensures optimal execution. CoWSwap batches trades, ranks solver solutions, and grants execution rights accordingly. 1inch operates similarly to UniswapX, except resolvers attempt solutions sequentially over time.
Especially once Uniswap v4 launches—with its Hook-based custom pools—numerous pools will exist for the same token pair. Without powerful tools, users will struggle to find optimal routes amid complex AMM math. Thus, order outsourcing essentially delegates routing and execution to the market: whoever delivers the best execution gets to fulfill the trade.
Key challenges include ensuring solvers/fillers behave as expected.
-
One solution introduces reputation systems: misbehaving fillers get cut off from order flow and must pay penalties to return.
-
Another fosters a highly competitive market. Here, orders can be executed permissionlessly—anyone can participate. By integrating MEV-Share, users or order flow providers can collaborate permissionlessly with MEV searchers under privacy and commitment guarantees. Long-term, this permissionless execution will dramatically increase competition, delivering better prices to users.
Another challenge: how to benchmark optimal execution?
-
The first and always-guaranteed line is the limit price set in your order. The second is EBBO (Exchange Best Bid/Offer), which captures the best visible on-chain price across DEXs like Uniswap and Balancer.
-
Private mempools may restrict access to optimal execution. SUAVE, a plug-and-play architecture aiming to provide a universal mempool and block-building network for all blockchains, could resolve this by considering all pending on-chain information during block construction.
<
Join TechFlow official community to stay tuned
Telegram:https://t.me/TechFlowDaily
X (Twitter):https://x.com/TechFlowPost
X (Twitter) EN:https://x.com/BlockFlow_News
 Dr.DODO