









Macro Insight: It's time to implement downside protection—will the FOMC deliver on the rally?
TechFlow Selected TechFlow Selected
Macro Insight: It's time to implement downside protection—will the FOMC deliver on the rally?
However, due to weak economic conditions at the beginning of 2024 and an overpriced interest rate market, risk appetite may first decline before rising.
 Navigating Web3 tides with focused insights
Market Overview
Last week, European and U.S. equities performed strongly. Despite a stronger-than-expected non-farm payroll report causing minor volatility, U.S. stocks still closed higher on the day. Chinese and Japanese markets lagged—China due to Moody’s downgrade of its rating outlook, and Japan due to the sharp appreciation of the yen. The anticipated shift toward rate stability by the Fed could act as a catalyst for rotation from winners to laggards this year. Over the past three weeks, the Magnificent 7 have underperformed small-cap stocks by 7%, and the wide valuation gap creates room for catch-up by the weaker markets:
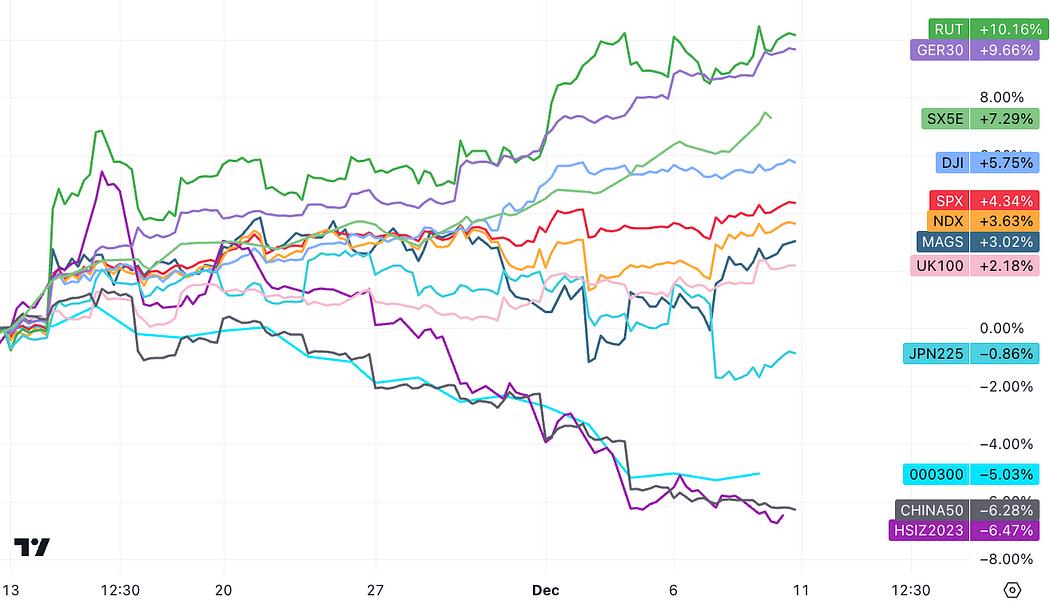
Declining bond yields have coincided with improving expectations for economic growth in risk asset markets. Equity and crypto investors do not appear to interpret further Fed easing as an increased likelihood of recession. Recently, "goldilocks" sentiment has spread, and lower real yields combined with strong equity pricing of growth typically lead to the strongest stock return cycles.
However, given the expected economic softness entering early 2024 and already overly priced rate expectations, risk appetite may decline before rising again. Bonds and their substitutes, such as traditional defensive sectors, may offer opportunities during early 2024 economic weakness, followed later by small-cap and growth stocks as growth reaccelerates.
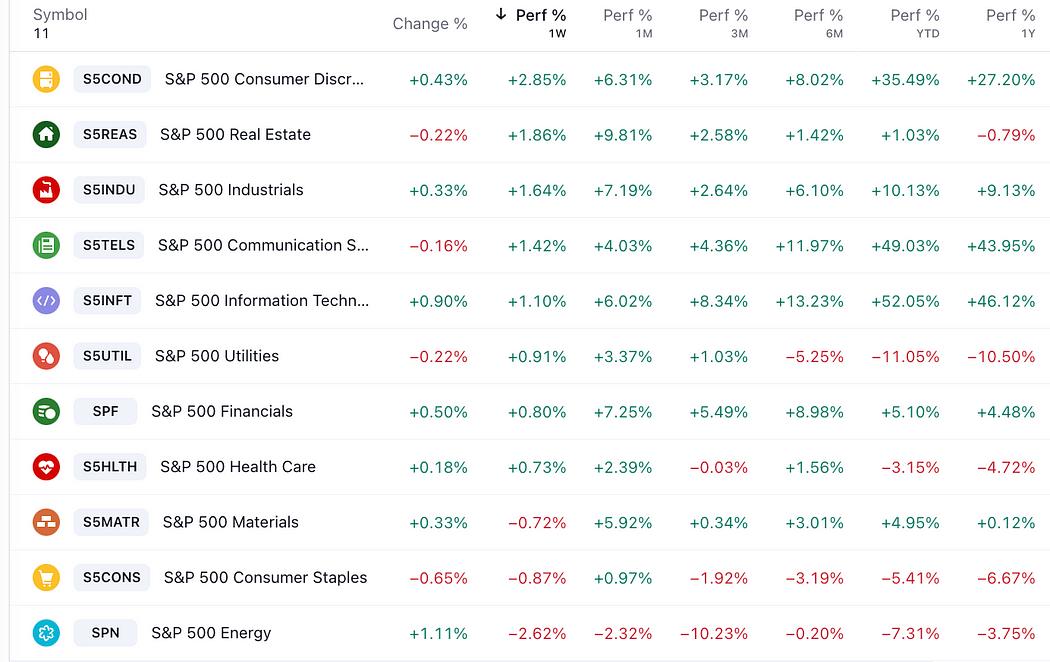
The best-performing sectors last week remained those most dependent on borrowing—i.e., interest-rate-sensitive sectors like consumer discretionary and real estate:
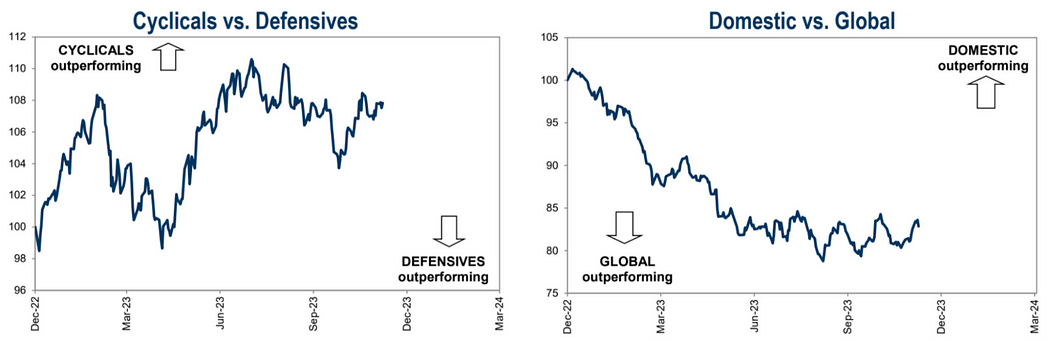
Over recent weeks, the performance gap between cyclical and defensive stocks has stagnated, with U.S. equities slightly outperforming global peers:
Recently, the trend between growth and value stocks has reversed. Growth stocks began declining while value stocks started rebounding. However, this reversal is less pronounced than the shift between large- and small-cap stocks. Combined with positioning data, this reflects strong risk appetite, with investors adding exposure to small-caps while remaining unwilling to abandon high-growth names:

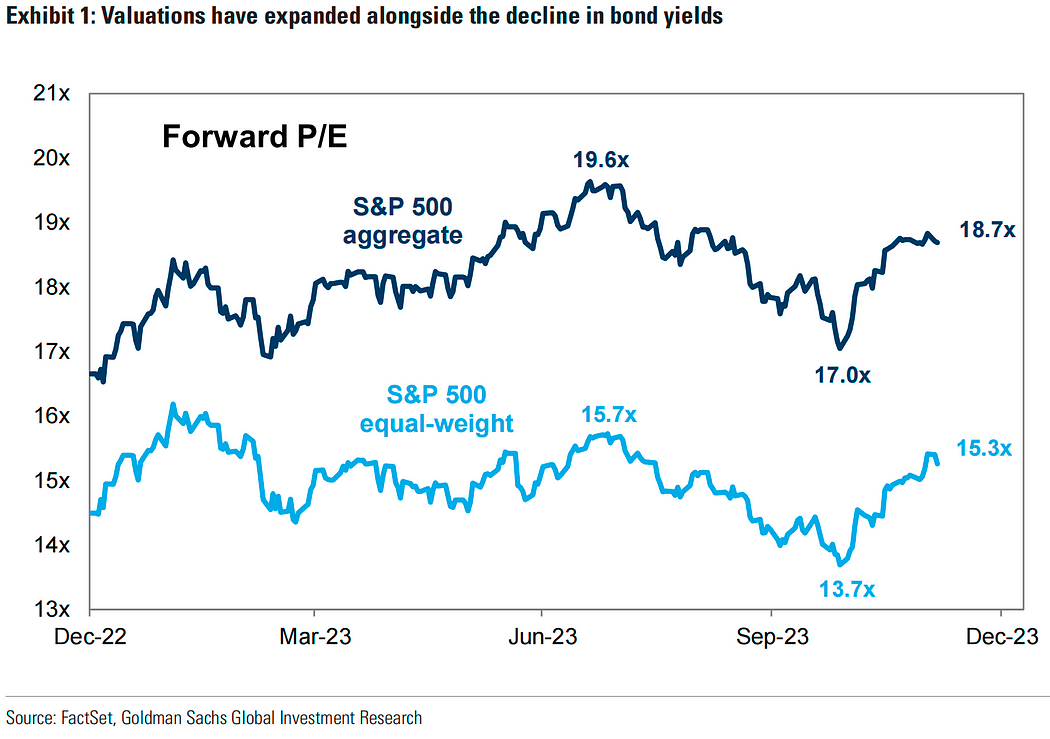
The recent 11% rise in the S&P 500 over the past month has been driven primarily by valuation expansion rather than improvements in earnings fundamentals. The SPX equal-weight P/E ratio rose moderately from 14x to 15x, while the standard P/E increased from 17x to 18.7x—slightly below the July peak:
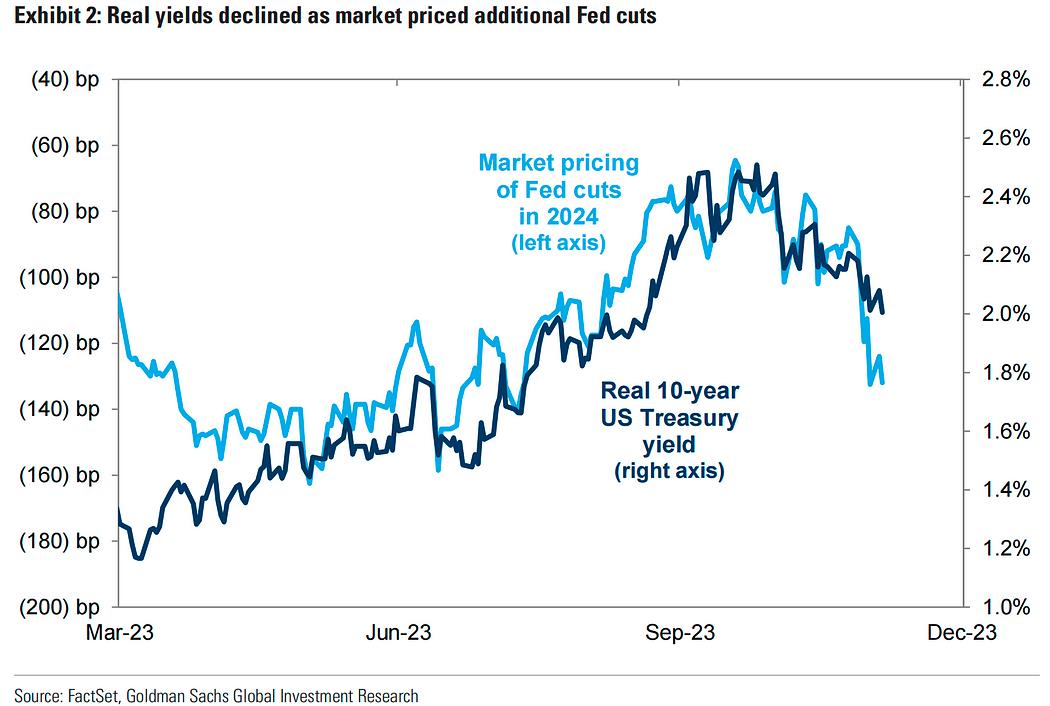
Falling real yields: As real yields (inflation-adjusted interest rates) declined, the cost of capital for markets decreased, pushing up stock prices:
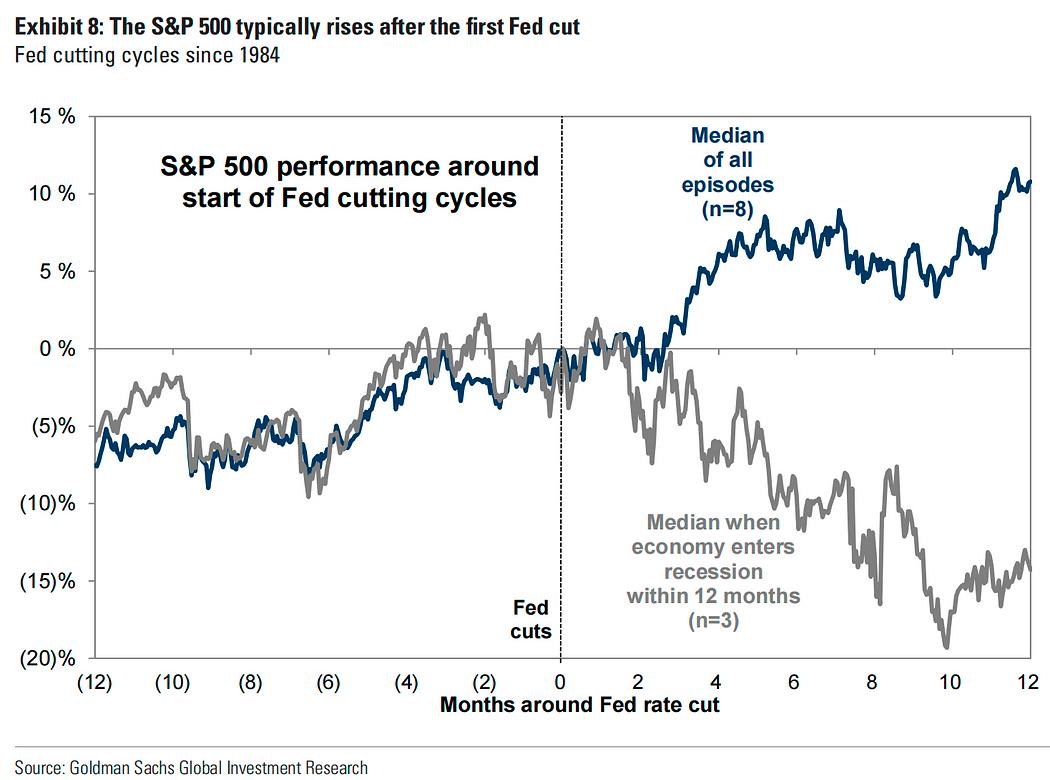
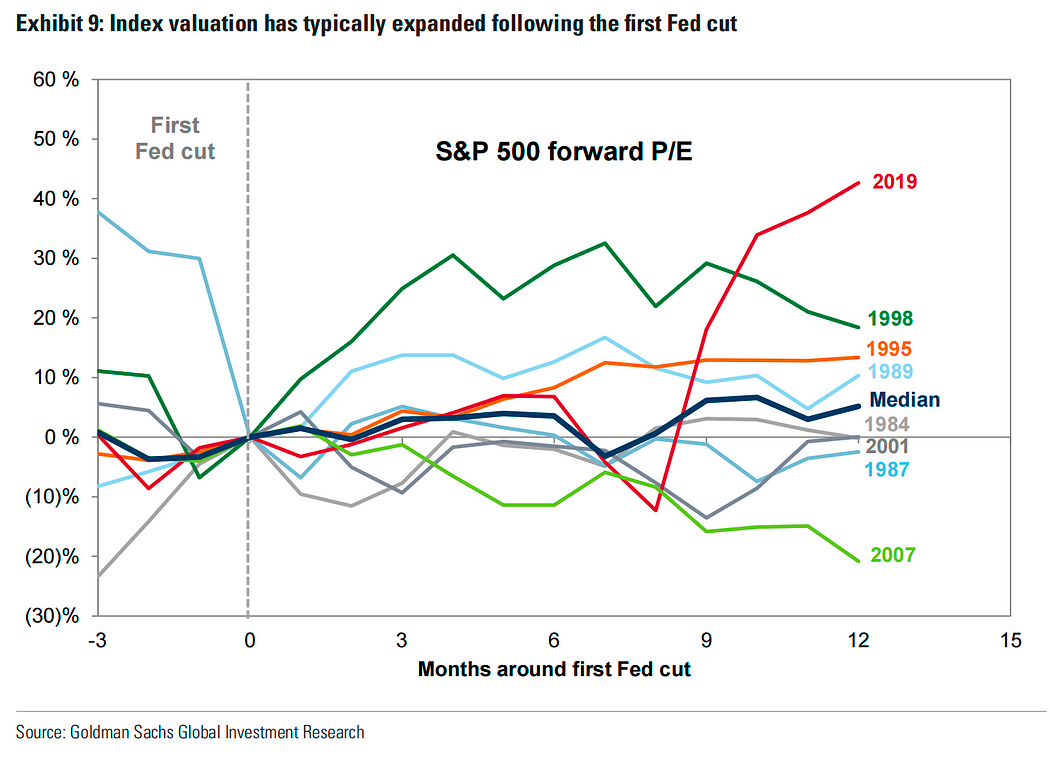
Historical data shows that after the Fed ends a hiking cycle, valuations and prices usually rise, but economic growth remains the key determinant. In the eight Fed easing cycles since 1984, the S&P 500 has typically risen 2% in the first three months after the first cut and 11% over the following 12 months. Market expectations of an upcoming Fed rate cut mean equities often rally before the first cut. However, outcomes vary widely—the 12-month return ranged from +21% (1995) to -24% (2007).
U.S. economic backdrop in 1995:
-
Slowing but still solid growth: GDP growth declined from 4.0% in 1994 to 3.0%.
-
Rising but low inflation: CPI inflation increased from 2.8% in 1994 to 3.0%.
-
Declining unemployment: Unemployment fell from 5.5% in 1994 to 5.2%.
U.S. economic backdrop in 2007:
-
Slowing growth: GDP growth declined from 2.6% in 2006 to 2.2%.
-
Rising inflation: CPI inflation increased from 3.2% in 2006 to 4.0%.
-
Rising unemployment: Unemployment increased from 4.6% in 2006 to 5.1%.
Comparison with 2023 economic backdrop
-
U.S. 2023 GDP growth forecast is 2.1%, flat vs. 2022;
-
U.S. 2023 CPI inflation forecast drops to 3.3%, down sharply from 7.9% in 2022;
-
U.S. 2023 unemployment forecast at 3.9%, nearly unchanged from 2022's 3.8%.
The Fed began raising rates in February 1995 to curb inflation. However, as signs of slowing growth became clearer, it stopped hiking in July 1995 and began cutting rates in August. Overall, the economy remained healthy, and major technological advances (computing and internet) emerged in the mid-1990s, leading to strong stock market gains before and after the cuts. In 2007, rate cut expectations boosted market sentiment earlier in the year, combined with a housing bubble, driving strong equity gains in the first half. However, as the subprime crisis and recession unfolded, investors realized rate cuts couldn't fix structural issues, and the market turned downward.
Thus, recession remains the key issue: Equities historically perform poorly when a recession occurs shortly after the Fed's first rate cut—this happened in 3 out of 8 cycles:
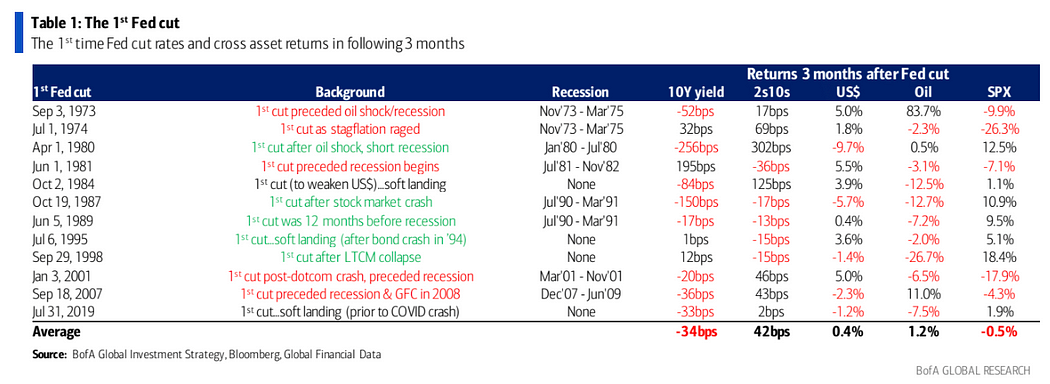
If equities seem hard to predict, consider the Treasury market: Historically, there's an 8 out of 12 chance that yields fall within three months after a rate cut, averaging a 34bp decline. Yields also tend to fall 15bp on average in the three months before a cut, indicating higher certainty for this asset class:
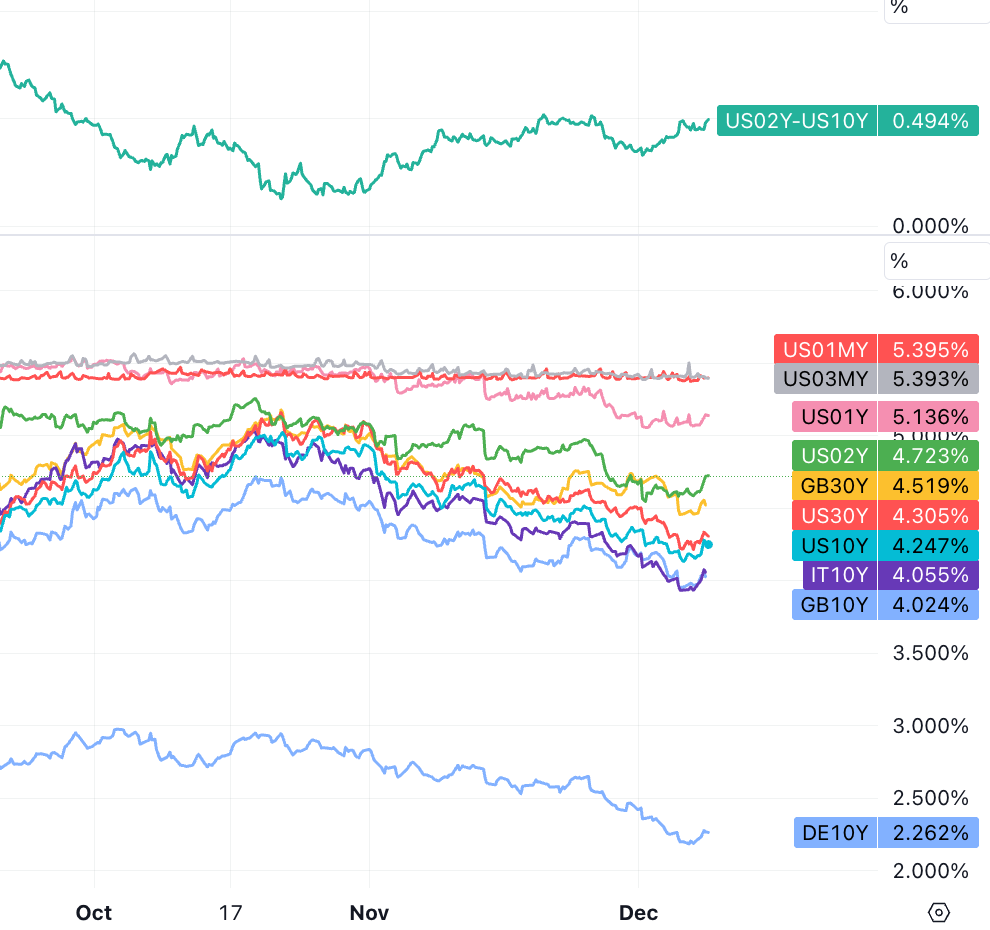
At Friday’s close, yields slightly rebounded due to the stronger-than-expected NFP and consumer confidence data, deepening the yield curve inversion. The dollar gained some support, but the Bank of Japan hinted at rate hikes, sending the yen surging 4% against the dollar, pressuring the dollar index. However, as many remain skeptical about Japan’s economy and the negative impact of rate hikes, USDJPY ended the week down only 1.14%:

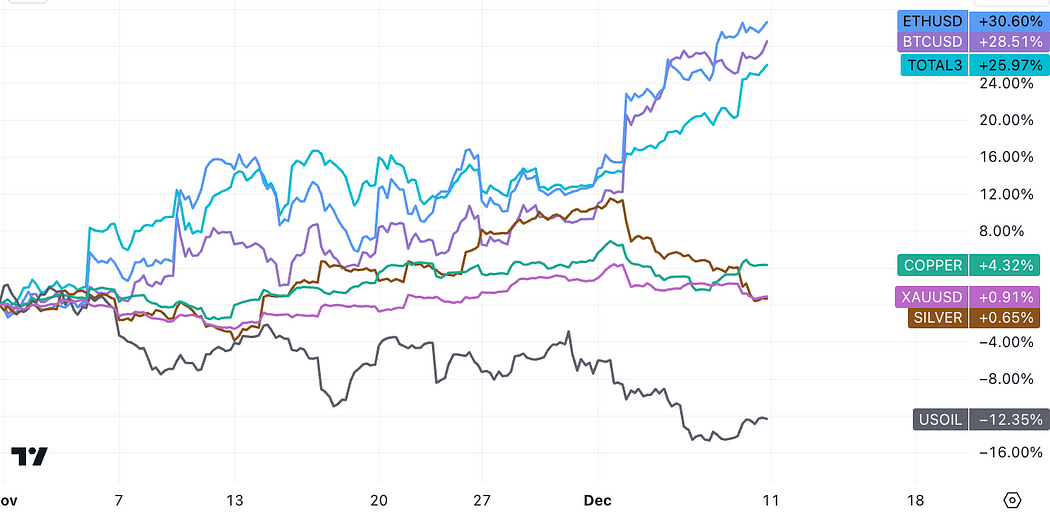
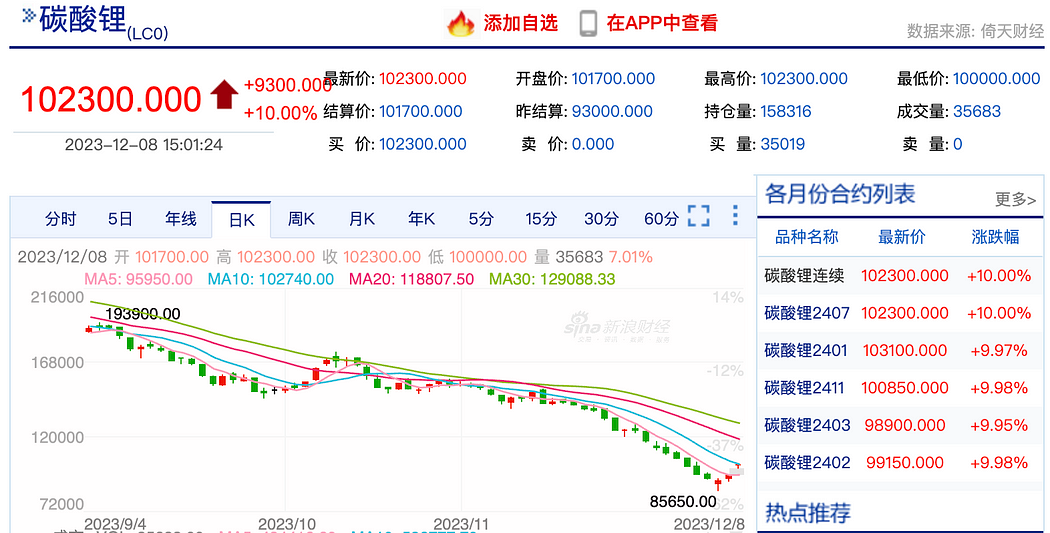
Cryptocurrencies maintained strength, but last week alts (+8%) outperformed BTC and ETH (+6%) for the first time in four weeks, suggesting speculative enthusiasm is spreading beyond core assets. Gold dropped 3.4% for the week, oil declined again, but coal, iron ore, and lithium rose. China's lithium carbonate futures surged, hitting limit-up for two consecutive days, resembling a short squeeze:
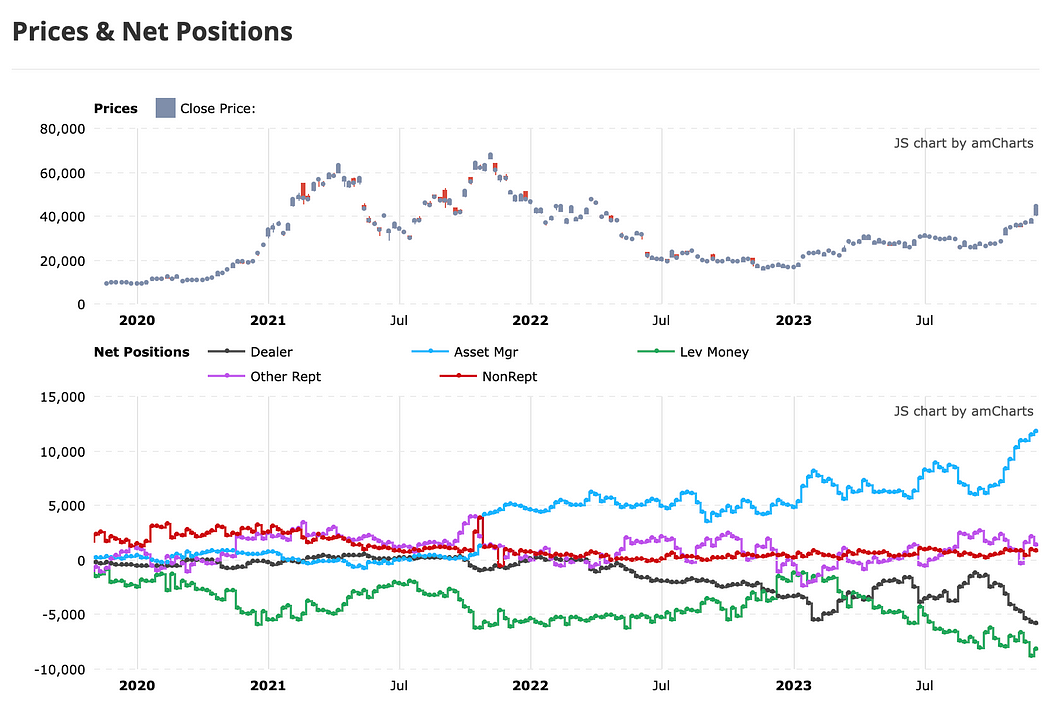
Large speculators in BTC futures slightly reduced net short positions but remain near historical highs. Market makers' net shorts hit a new record high last week, contrasting with asset managers’ historically high net long levels:
Rate Expectations
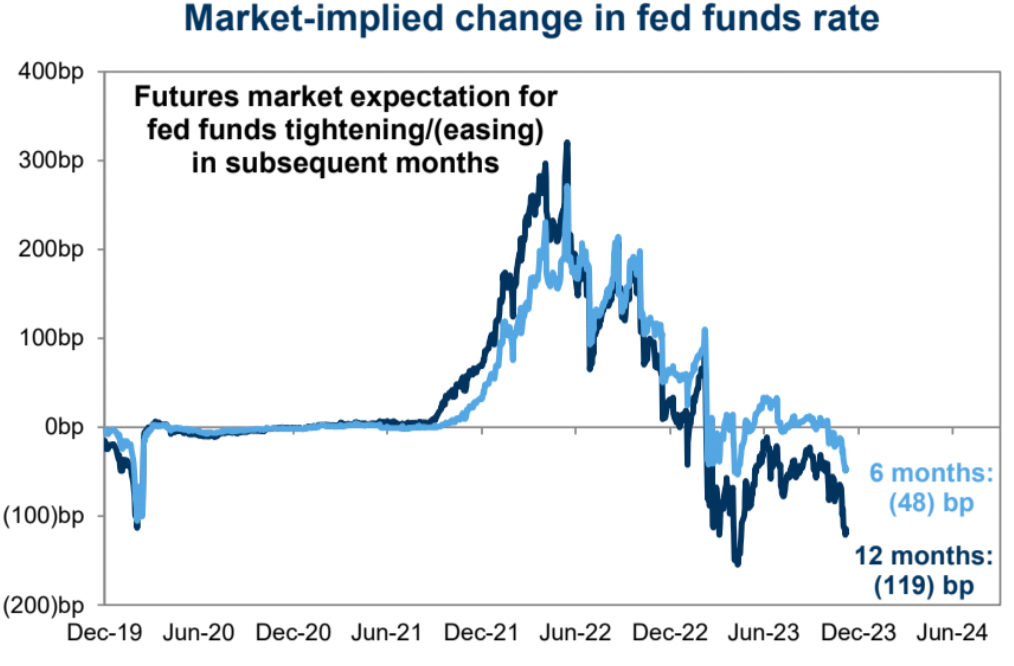
The rate market currently prices in a 71% chance of a cut by March 2024 and 100% by May, totaling 120bps or five cuts for the year—an extreme level compared to the 150bps priced in during the banking crisis in March this year:
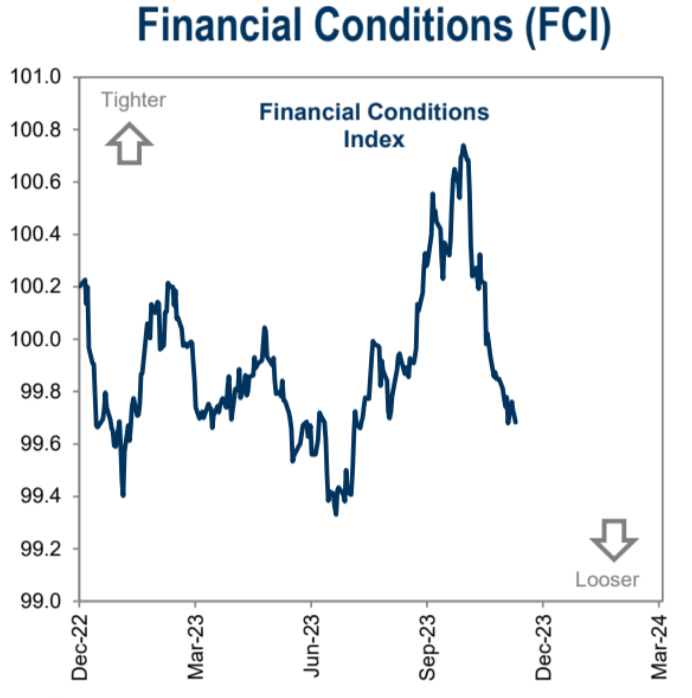
Declining market rates have pushed the financial conditions index to its lowest level in four months:
These extreme expectations are not baseless. Current inflation is falling faster than expected, especially in Europe, where there’s growing risk of inflation undershooting dramatically. The chart below shows 2-year inflation expectations derived from zero-coupon inflation swaps: U.S. inflation expectations are near 2%, while eurozone expectations have dipped below the ECB’s 2% target to just 1.8%:

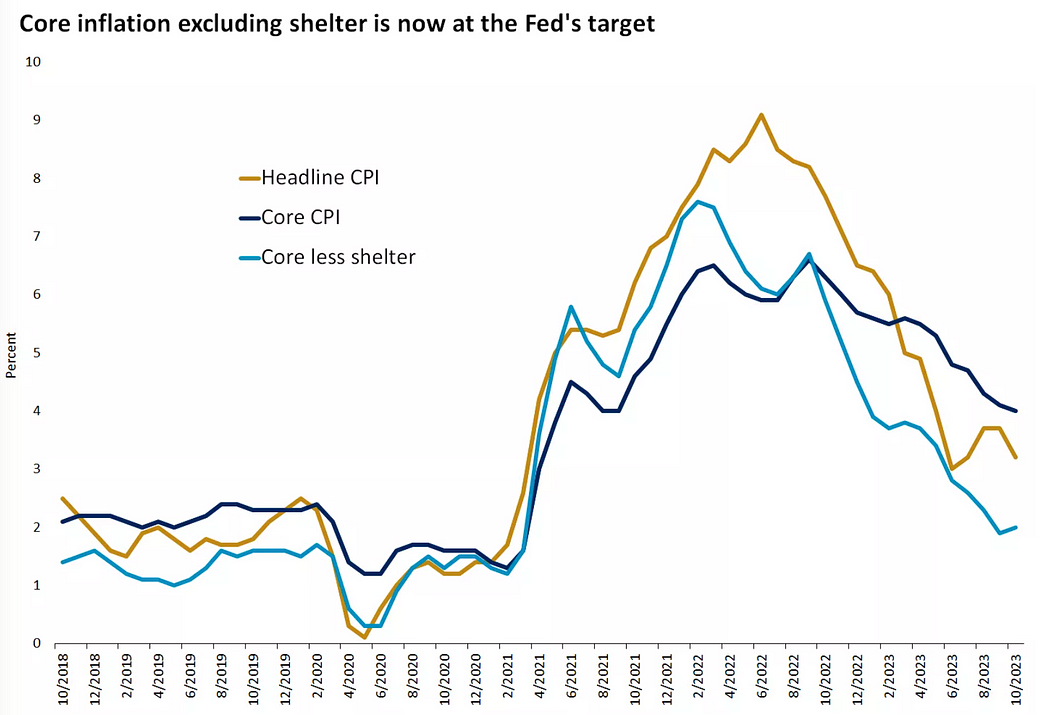
In the U.S., excluding the lagged effect of housing costs, core CPI over the past two months has already reached the Fed’s 2% target. The sharp slowdown in new lease prices should continue to pull down housing inflation through much of 2024. The biggest uncertainty lies in oil prices, but for now, oversupply remains the dominant theme:
Labor Market Moderately Cools
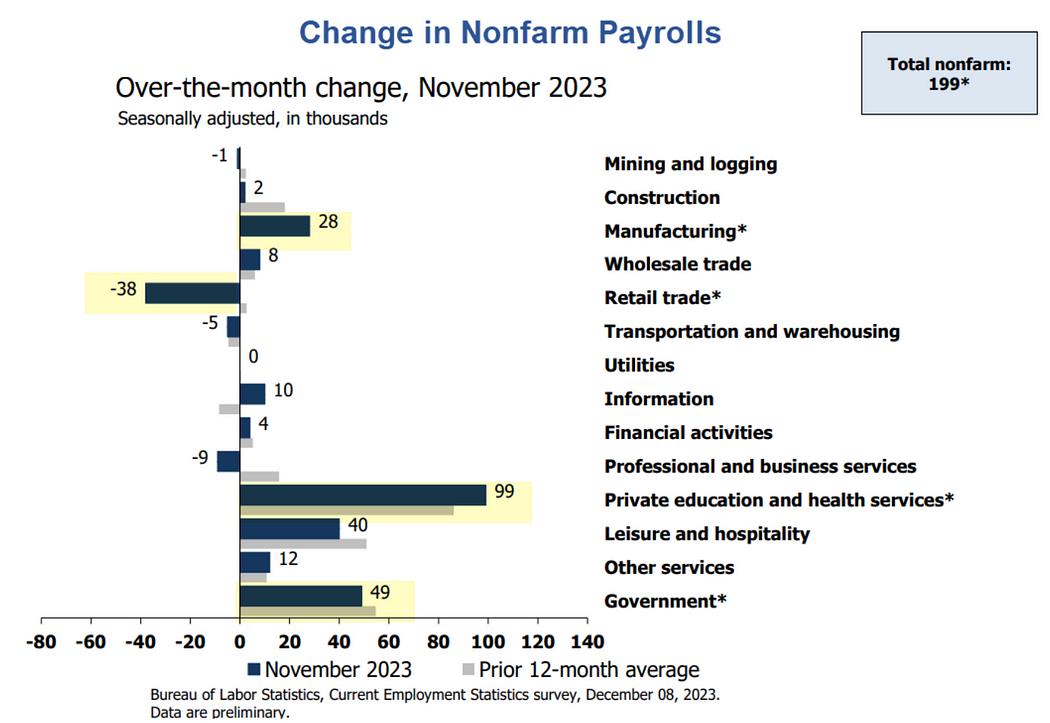
Last week’s data focus was employment, delivering mixed signals without reversing the cooling trend—a scenario the Fed prefers:
-
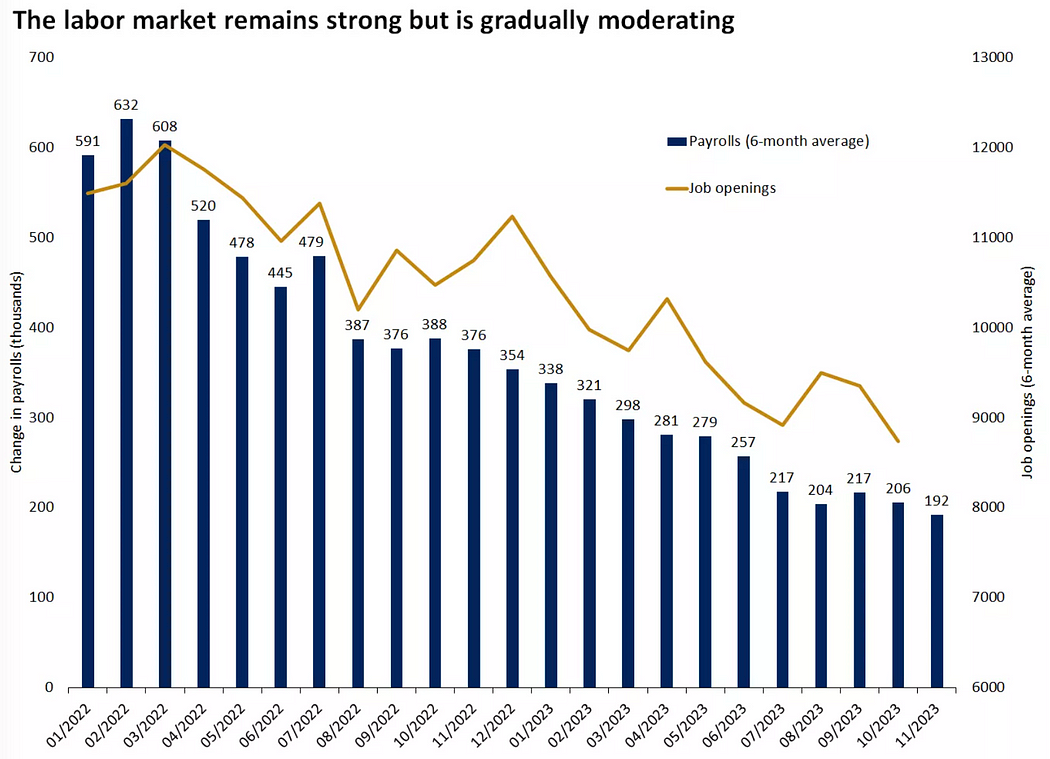
U.S. non-farm payrolls added 199,000 jobs in November, slightly above expectations, with unemployment dipping to 3.7% (a four-month low) and labor force participation rising—all signs of a healthy labor market. However, the return of striking auto and entertainment workers added 47,000 to payrolls. Thus, 3- and 6-month average job growth remains stable.
-
Job openings fell for the third consecutive month in October (to 8.73 million), more than expected, reaching the lowest since March 2021. Still, openings remain above pre-pandemic 2019 averages (~7 million) and total unemployed (6.5 million). Quit rates held steady, signaling easing labor market tightness. Historically, quit rates lead wage growth; the latest reading is the lowest in nearly two years, suggesting limited upside for future wages.
-
By sector, education added 99,000 jobs, government 49,000, and leisure 40,000—accounting for nearly all November job growth. This has been a hallmark of the U.S. labor market this year: over the past 12 months, non-farm payrolls grew by 2.8 million, with 2.2 million coming from these three sectors (education: 1 million, government: 640,000, leisure: 530,000). Private-sector employment excluding government workers has reached the lower end of the previous cycle.
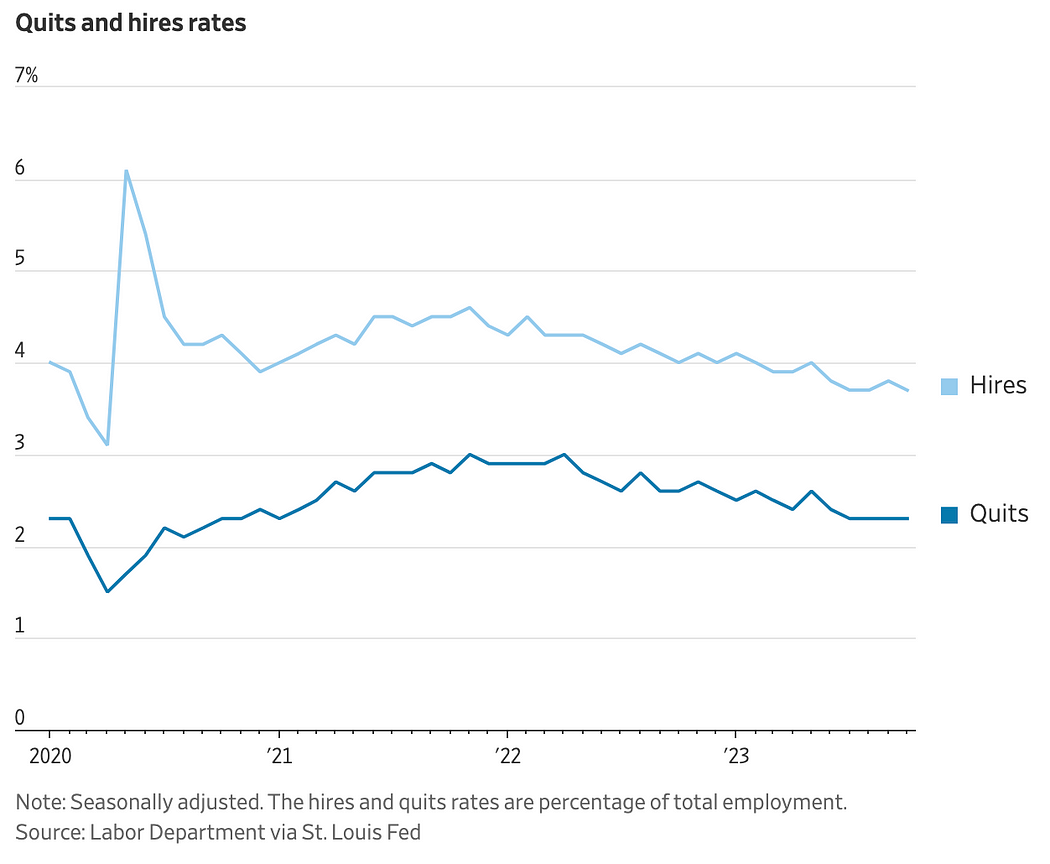
Stock market rising while job openings fall is a rare combination historically:
Capital Flows and Positioning
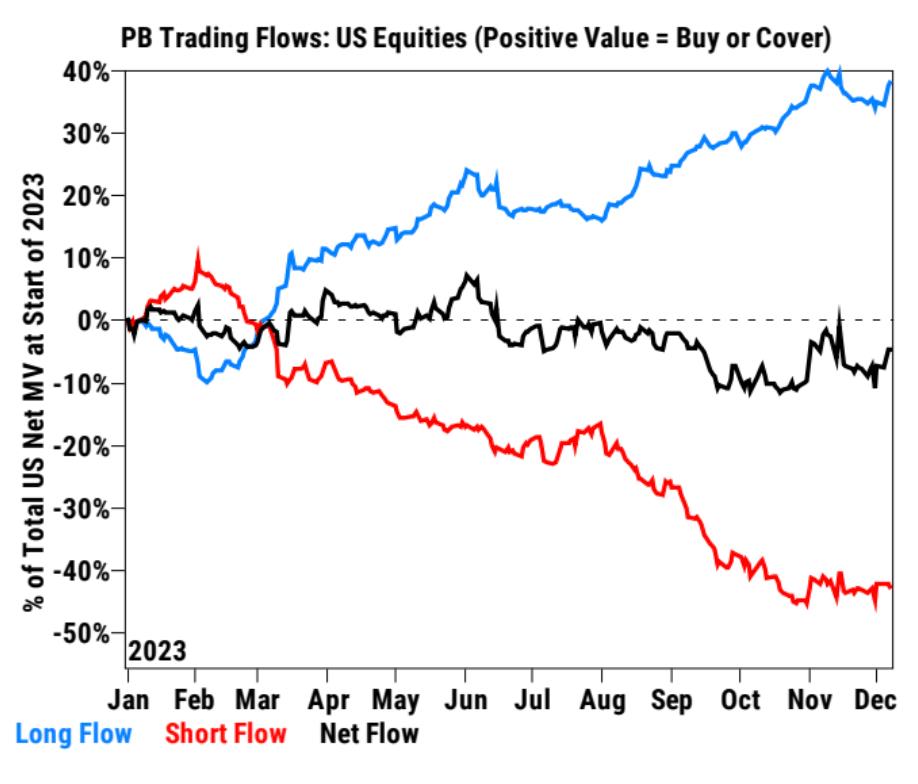
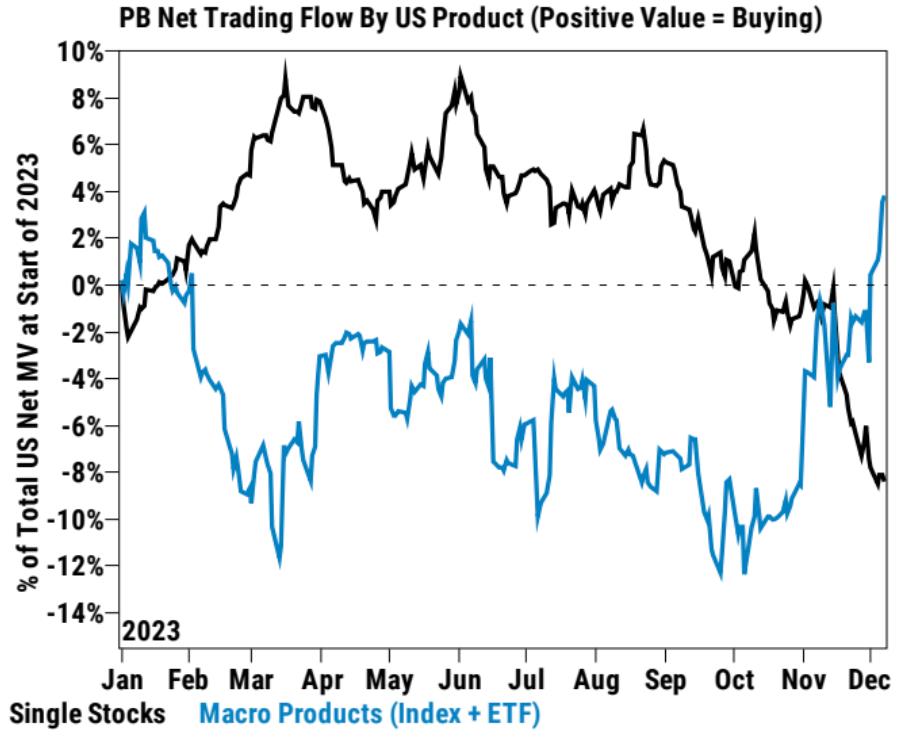
According to Goldman Sachs PrimeBook data, hedge funds (HF) made their first net purchase of U.S. equities in four weeks, primarily via macro products. However, individual stocks saw net selling for the fifth consecutive week, even as retail investors bought aggressively. Short-term trading activity continues to rise. Most investors remain on the sidelines ahead of next week’s CPI data and the Fed meeting. However, some long-term investors have begun small-scale buying in tech.
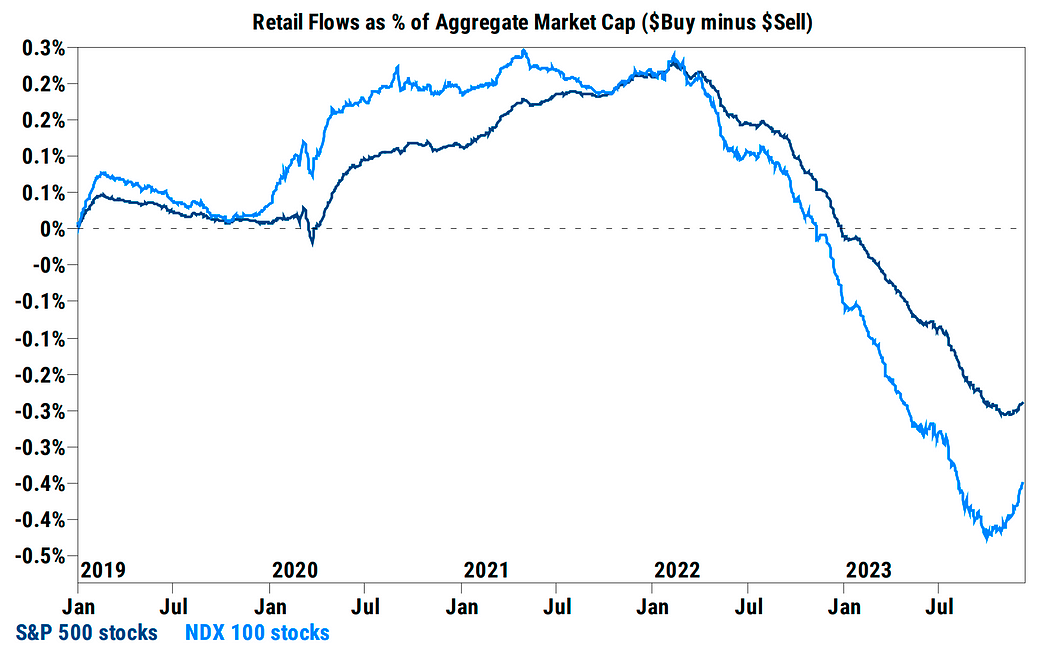
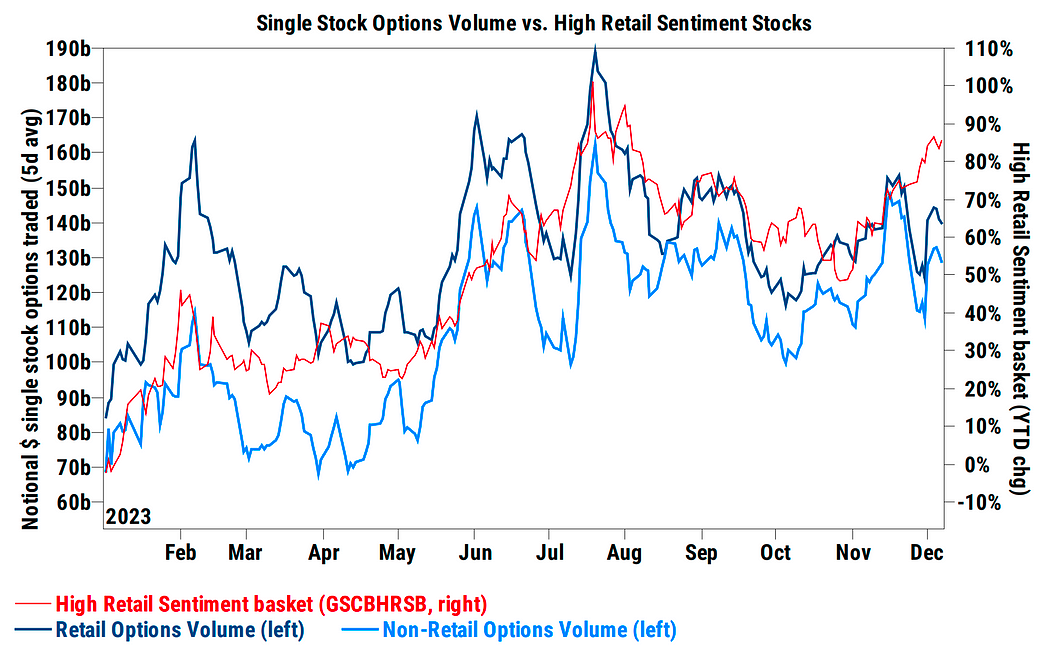
Retail option buying volume has recently declined, suggesting the short squeeze may have peaked:
Cumulative net transaction flows show cyclical stocks overall dropping to new lows, mainly due to net selling in energy and financials. Tech, media, and telecom (TMT) stocks saw net selling for the fourth consecutive week, led by short-covering, though the pace has significantly slowed compared to November’s dominant long-side selling. After being actively sold in recent weeks, the Magnificent 7 collectively achieved net buying this week, with daily net inflows over the past three trading days:

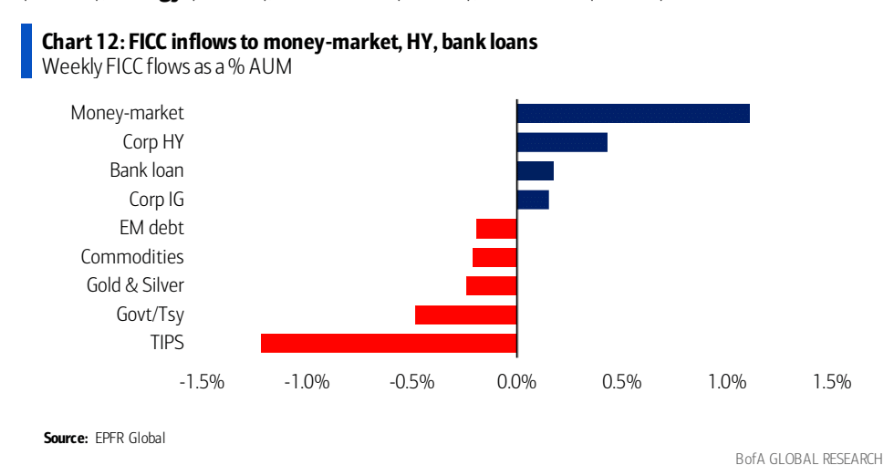
Over the past week, equities and high-yield bonds maintained inflows, while investment-grade and government bonds saw large outflows. This suggests investors are rotating from safer assets into more speculative ones.
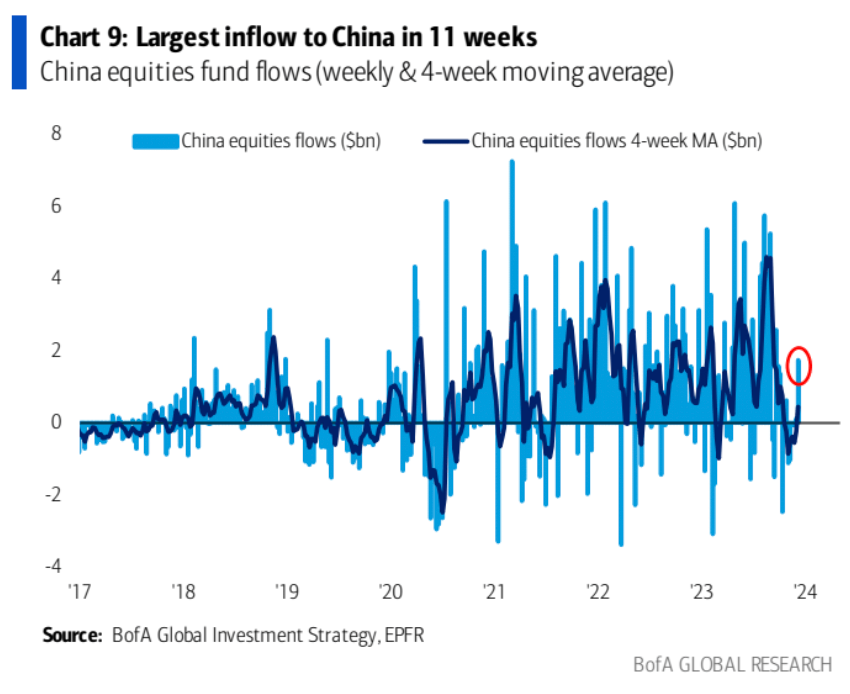
Notably, despite a sharp drop in Chinese equities, open-end funds recorded their largest weekly inflow in 11 weeks:
Sentiment
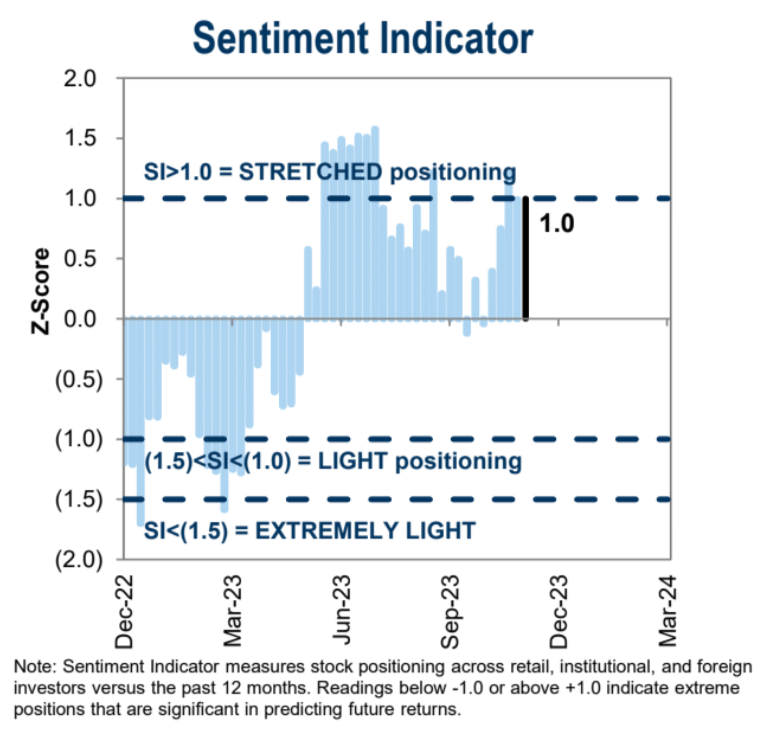
Goldman Sachs sentiment indicator remained in “stretched” territory at 1.0 or above for the third consecutive week.
BofA market sentiment indicator (Bull & Bear Indicator) jumped to 3.8, showing clear improvement in investor pessimism. However, the indicator is approaching neutral, meaning sentiment shifts may no longer favor risk assets.
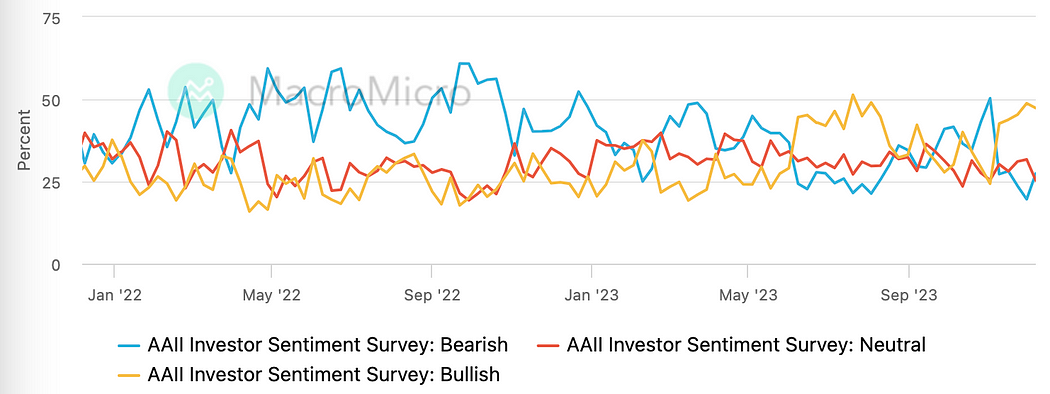
AAII investor survey shows slight decline in bullish sentiment and modest increase in bearish views:
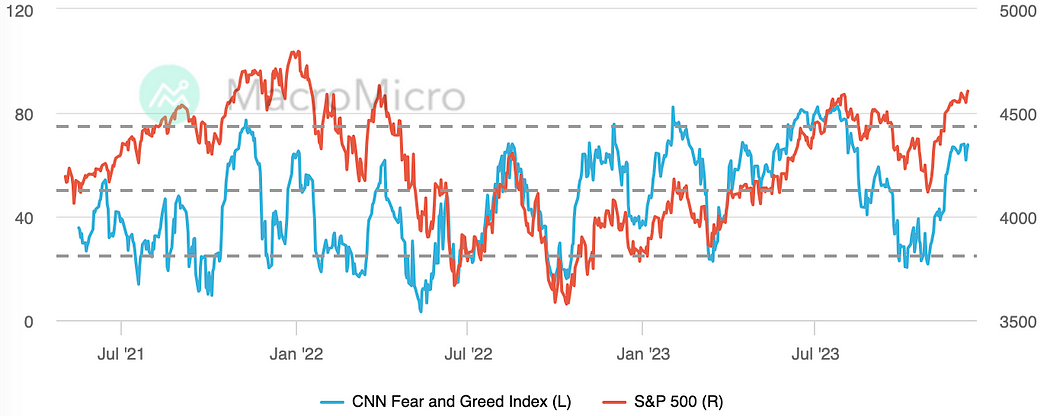
CNN Fear & Greed Index remained near its highest level since early August, with little change last week:
Institutional Views
[GS: Optimistic Scenario Already Priced In, Consider Downside Protection]
The S&P 500’s overall P/E is only 5% below Goldman Sachs’ optimistic scenario. That scenario assumes real yields fall to 1.5% and P/E reaches 20x. Currently, real yields are around 2%, and P/E is near 19x. GS sees three possible paths:
-
If real yields decline moderately due to falling inflation and Fed easing, P/E could reach 20x.
-
If real yields rise moderately due to resilient growth, P/E might settle at 18x.
-
If real yields fall sharply due to growth concerns, P/E could drop to 17x.
Additional considerations:
-
Markets already price in 130bps of Fed cuts in 2024—higher than Goldman economists’ forecasts. Strategists believe markets can’t become more optimistic on rate cuts.
-
Goldman’s sentiment indicator has risen from neutral in October to +1 standard deviation (“stretched”), indicating investors have reloaded on risk during the recent rally.
Given that the optimistic scenario may already be reflected in current prices, GS suggests investors consider downside protection, such as constructing a put spread:
-
Buy a put: Purchase a 3-month put option with a strike price 2% below the current S&P 500 level.
-
Sell a put: Sell a 3-month put option with a strike price 7% below the current S&P 500 level.
The 5% difference between strikes makes this a 5%-wide put spread. Its potential maximum return ranks in the 95th percentile over the past 28 years, suggesting historically high relative payoff (the strategy bets on typical U.S. equity corrections staying under 5%):
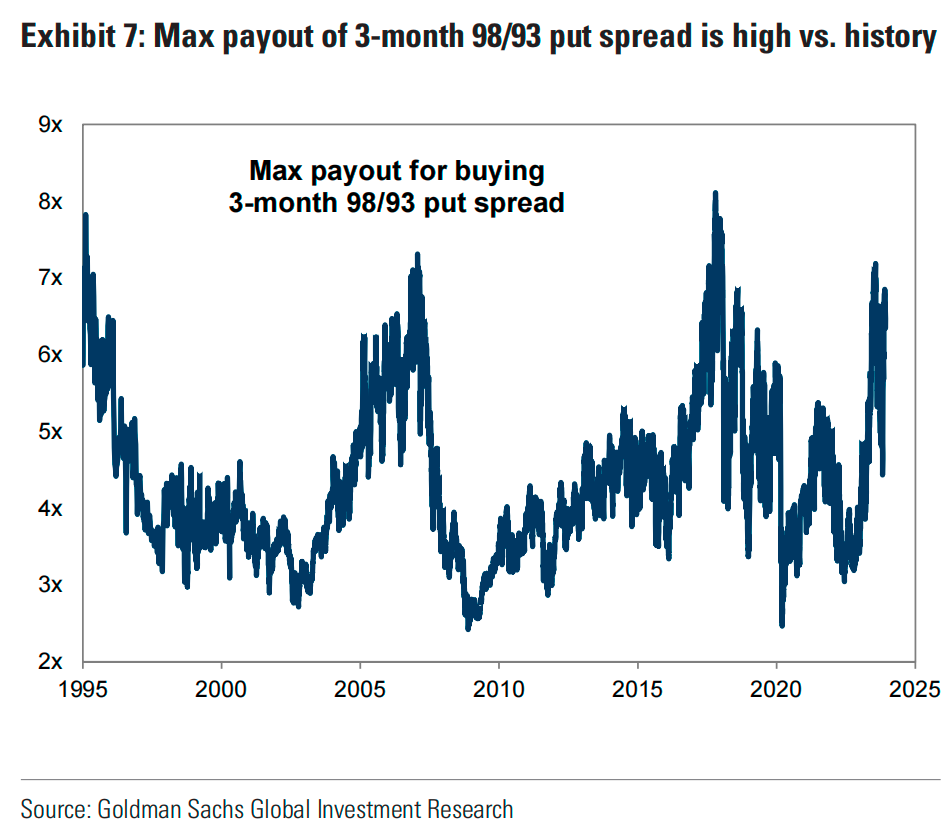
This strategy benefits if the market falls: the bought put gains value, while the sold put expires worthless if the decline stays under 7%, maximizing profit. Net loss is limited to the net premium paid. In contrast, buying a single put exposes investors to full premium loss.
[GS: Favor High-Growth Companies Next Year]
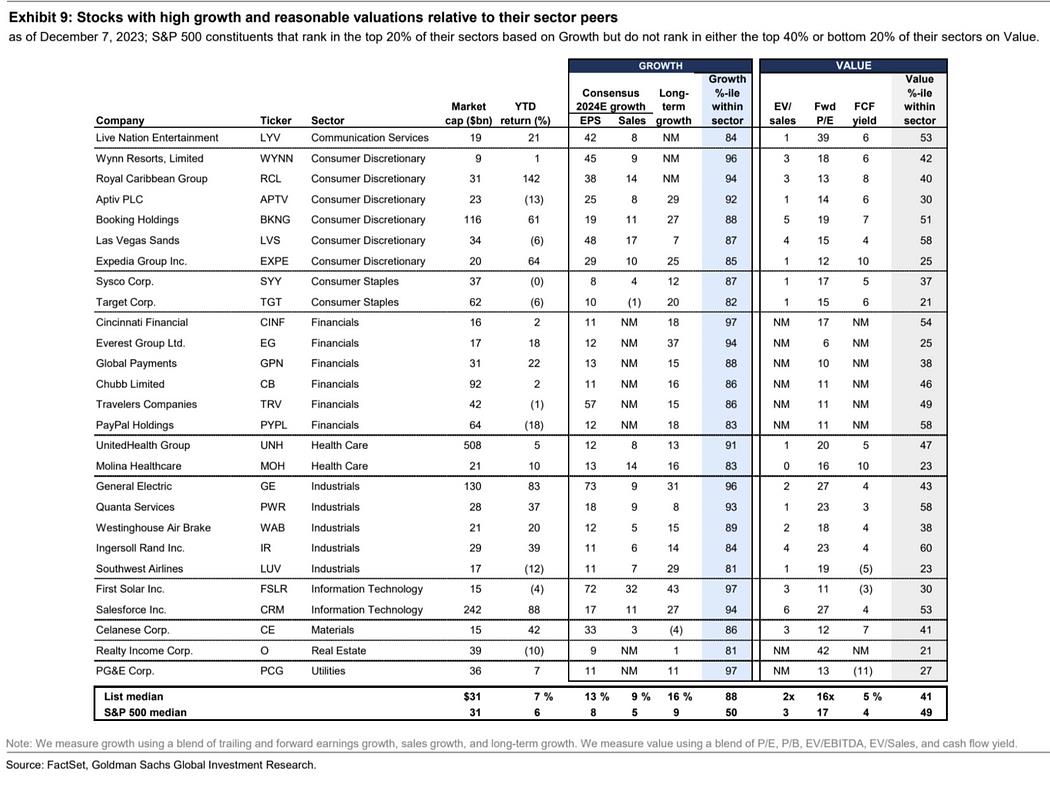
According to GS’s macro model, growth stocks outperform value when economic growth approaches trend, slows slightly, and both rates and inflation decline. Goldman economists forecast 2.1% U.S. GDP growth in 2024, and rate strategists believe rates have peaked—conditions favorable for growth stocks. Further rate declines due to weak data would likely extend growth leadership, unless a recession occurs. A significant growth acceleration could benefit value, but GS considers this unlikely.
Below is GS’s screen of stocks with high growth relative to peers and reasonable valuations—ranking in the top 20% for growth within their industry, but neither in the top 40% nor bottom 20% for valuation:
Next Week Watch
Final central bank meetings of the year in the U.S. and Europe. Recent weak data support the Fed lowering its economic outlook, including rate projections in the dot plot. However, Powell’s tone may remain hawkish to preserve credibility. These developments likely won’t hurt markets, but with elevated sentiment, a “sell the news” reaction is possible. The biggest surprise could be insufficient dovishness in the dot plot—for example, if it projects less than 50bps of cuts by end-2024—leading to significant disappointment. Most institutions expect over 100bps of cuts next year: ING forecasts 150, UBS 275, Barclays 100, Macquarie 225.
The December inflation data will be released before the FOMC meeting. Analysts expect core CPI (excluding food and energy) to hold at 4% YoY, with MoM at 0.3%, similar to October’s 0.2%. Declines in vehicle, power, heating, and gasoline prices were notable. Overall, the data may show clear disinflation. Given last month’s 0% nominal CPI MoM print, a negative print this time would strongly boost risk sentiment.
Join TechFlow official community to stay tuned
Telegram:https://t.me/TechFlowDaily
X (Twitter):https://x.com/TechFlowPost
X (Twitter) EN:https://x.com/BlockFlow_News
 Cycle Capital Research









