DYDX Valuation Report: Uncovering Panic and Data Truth
TechFlow Selected TechFlow Selected
DYDX Valuation Report: Uncovering Panic and Data Truth
This article will conduct a valuation analysis of dYdX by combining token unlock schedules and the features of version 4.
 Navigating Web3 tides with focused insights
1. Introduction
In our previous report, "dYdX v4: Improvements in Economic Model and Valuation Outlook," we primarily examined the updates in dYdX v4, discussed its version-specific features, incremental improvements over v3, and the rationale behind dYdX’s move from Ethereum to Cosmos. We concluded that Layer 1 staking, fee distribution mechanisms, and the introduction of a native stablecoin on Cosmos would collectively enhance the DYDX token's fundamentals, creating sustained bullish momentum.
Since our last report, dYdX has achieved several exciting advancements and developments. Recently, the new version launched on mainnet with strong market reception and notable price appreciation. However, it is equally important to note that in December, dYdX will face a significant unlock of initially allocated tokens—accounting for 15% of the total supply. How will the market react to this potential selling pressure? Will the token inflation from this release dilute the value accrual brought by v4? Can the positive impact of the new version continue to drive growth in the DYDX token? Is the period before December the final opportunity to enter? To gain deeper insights into dYdX’s development prospects and the expected value of the DYDX token, this report takes a data-driven approach, building upon our prior work to conduct a valuation analysis. We apply both discounted cash flow (DCF) and comparable company analysis models to reasonably forecast dYdX’s revenue and token price, while also estimating v4 staking yields and assessing the potential impact of the upcoming token unlock.
2. Overview of dYdX
dYdX is a pioneer among decentralized perpetual contract exchanges, whose unique order book model delivers user experience comparable to centralized platforms. Today, it captures around 60% of the DEX market share in derivatives trading. The innovative architecture and marginal enhancements in v4 have strengthened dYdX’s competitive edge. On October 24, dYdX announced the release of dYdX Chain V1.0 and open-sourced its codebase—a milestone marking the official start of its v4 upgrade and transition from an Ethereum Layer 2 solution to an independent blockchain within the Cosmos ecosystem. Open-sourcing code embodies the core spirit of blockchain, offering transparency to developers who can then audit, detect bugs, and improve quality. According to dYdX Trading Inc., the original developer behind the exchange, the dYdX Chain V1.0 and its order book system have been fully developed and underwent final audits. The v4 upgrade enables full decentralization and community governance, meaning the company will no longer control the protocol or collect trading fees.
On October 27, the dYdX Chain officially launched on mainnet. As an independent Cosmos Layer 1 chain, it was deployed by the dYdX Ops subDAO, with validators generating the genesis block at 01:00 UTC+8 on October 27. The public frontend operated by the dYdX Operations subDAO for bridging assets is scheduled to go live on October 30, 2023, pending official confirmation and testing. Post-genesis, the network will proceed through Alpha and Beta phases. The Alpha phase begins on October 30, 2023, focusing on enhancing network stability and security. The Beta phase will enable trading without rewards; the transition from Alpha to Beta will be determined by governance votes and other factors.
This article builds upon our previous report, combining insights on token unlocks and v4-specific characteristics to conduct a comprehensive valuation analysis of dYdX.
3. Valuation Methodology
Our valuation employs two primary methods: Discounted Cash Flow (DCF) analysis and Comparable Company Analysis. These methodologies are detailed in our valuation model (DYDX Valuation Model), which allows for adjustments based on future market conditions. Below is a detailed explanation of each method.
DYDX Supply in Valuation
Although validators and stakers on the dYdX Chain receive all protocol fees (i.e., only staked DYDX tokens capture cash flows from the protocol), freely circulating, unlocked DYDX tokens can choose to delegate to validators and earn staking rewards. Therefore, in our valuation, we use the total circulating supply rather than net circulating supply after staking deductions. Our valuation date is set as December 31, 2023, accounting for post-December unlock volumes, resulting in an effective token base of 446 million.
Top-Down Approach
We adopt a top-down valuation framework. For each forecast year, starting with the total annual derivatives trading volume, we multiply by DEX penetration rate to estimate DEX derivatives volume. Then, using dYdX’s market share, we derive dYdX’s transaction volume and finally calculate protocol revenue based on effective fee rates.
3.1 Discounted Cash Flow (DCF) Analysis
dYdX generates revenue and cash flows by charging users trading fees. Prior to v4, the protocol was managed by dYdX Trading Inc., with all cash flows accruing to the company. With the v4 upgrade, control shifted to the dYdX Operations subDAO, enabling fully decentralized governance. Official announcements confirm that all protocol fees—including USDC-denominated trading fees and DYDX-denominated gas fees—will be distributed entirely to validators and stakers. Thus, DYDX token holders are now able to capture 100% of the protocol’s generated cash flows.
Given these conditions, the Discounted Cash Flow (DCF) method is most suitable for valuing the DYDX token. DCF is an absolute valuation technique used to estimate the value of an asset based on its expected future cash flows. The principle holds that a company’s (or protocol’s) value equals the sum of its future cash flows discounted at a rate reflecting associated risks. Our model uses data up to September 30, 2023, projects over a five-year horizon, and incorporates a terminal value to represent long-term cash flows under ongoing operations, ultimately estimating the DYDX token value as of December 31, 2023.
3.1.1 Assumptions
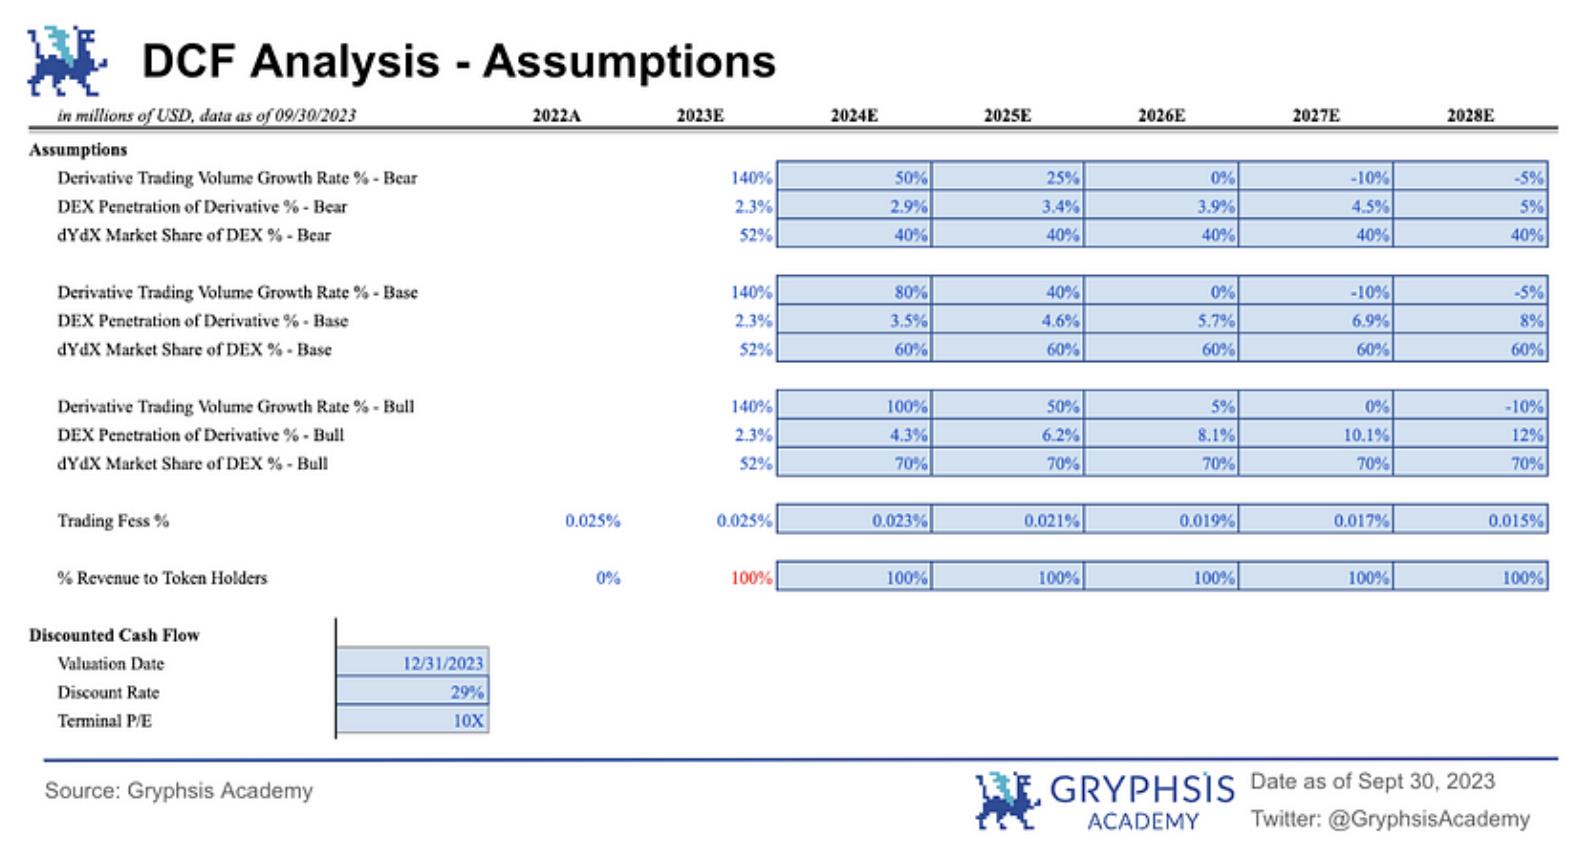
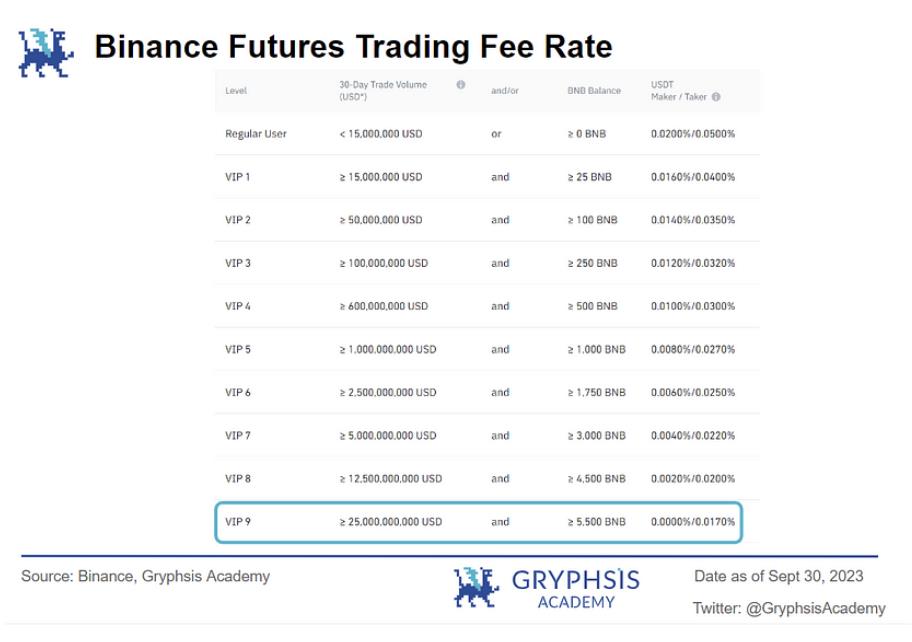
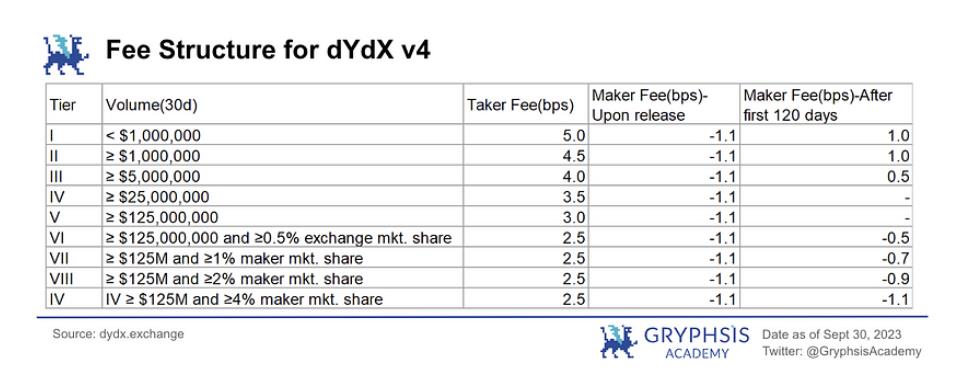
Trading Fees: Compared to other perpetual contract protocols, dYdX maintains relatively low trading fees, giving it a competitive advantage. v4 expands on v3 by introducing nine fee tiers with corresponding trading incentives. Using 2022’s fee income divided by total trading volume, we calculate an average fee rate of 0.025%. As competition intensifies and overall exchange fee rates decline, dYdX’s effective fee rate is projected to linearly decrease to 0.015% (borne jointly by buyers and sellers), approaching Binance’s VIP 9 level for monthly trading volumes exceeding $2.5 billion.
Discount Rate: Based on an assessment of current protocol development and market risk, we set the discount rate for cash flows between 2023 and 2028 at 29%. This rate is derived using the 10-year U.S. Treasury yield as the risk-free rate and Bitcoin (BTC) as the market benchmark. The beta (β) value comes from a regression model where DYDX returns are regressed against BTC returns, using daily data from August 1, 2022, to September 30, 2023—a period selected to align with current price levels. The Capital Asset Pricing Model (CAPM) yields a cost of capital of 29.10%. Regression results show a statistically significant positive correlation between DYDX prices and BTC returns. Hence, we select a 29% discount rate, consistent with the average venture capital return of ~30%, making it a reasonable assumption.
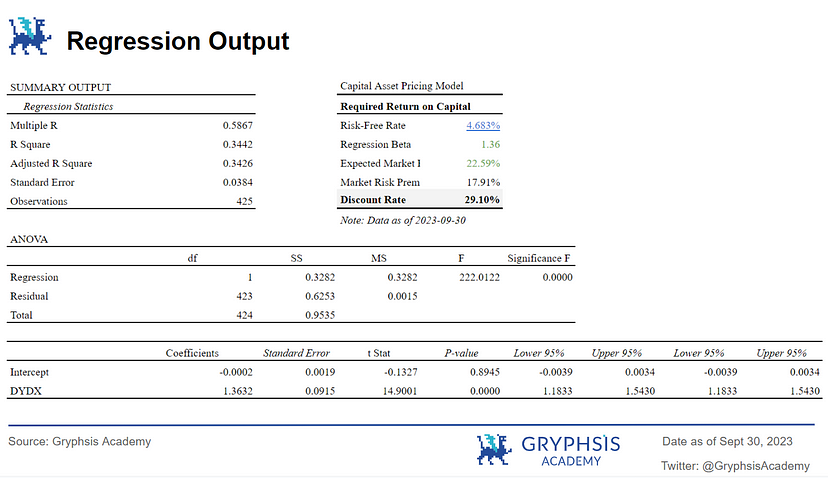
Terminal P/E Ratio: As DeFi is a lightweight asset industry, we use the exit multiple method to back-calculate terminal value. Referencing P/E ratios of publicly listed traditional exchanges, we select a terminal exit multiple of 10x for DYDX.
Expected Trading Volume: Trading volume directly drives protocol revenue and is central to DEX valuation. To estimate DYDX’s potential value range under different market scenarios, we assume three distinct trading volume growth trajectories.
Each projection starts from the annualized derivatives trading volume since September 30, 2023, applying annual growth rates. Following industry trends, we assume rapid growth in 2024–2025, followed by gradual deceleration, eventually turning negative by the end of the forecast period. This reflects expectations of a bull market driven by the upcoming Bitcoin halving and anticipated Fed rate cuts in the next two years.
To estimate dYdX’s trading volume, we assume a constant market share of 40%–60% within the DEX derivatives segment (varying by scenario). Below are the expected volume profiles under each case:
-
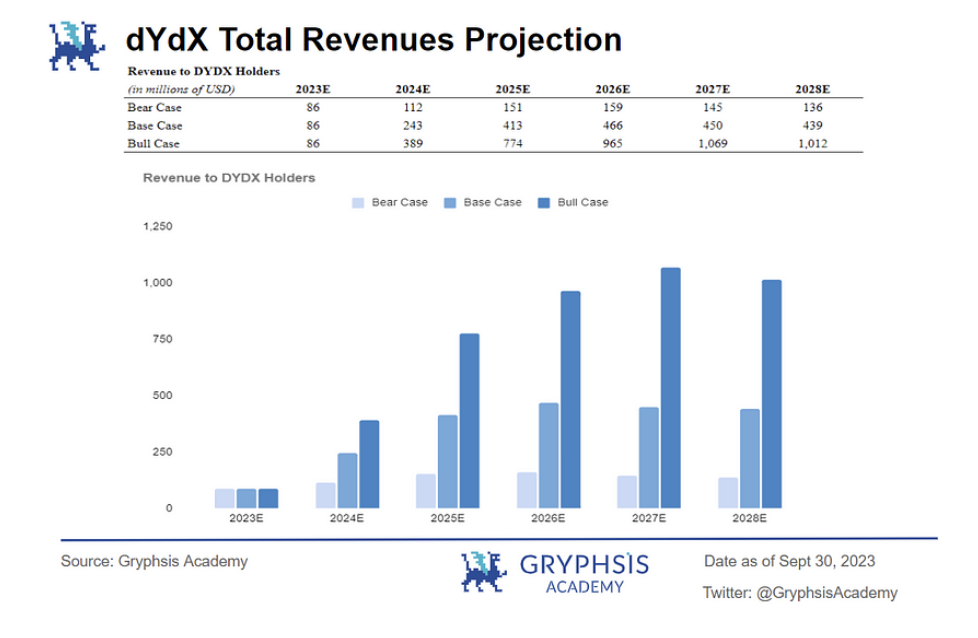
Base Case: Derivatives trading volume grows at 80% in 2024, gradually declining to -5% by 2028. With continued DeFi expansion or increased DEX adoption, dYdX’s total trading volume is projected to reach $2.93 trillion by 2028.
-
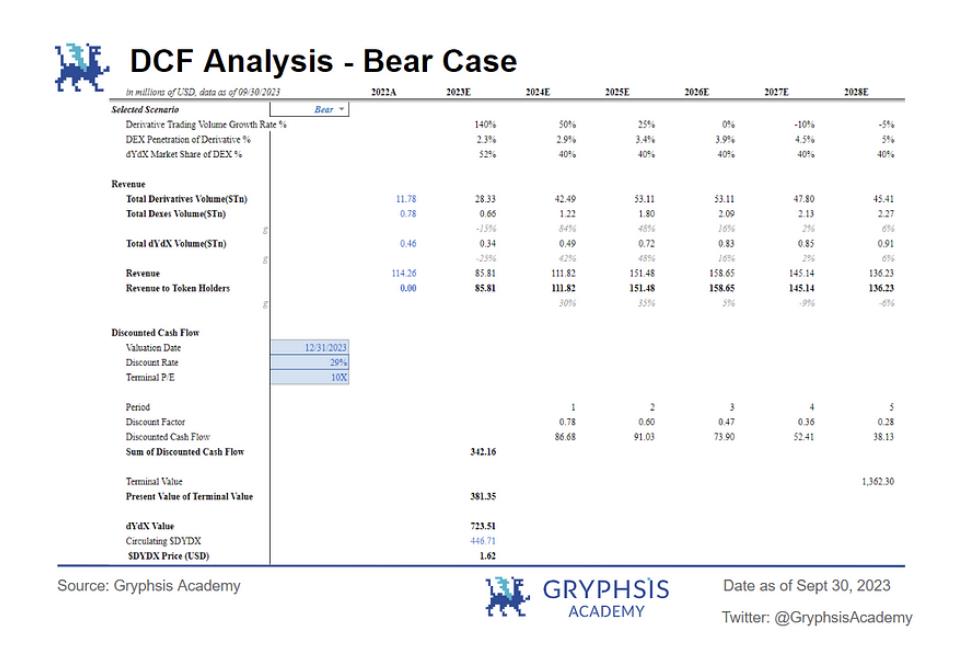
Bear Case: Derivatives volume grows at 50% in 2024, slowing to -5% by 2028. Regulatory headwinds or declining DEX usage could push users toward CEXs, leading to a projected dYdX trading volume of $0.91 trillion by 2028.
-
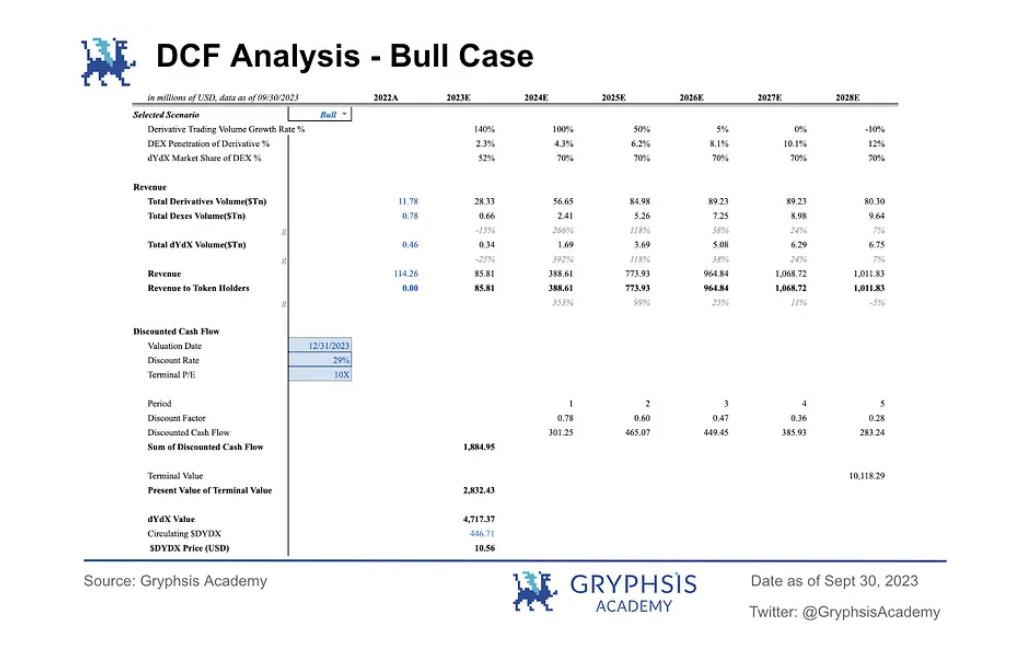
Bull Case: Derivatives volume grows at 100% in 2024, decreasing to -10% by 2028. With successful deployment of dYdX Chain and v4, coupled with favorable regulatory developments, dYdX’s trading volume could reach $6.75 trillion by 2028.
Over the past nine months, the top 20 derivative DEXs have recorded approximately $0.49 trillion in total trading volume, with dYdX capturing $0.26 trillion. Meanwhile, the top 10 centralized exchanges reported $20.49 trillion in derivatives volume. At present, DEXs account for roughly 2%–3% of CEX trading volume.
Multiplying expected trading volume by the fee rate gives us the following projected revenues:
3.1.2 DCF Analysis
It should be noted that the token present value in this report is based on the circulating supply as of December 31, excluding any future token unlocks. However, given the aggressive 29% discount rate, the dilution risk in the current environment is partially mitigated.
Below are the DCF results under each scenario:
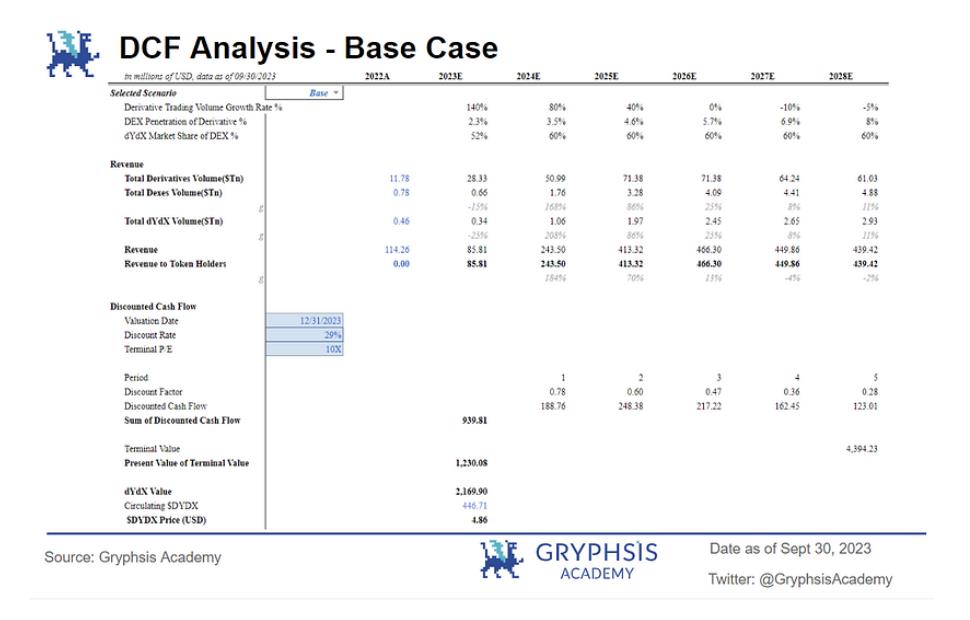
Base Case: In this scenario, the DYDX token price is estimated at $4.86, with a protocol valuation of $2.17 billion as of December 31, 2023.
Bear Case: Under bearish conditions, the DYDX token price is projected at $1.62, with a protocol valuation of $724 million as of December 31, 2023.
Bull Case: In a bull market, the DYDX token price is expected to reach $10.56, with a protocol valuation of $4.717 billion as of December 31, 2023.
3.1.3 Probability-Weighted Scenario Analysis
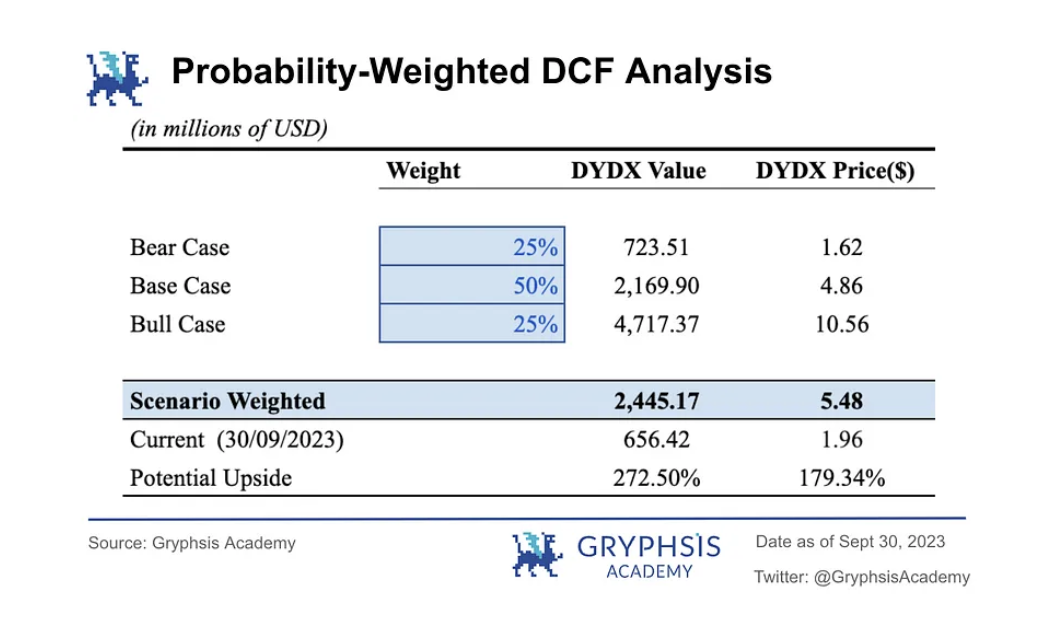
We assign 25% probability to both bull and bear cases, and 50% to the base case. The resulting probability-weighted DCF valuation estimates the DYDX price at $5.48, with a protocol valuation of $2.445 billion. As of September 30, 2023, the DYDX price was $1.96, indicating a potential upside of 179.34%.
3.2 Comparable Company Analysis
Comparable company analysis evaluates a company or project relative to its peers. The core assumption is that blockchain projects with similar scale and characteristics should theoretically exhibit comparable valuation multiples. This method typically uses Price-to-Sales (P/S) and Price-to-Earnings (P/E) ratios for comparative valuation.
Selecting appropriate comparables is critical—they must closely resemble the target in terms of industry, business model, risk profile, and market dynamics. Ensuring similarity minimizes external distortions and focuses attention on intrinsic value drivers. We selected four projects in the decentralized derivatives space: Synthetix, GMX, Gains Network, and Perpetual Protocol. These share similar business models and risk profiles, and all are listed on Binance, meeting stringent listing standards, thus enhancing the validity of the comparison. By focusing on DEX derivatives projects within the same decentralized financial ecosystem, we minimize cross-industry risk disparities.
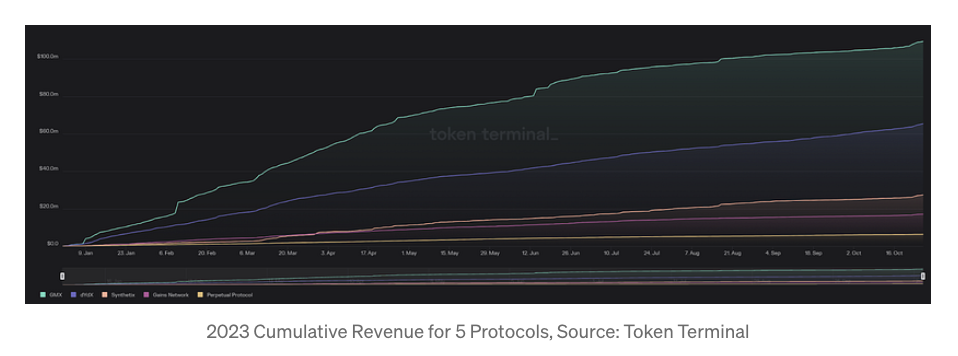
The above chart shows cumulative annual revenue for these five projects as of October 27, 2023. GMX leads in revenue, the only one surpassing $100 million, followed by dYdX at $65.4 million, while Perpetual Protocol lags at $63 million.
Below is a summary of each comparable project:
1. dYdX: Since its 2021 launch, the DYDX token has faced challenges related to limited supply utility. Despite holding over 50% market share in DEX perpetuals, its circulating supply ratio remains significantly lower than peers. Before v4, DYDX was mainly used for governance and fee discounts via collateralization. However, the new roadmap introduces expanded utilities—such as distributing all dYdX Chain fees to validators and stakers. Nonetheless, investors may remain cautious about the impact of large-scale token unlocks.
2. GMX: A DEX platform supporting spot and perpetual trading, focused on derivatives. Unlike others, GMX uses a global liquidity pool model where users provide liquidity by purchasing and staking GLP, the protocol’s liquidity token. $GMX holders can stake their tokens to earn 30% of protocol fees. Stakers also receive $esGMX and multiplier points (MP) to boost yields. Additionally, $GMX grants voting rights in protocol governance, allowing participation in community fund decisions.
3. SNX (Synthetix): Synthetix’s perpetual product is not end-user-facing but serves as a backend infrastructure for developers and DeFi liquidity platforms. Users interact with Synthetix Perps indirectly through integrated DeFi applications. Currently, most Synthetix perpetual volume comes from Kwenta, a front-end DEX built on Synthetix Perps. SNX’s circulating and total supply are nearly identical. SNX maintains a weekly inflation schedule rewarding SNX stakers. Separate reward pools exist on Optimism and Ethereum, with varying APRs. Current inflation is minimal and adjusts based on collateralization ratio. However, rewards are subject to a one-year lock-up, reducing immediate supply impact. That said, SNX utility may evolve in the future.
4. Gains Network: Built around the ERC20 utility token $GNS, designed to grant ownership via revenue sharing and upcoming governance rights. $GNS holders earn platform fees through single-sided staking, and platform revenue is used to burn $GNS. With leverage capped at 9x and low funding fees, it may not appeal to all traders but has gained traction among beginners. Currently, GNS allocates 61.23% of its revenue to $GNS stakers.
5. Perpetual Protocol: A decentralized perpetual contract protocol built on Ethereum. It uses a virtual AMM (vAMM) design, supporting up to 20x leverage, short positions, and low slippage. Unlike standard AMMs used for swaps and price discovery, vAMM is solely for price determination, enabling leveraged and short trades. Similar to Uniswap, traders interact with vAMM without centralized oversight, and the design ensures market neutrality and full collateralization. PERP is the protocol’s native ERC-20 token, enabling community governance. Token holders can stake PERP in designated pools to earn staking rewards, including PERP tokens and trading fees.
3.2.1 Key Variables Considered
Price/Earnings Ratio (P/E): A financial metric measuring the relationship between a blockchain project’s current token price and its earnings per share. This ratio helps assess investment value and risk. P/E varies widely across industries, so comparisons should be made within the same sector.
Price/Sales Ratio (P/S): Commonly used to value traditional companies based on revenue. For DEX projects, protocol fees (analogous to “sales”) are key indicators of financial health and sustainability. The P/S ratio reveals how the market values a protocol’s revenue-generating capacity.
Average P/S Ratio: We apply a common crypto valuation approach—using the average P/S ratio of the five comparable projects as the market multiple. Averaging accounts for highs and lows, providing a balanced estimate. This avoids bias from relying solely on extreme values.
Median: Statistically, the median is less affected by outliers, improving representativeness. Thus, we include median as a reference point for market multiples.
Fees Revenue (Annualized Total Revenue): Analyzing a project’s revenue helps assess its ability to generate income and sustain operations. Revenue indicates financial health and growth potential. Evaluating protocol fee income sheds light on direct trading-related cash flows and profitability. Revenue sources include trading fees, margin fees, liquidation fees, and funding fees. Considering revenue diversity helps evaluate resilience to market volatility and long-term viability.
Profit (Annualized Revenue to DYDX Holders): In traditional equity markets, “earnings” in P/E refers to net profit over a specific period—key for measuring profitability. In blockchain, however, “earnings” are less straightforward. DeFi projects don’t generate net profit like traditional firms. Instead, their economic models involve converting trading fees, liquidity mining rewards, lending interest, etc., into net income for projects or token holders.
3.2.2 Valuation via Comparable Analysis
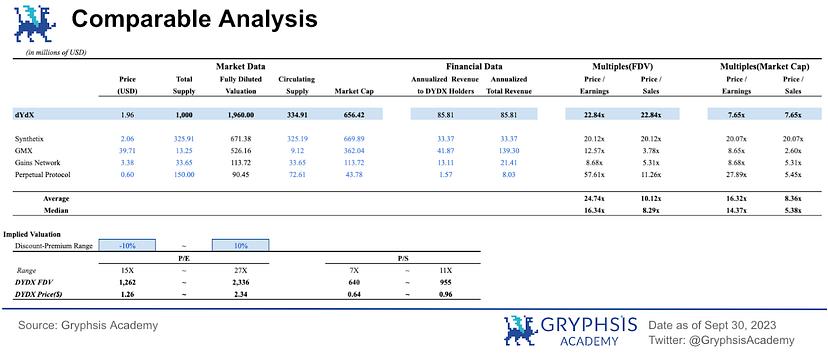
The chart above shows valuations and token prices based on P/S and P/E ratios. Using data from January to September 2023, we annualize total fees and net income. dYdX’s estimated annualized revenue is $85.81 million, indicating strong revenue generation. Moreover, dYdX’s P/E ratio is lower than the average of selected decentralized derivatives protocols, suggesting potential undervaluation. Based on P/E, the implied DYDX price ranges between $1.26 and $2.34.
3.3 Comprehensive Analysis
Finally, we perform sensitivity analysis on key DCF variables to derive the final valuation range.
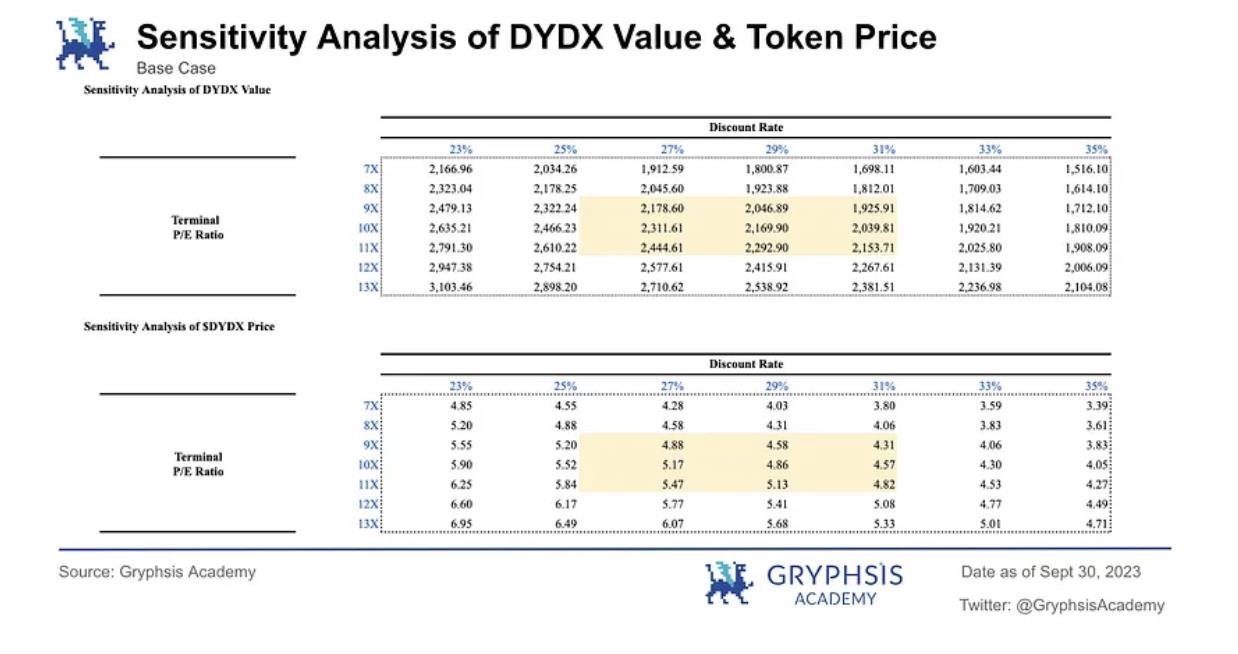
We take the maximum and minimum probability-weighted DCF valuations across different terminal P/E and discount rate assumptions from the sensitivity analysis. Given differences in value capture and tokenomics among the five comparables, we assign greater weight to P/E-based valuation (40%) to improve accuracy, while P/S retains some relevance (10%). Thus, the total weight for comparable analysis is 50%. The remaining 50% is assigned to the weighted DCF valuation. The final composite analysis yields a DYDX token price range of $2.99–$4.12, with a fully diluted valuation (FDV) range of $2.993–$4.118 billion.
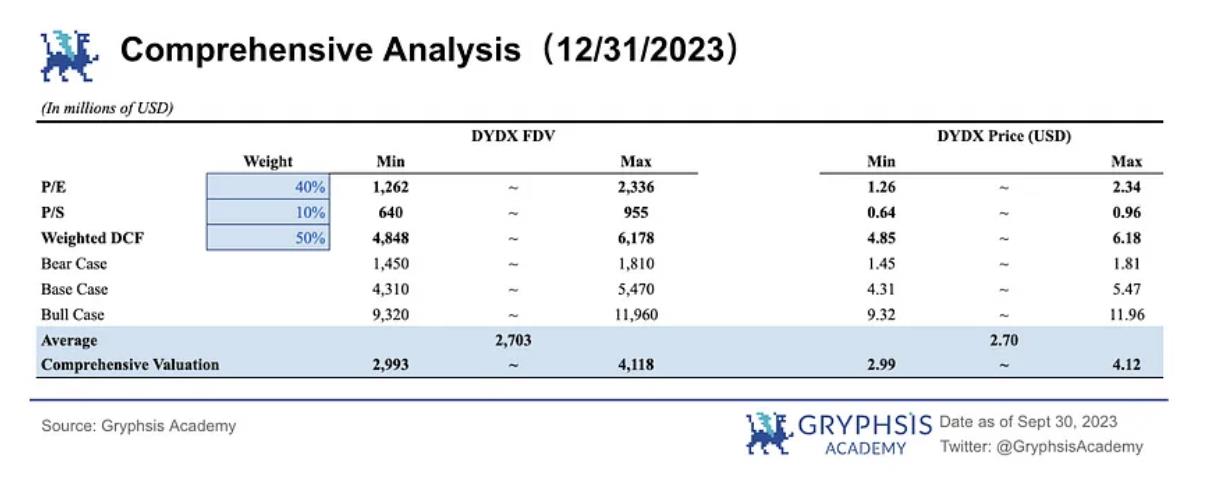
Since DCF produces higher valuations, thereby lifting the overall composite estimate, we believe the most significant aspect of v4’s economic model upgrade—the shift of trading fees from dYdX Inc. in v3 to 100% distribution to staking nodes—creates substantial room for cash flow accrual to token holders. This growth potential justifies higher valuation multiples, meaning average P/E and P/S benchmarks from comparable protocols may understate DYDX’s true value.
The valuation model and derived token prices are based on currently available data and market conditions. Actual market dynamics and dYdX’s operational performance will ultimately determine its real market value.
4. Unlock Analysis
4.1 Valuation Premium
A noticeable valuation premium exists in dYdX’s valuation, primarily due to limited liquid supply caused by staking. As the L1 token of dYdX Chain, DYDX is used for both fee payments and validator staking to secure the network. Currently, the average staking rate across PoS networks is 52.4%. Given that established PoS chains like BSC and Solana maintain long-term staking rates between 40%–70%, dYdX Chain’s staking rate is highly likely to exceed 40%. This would significantly reduce circulating supply, driving the token price upward if demand remains constant.
4.2 Staking Yield Estimation
In December, dYdX will unlock nearly 150 million tokens (~15% of total supply), increasing circulating supply from 296 million to 446 million. Given the scale of this unlock, market participants may worry whether it will cause short-term inflation and dilute the benefits from v4.
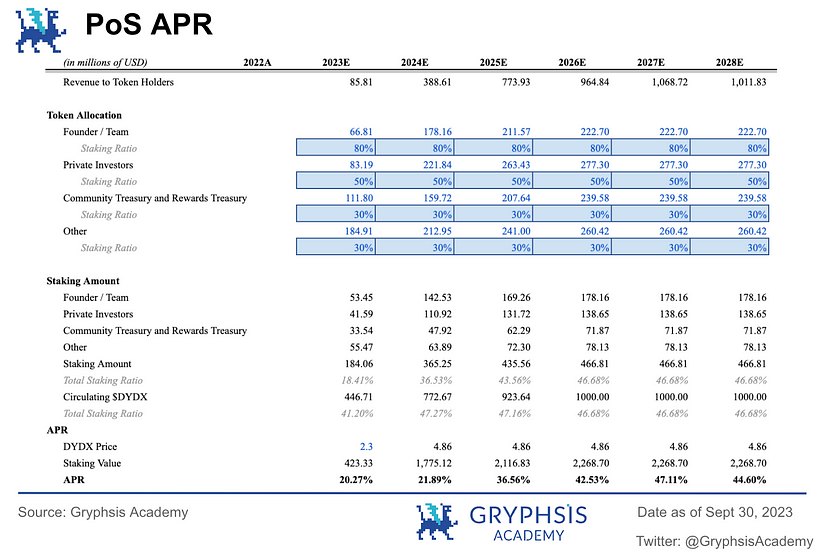
However, we believe the December unlock should not be a major concern. The reason is that a large portion of newly unlocked tokens is unlikely to flood the market. These tokens are allocated to team members and investors, who are highly likely to stake most of them. Typically, during early stages of PoS chains, staking rates are low due to risk concerns, resulting in high initial APRs. As the network matures, staking rates rise. Currently, the average PoS network staking rate is around 52.8%, with average yields at 10.2%. Based on this, we estimate dYdX Chain’s staking rate and APR (see chart). According to our valuation model, dYdX’s 2023 revenue is $85 million. Assuming teams and investors stake 80% and 50% of their unlocked tokens respectively, we estimate an annualized staking yield of 20.27%, with a staking rate of 41.2% (based on circulating supply). The staking rate is expected to gradually increase annually, stabilizing around 46.68%. If the price aligns with our base case valuation, the annualized yield could rise to ~44.5% over five years, offering attractive returns. Therefore, we conclude that teams and investors are likely to stake their tokens, minimizing sell-side pressure and dilution risk from the year-end unlock.
5. Conclusion
-
This report adopts a top-down approach, using DCF analysis to estimate dYdX’s protocol value and token price. Through probability weighting, the protocol valuation stands at $2.445 billion, with an expected $DYDX price of $5.48—representing 2–3x upside potential. Combining P/E and P/S valuation methods, the comprehensive analysis suggests a year-end 2023 DYDX price range of $2.99–$4.12. Compared to current market prices, DYDX still exhibits meaningful upside potential.
-
Regarding the potential dilution risk from the December token unlock, we argue that since the majority of unlocked tokens go to team members and investors—and given strong staking incentives on dYdX Chain with annualized yields exceeding 20%—these tokens are likely to be staked rather than sold, minimizing market sell pressure.
Join TechFlow official community to stay tuned
Telegram:https://t.me/TechFlowDaily
X (Twitter):https://x.com/TechFlowPost
X (Twitter) EN:https://x.com/BlockFlow_News
 @gryphsisacademy