Where Is the Ethereum with a Total Circulating Supply of Over 120 Million Held?
TechFlow Selected TechFlow Selected
Where Is the Ethereum with a Total Circulating Supply of Over 120 Million Held?
As an alternative to Ethereum that significantly reduces transaction costs, L2 has shown no signs—at least for now—of撼动 Ethereum's dominant position.
 Navigating Web3 tides with focused insights
By Babywhale, Foresight News
The current total circulating supply of Ethereum is about 233,000 ETH above 120 million. These over-100-million tokens are now scattered across various corners of the Web3 world—exchanges, DeFi platforms, cross-chain bridges, Layer 2 networks, non-EVM blockchains, and even in wallets held by hackers who dare not move them for fear of being traced.
We’re constantly flooded with data every day: cross-chain Ethereum on some new L2 hitting record highs, exchange reserves at all-time lows. But has anyone ever considered how these ETH are actually distributed? Where do Ethereum tokens really love to go?
A user on X platform deeply obsessed with Ethereum, known as Eth Wave (@TrueWaveBreak), put together a statistic that can’t be said to miss a few things—it’s more accurate to say it's completely incomplete. While this analysis overlooks significant flows such as many WETH movements and ETH exiting the EVM ecosystem, it still broadly sketches an informative picture of Ethereum’s distribution:
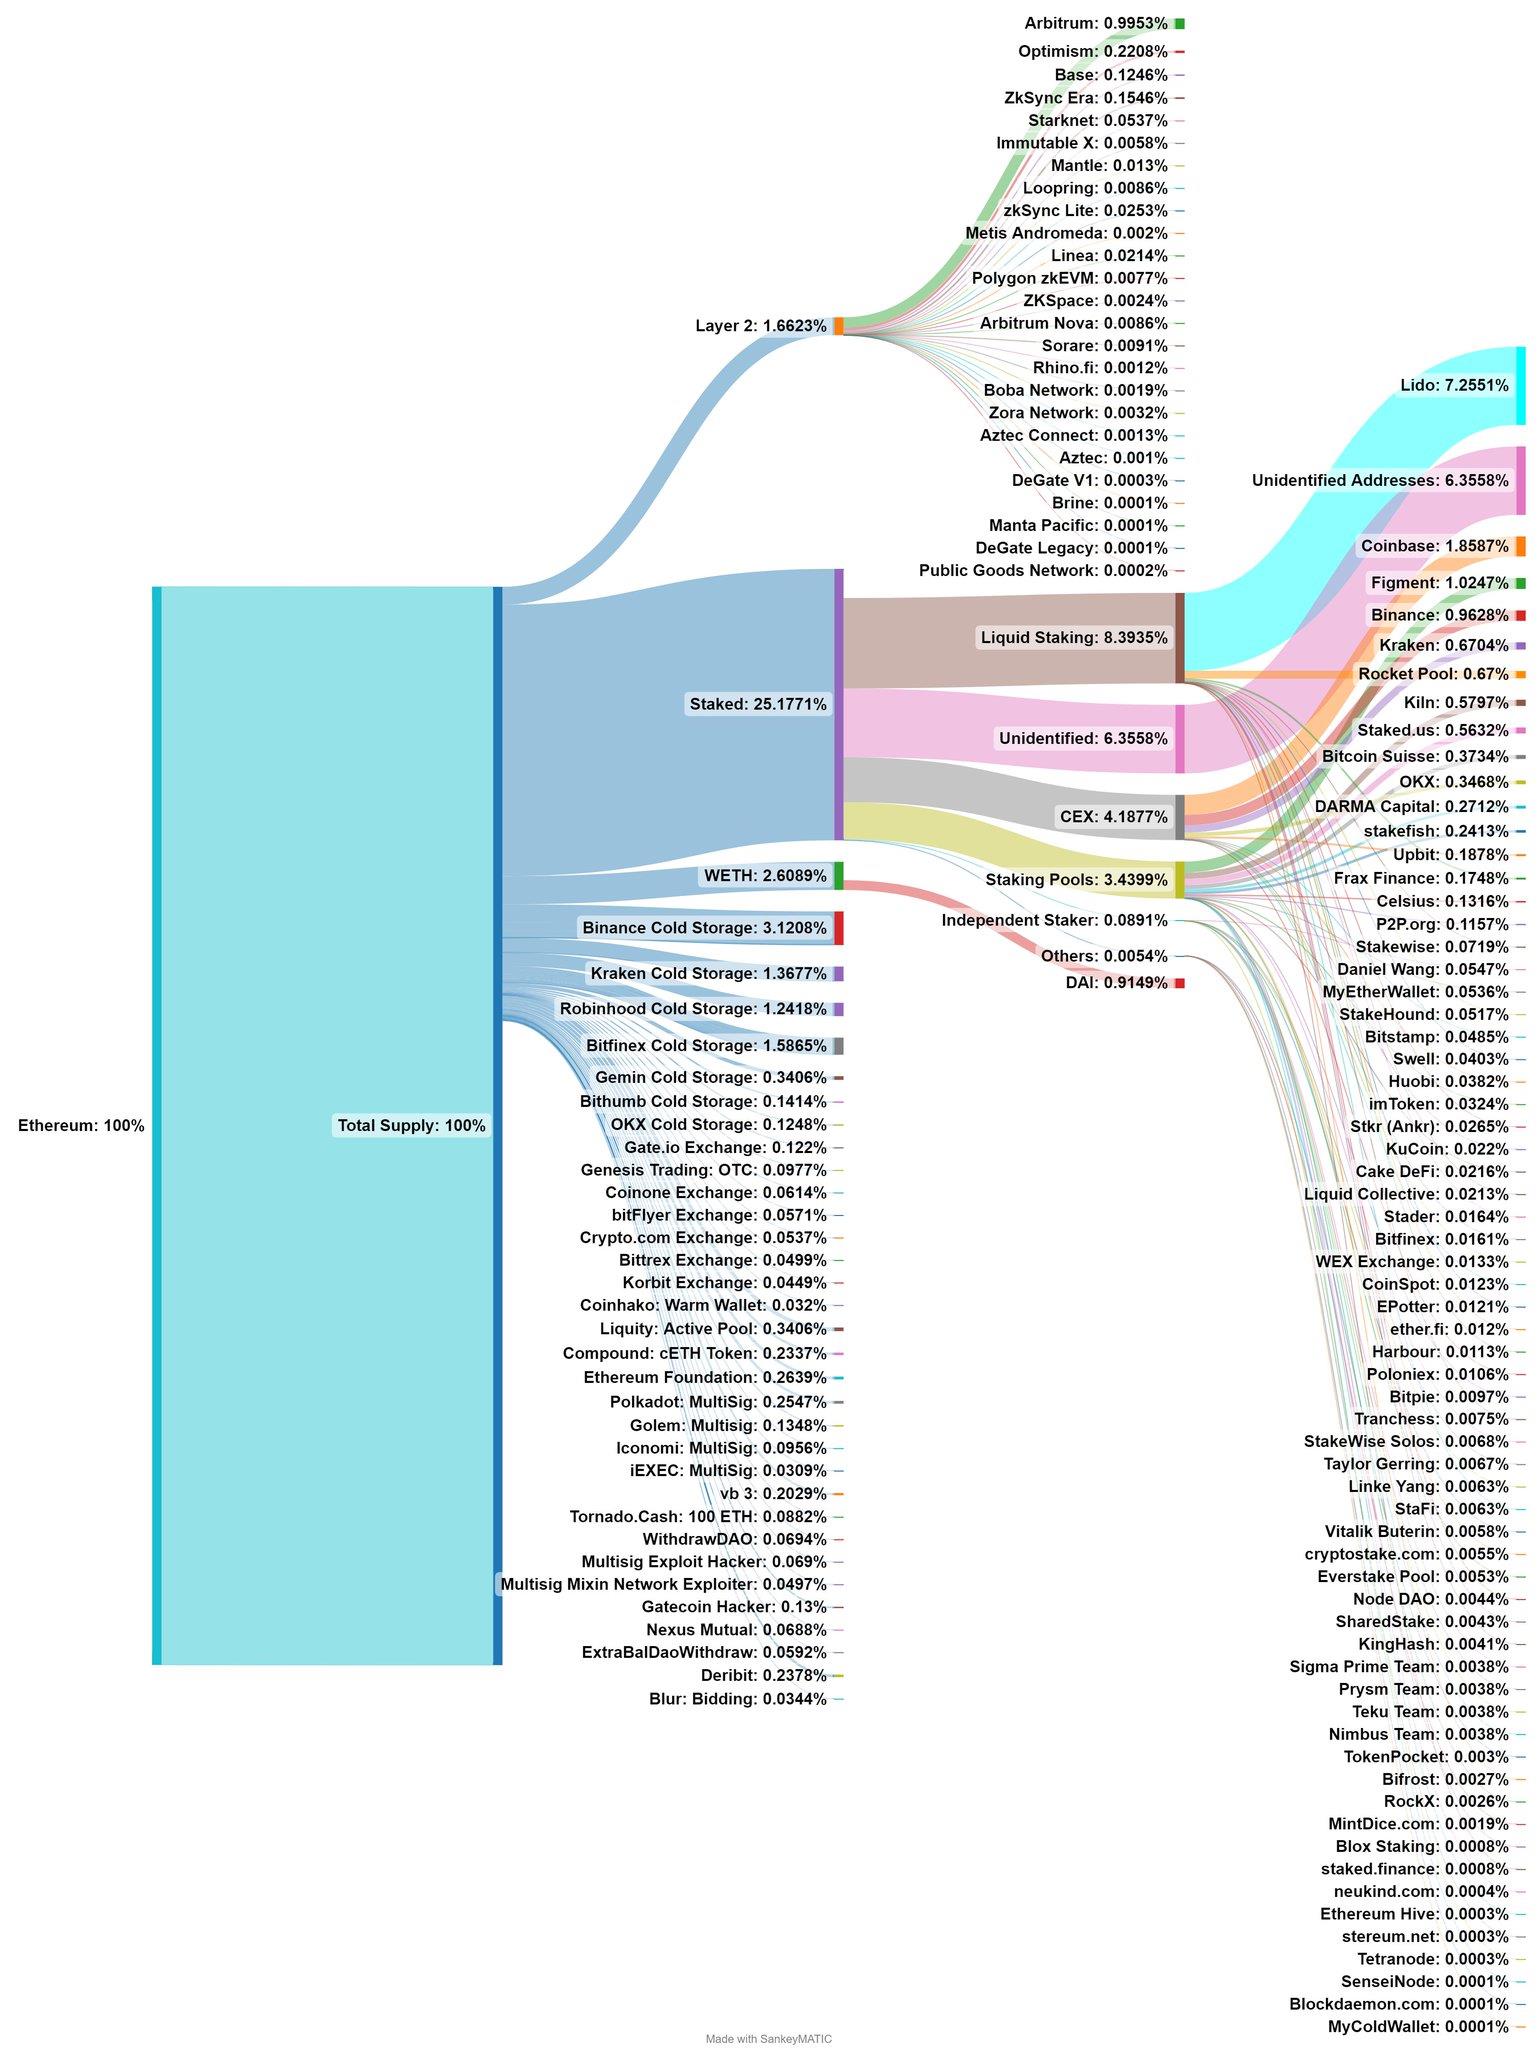
There are several interesting data points in this chart worth discussing individually.
ETH on L2s accounts for less than 2% of total supply
According to the chart, ETH on all L2s makes up approximately 1.66% of the total circulating supply, roughly 1.992 million ETH. At the time of writing, this amounts to a total value of $3.223 billion, representing 30.87% of the $10.44 billion total value locked (TVL) across L2s.
The ranking of L2s by ETH holdings in this chart closely mirrors the TVL-based rankings on L2BEAT. Aside from the two giants Arbitrum and OP Mainnet, Base’s recent growth has caught many off guard, surpassing earlier mainnet launches like zkSync Era and Starknet in terms of TVL.
Nevertheless, despite their strong performance, L2s collectively hold only slightly more ETH than Bitfinex’s cold wallet—and about half of Binance’s cold wallet holdings.
From this, we can conclude that L2s—despite being touted as cost-effective alternatives to Ethereum—have yet to show any sign of challenging Ethereum’s dominant position. This may be due to the relatively small base of users comfortable navigating asset transfers across chains, or because many irreplaceable applications still reside on the Ethereum mainnet.
CEXs remain the primary battlefield for ETH liquidity
Based on the data listed, identified exchange holdings of ETH exceed 7%. When factoring in smaller exchanges worldwide and potentially unidentified exchange addresses, the total ETH held on centralized exchanges (CEXs), though in a continuous decline in recent years, could still approach or even exceed 10%.
This suggests that CEXs remain the main hubs for ETH liquidity. The so-called "illiquidity" we observe in market movements may not stem from actual lack of liquidity, but rather from reduced trading activity—most holders may simply be staying put.
Additionally, institutions like Robinhood, which aren't crypto-native but offer cryptocurrency trading, should not be overlooked. Entities such as Grayscale, not mentioned in the chart, are reported by blockchain analytics platform Arkham to hold 3.03 million ETH in its Ethereum trust—over 2.5% of the total circulating supply.
Hacker-held ETH cannot be ignored
The chart also lists ETH holdings of certain hackers, including those behind attacks on Polkadot multisig wallets, Mixin, and Gatecoin. Others, such as the notorious North Korean hacking group Lazarus Group, aren't shown—possibly because they’ve already funneled stolen assets into mixers like Tornado.Cash or dispersed them across multiple addresses, making full identification difficult in the short term.
Staked Ethereum
Staked Ethereum already accounts for over 25% of the total circulating supply, and this figure is likely to keep rising in the foreseeable future. Among staked ETH, one-third is deposited into liquid staking protocols, and of that third, over 86% is held by Lido. While centralized exchanges have entered this space by launching their own liquid staking tokens (LSTs), they remain far less popular than decentralized protocols—current staking volumes are only about half of those in LSD protocols.
Liquid staking is a sector far more complex than it appears—not merely issuing tokenized representations of staked positions. Key challenges include enhancing decentralization to mitigate risks, lowering the minimum ETH required for participation, and leveraging LSTs to secure other networks through restaking—all areas worthy of deeper exploration.
On the flip side, liquid staking is essentially a leveraged activity. Using LSTs as collateral for borrowing, and various LSD protocols issuing decentralized stablecoins backed by LSTs, further amplify leverage. If these markets grow large enough, during future extreme market conditions, there may not be sufficient liquidity to liquidate these positions—a risk we must prepare for in advance.
As the author himself notes, this chart is far from complete—omissions include WETH on exchanges and L2s, DEXs, and major DeFi protocols. For instance, only Compound’s cETH and DAI minted via WETH collateral (MakerDAO) are shown; others like Aave, Curve, and Uniswap are not included. The author plans to continuously improve the chart and looks forward to uncovering more insights from a more comprehensive version in the future.
Join TechFlow official community to stay tuned
Telegram:https://t.me/TechFlowDaily
X (Twitter):https://x.com/TechFlowPost
X (Twitter) EN:https://x.com/BlockFlow_News
 Foresight News