Mixpanel创始人:如何衡量你的产品?
TechFlow Selected TechFlow Selected
Mixpanel创始人:如何衡量你的产品?
Users are the people who use your product, and they are important regardless of whether they have paid or taken any other action within your product.
Compiled by TechFlow
Note: This article is part of the TechFlow series "YC Startup School Chinese Notes" (updated daily), dedicated to collecting and organizing Chinese translations of YC courses. This sixth installment features the online course "How to Measure Your Product" by Suhail Doshi, founder of Mixpanel.

About Mixpanel
In my view, users are people who use your product—regardless of whether they’ve paid or taken any specific action—they’re still important within your product ecosystem.
I founded a company called Mixpanel. The first line of code was technically written in October 2008. I was about 20 years old at the time, building the startup from my parents’ bedroom. Ten years later, we had around 300 employees, raised significant funding, served approximately 7,000 paying customers, and generated nearly $100 million in annual recurring revenue.
Mixpanel primarily offers these key metrics:
Trends: How often did the user behaviors you care about occur, and what percentage do they represent?
Funnels: What is the retention and drop-off rate at each step of key user actions?
Cohorts: How active are your website users? This helps distinguish loyal users from casual ones.
People: What specific actions has an individual user taken on your site, and in what sequence?
Beyond that, Mixpanel can also help make decisions such as:
- Tracking where new users come from when running multi-channel ad campaigns, comparing which channel performs best;
- Identifying which browser versions users are on and ensuring compatibility;
- Measuring new user sign-ups across provinces or cities during offline events, comparing regional sales team performance.
What Matters Most to You?
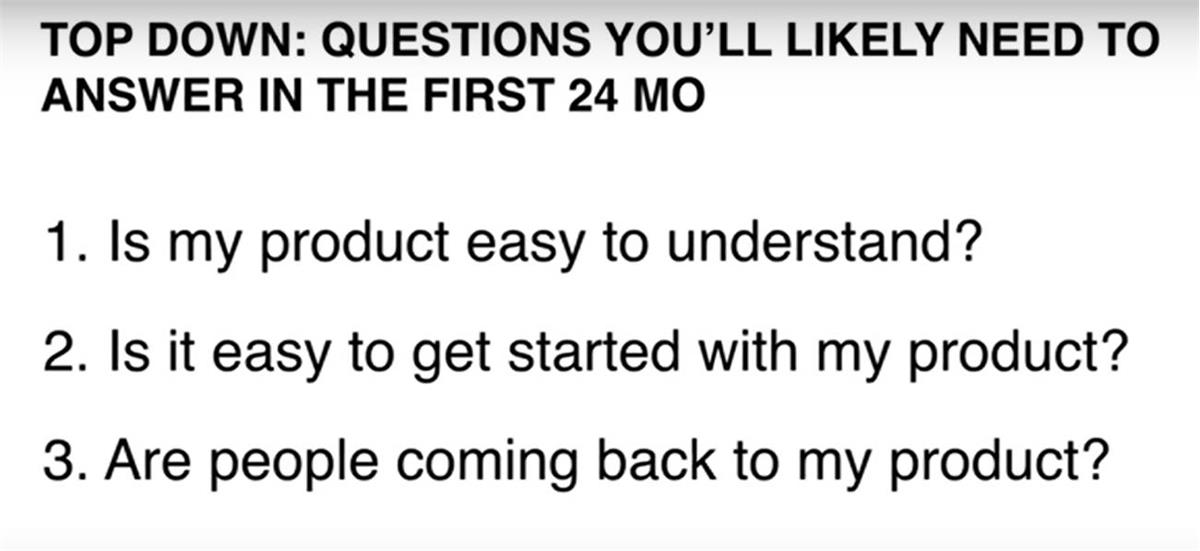
I believe thinking through problems top-down is more effective than getting lost in charts, visualizations, and numbers. To truly solve issues, you need complex analysis and calculations—temporarily setting aside surface-level observations. When starting my company, I focused on three things:
- First, getting people to know what I’ve built—this requires changing many things;
- Second, whether the product is easy to use for first-time users—an endless mission, but one you must accept;
- Finally, whether people will come back and use my product again.
I want to emphasize that fundamentals are crucial—even household-name companies often make basic mistakes. Overcomplicating things is a common pitfall, especially regarding how many things you choose to measure and track.
All data is contestable. By selecting just one or two key metrics, you can effectively monitor and evaluate team performance without overcomplicating things.
The Formula
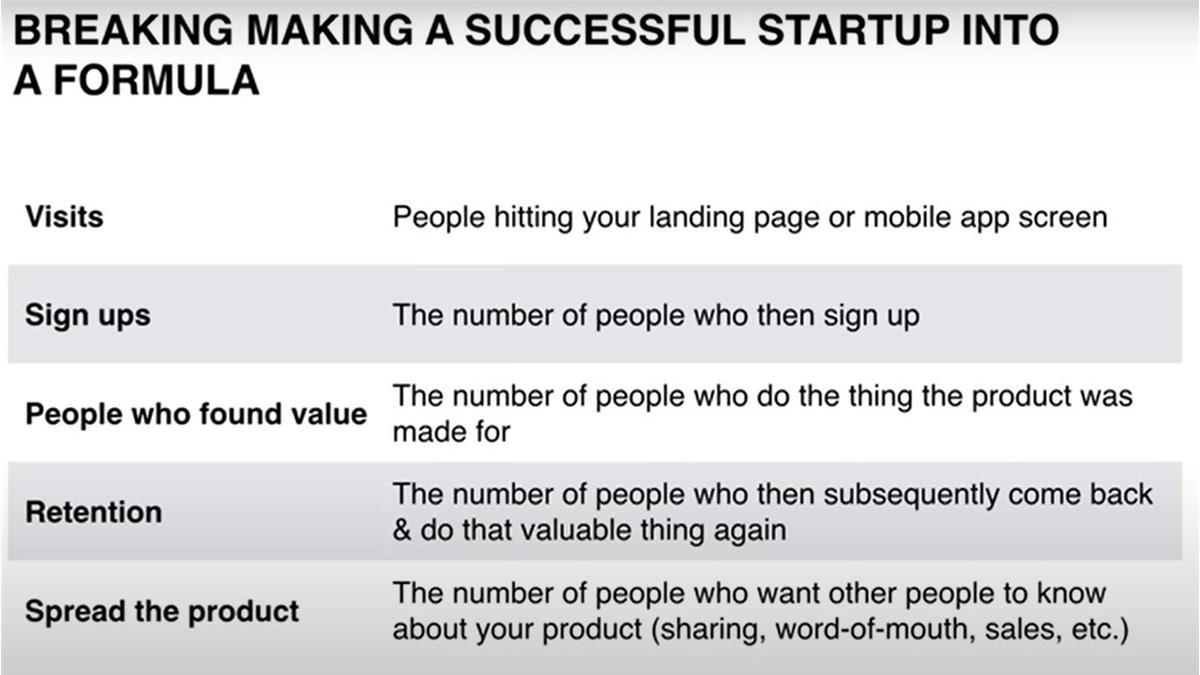
With this formula, you can assess any issue within your company. For example, if your landing page is too cluttered, you can use the formula to diagnose why. Similarly, if the signup process is too difficult, the formula helps explain why. If your product simply isn’t appealing, applying the formula reveals the root cause.
The simplicity of this formula makes it ideal for diagnosing early-stage growth problems. But over time, you may need deeper analysis—for instance, when landing page views suddenly drop, you might segment data by country to identify the source.
This formula essentially addresses three core questions: How to make your product easy to understand, how to get people to return, and how to retain and spread the product.
Even massive companies like Airbnb never finish optimizing every step, because competitors keep improving too.
By measuring these five metrics and evaluating where problems lie, you gain leverage and can take action accordingly. Forming a dedicated team to tackle these issues can be very helpful.
Is My Product Easy to Understand?
Poorly designed landing pages can cause users to lose interest in your product. Therefore, we must avoid letting users retreat back to their previous state.
We continuously refine our design and messaging. We try to lead with benefits, using customer case studies to showcase our product’s strengths. But the real challenge is: how do we measure whether people actually understand and use our product?
Signing up doesn't mean users will actually use the product. We must ensure users engage meaningfully and derive real value. Thus, we must constantly adjust and improve our product design to create something genuinely valuable.
Is My Product Easy to Get Started With?
If the first step is hard, many users will give up early due to excessive effort. So we should focus only on features that deliver real customer value—not include every cool feature imaginable. If the first step fails, the entire journey collapses.
Ideally, users should be able to immediately use your product—just search for it on Google, no registration or CAPTCHA required. This is similar to Airbnb. However, Airbnb might require users to complete around 10 steps or so. We worked with Airbnb for a while to optimize their first-time user experience. The key to improving UX lies in helping users start using the product as quickly and easily as possible. Thus, Airbnb had to solve two main problems:
- How to describe the service and its value;
- How to help users begin using the product.
Airbnb's onboarding is simple: fill in basic info, then click search. It’s just the first step—but it’s the essential starting point. Getting the direction right is the hardest part, requiring lots of work and iteration. To measure initial user experience, funnel analysis can track conversion rates from landing page to signup to performing a meaningful action (e.g., at least one search on Airbnb). Speed is also critical—it reflects how complex the user experience feels. When optimizing UX, be careful not to make things worse. For example, email or SMS verification might cause user drop-off. Iterating the initial user experience is vital—and an endless process.
Ultimately, letting users into the product as early as possible is better—but not all companies or products can do this. Pinterest, for instance, requires registration. While users may have resisted this before, now it’s become normalized, and there are good reasons for it.
Will People Come Back to Use My Product?
In startups, don’t overlook user retention. I believe this is one reason many companies—even those with millions of users—eventually fail.
I’ve seen 15 different companies experience pathological growth followed by bankruptcy.
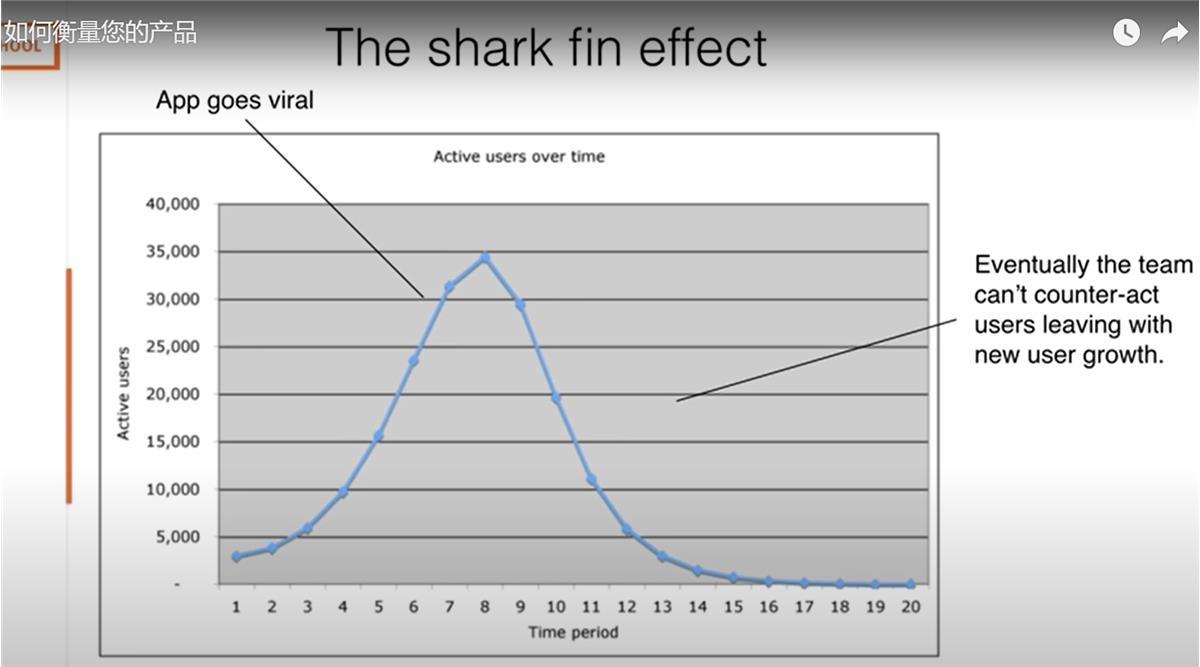
Let me illustrate this with a chart—I call it the “Shark Fin Effect.” The name comes from the default blue line color of the first data point in Mixpanel, which resembles a shark fin cutting through water.
If you discover a way to go viral—spreading widely on Facebook, Instagram, or other platforms—you’ll feel elated, believing you’ve struck gold, gained massive users, and secured your fortune.
However, if you acquire huge numbers of users too early without considering retention, this growth becomes extremely dangerous and could harm your company. Essentially, the app spreads like a virus, but you lose users faster than you gain new ones.
We must stay alert: when an app starts gaining popularity, it’s hard to resist the urge, always thinking, “I must capitalize on this moment, or my competitor will beat me to it.”
Then we remain in constant optimization mode, only to realize later that our efforts created little lasting value—because if you lose all your users, reactivating them is incredibly difficult. If you attempt reactivation, you’ll find it’s usually not a good idea.
You need to let users leave and wait until they’re ready to come back on their own. Wrong approaches—like repeatedly emailing or pushing them to return—can make things worse. The Shark Fin Effect is truly dangerous. LivingSocial is a prime example.
Though few remember it today, it once dominated Facebook, competing with Groupon, Deal Cutting, and others. But due to poor retention, it was eventually forced out of the market.
Ways to Measure User Return
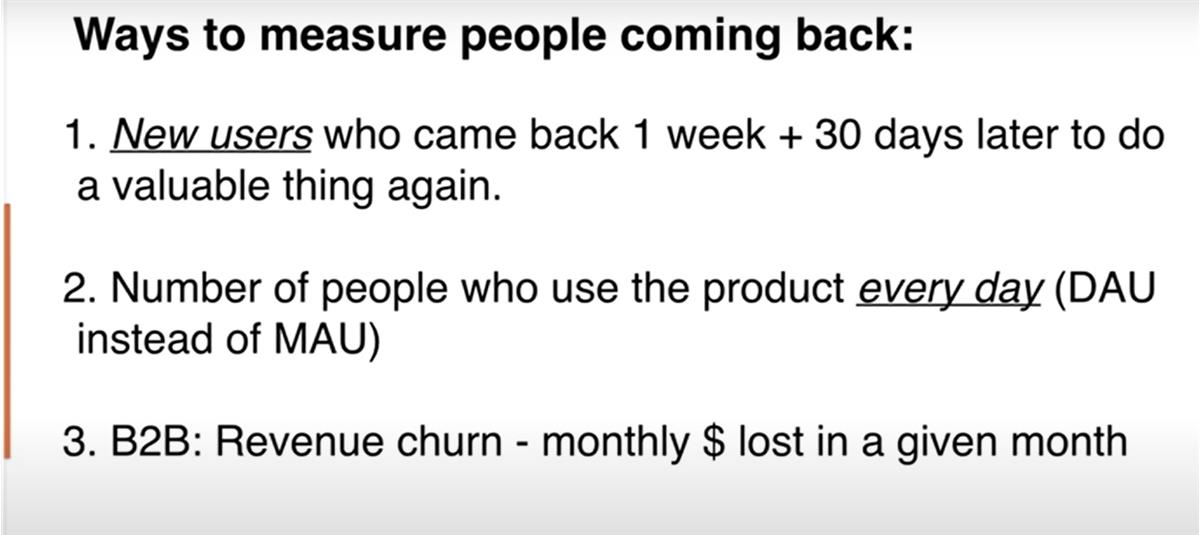
First, track brand-new, recently registered users and calculate their return rate after one week or 30 days. Also important is tracking over longer periods, since one-week data can be loose. Crucially, pay attention to the speed at which you lose users, so you can promptly develop new strategies and improvements. As your user base grows, watch closely for signs of the Shark Fin Effect.
The second metric is Daily Active Users (DAU). Some may disagree, but I think Monthly Active Users (MAU) has become a new BS metric—just like total registered users. Seven or eight years ago, LinkedIn announced “We have 200 million registered users,” but who cares how many people are merely registered? Now, people like MAU are moving closer to DAU.
Maintaining DAU is tough. Think about how many apps you actually use daily. If you just glance at your phone and browse possible apps, how many do you really use each day? I consider this a very strict benchmark, which we discovered at MixPanel. Even B2B companies might wonder, “Well, my sales cycle is long—can I really sustain daily active usage, especially on weekends?” In reality, there’s a strong correlation between daily usage and churn—when people stop using the product, they eventually stop paying.
Third is revenue churn. Again, monitor how fast you’re losing users to adapt quickly. Reactivating lost users is extremely difficult. There are basic methods here. The most obvious is tracking newly registered users and measuring their return rate after one week or 30 days. Longer-term tracking matters too, as one-week data provides only a rough picture.
Issues related to daily usage and churn deeply affected us in MixPanel’s early days. So we needed to explore solutions—through product changes or pricing models. What would your growth rate be if customer churn stayed constant? This is critical for all B2B companies.
What If You Have Fewer Than 50 Users?
I think the best approach is talking directly to your users—that’s how you gain deeper understanding. Let me share a small story about our Mixpanel journey.
At the beginning, although we didn’t have real users yet, we had mockups and dashboards that looked compelling. I used a trick: I put about 10–12 potential customers into instant chat sessions, just like normal conversations. I’m not sure what tools kids use today—maybe something else—but I simply wanted to hear their thoughts, ask what interested them, and run quick surveys.
We tried redesigning our funnel UI. Initially, we used a vertical funnel, while competitors used horizontal funnels, which seemed more intuitive. But we didn’t know how to gather data on which version users preferred, so we made a crude version—a horizontal funnel, like a grayscale test. I asked 11 people which funnel they liked better. Ten chose the horizontal one. So we went with it—and it was a smart move.
Talking to customers gives you far deeper, richer insights than staring at data charts. No matter how sophisticated your data analysis is, nothing beats direct conversations with users to understand their thoughts and needs.
In analytics, overcomplication is a common mistake. People think they need to track countless metrics, tasks, and loads. But I believe you should pick just a few key metrics and monitor them simply. For example, choose one North Star metric—the number your company would bet everything on—and spend six months focusing on it. You can change it later if needed, but keep it simple. Don’t try to track too many metrics—three to five key ones are enough.
What Are Good Benchmarks?
At each stage—visiting, registering, using the product—there’s potential to establish solid benchmarks. For B2B businesses, the benchmark often resembles the conversion rate from visit to registration. I think a 4% to 5% conversion rate is quite good.
For sites like Airbnb, it’s about landing on the page and searching for your first booking spot—it really depends on the business model.
Mixpanel publishes many benchmark reports on its blog—marketing teams love sharing benchmarks across industries: gaming, e-commerce, B2B, social, video, etc. You can find various benchmark reports there, though results always depend on your specific business context.
Landing Pages
To determine which conversion method works best—like social media login buttons versus standard registration—you need fast user validation rather than lengthy, cumbersome processes. Many factors play a role, but they aren’t always clear-cut.
To find best practices, consult friends in non-competitive industries to learn about their conversion rates and experiments. While this data may not be secret, asking direct competitors feels awkward—so discretion is wise.
Sites like Airbnb can stay simple because most people already know what it’s for—that’s why they can keep it minimal instead of adding complexity.
In contrast, Craigslist’s homepage is overly cluttered. Visiting Craigslist feels chaotic.
Even Amazon, despite its massive brand power, could overwhelm users with too much choice. When you visit Amazon, you instantly see millions of products.
So how do these companies balance usability against complexity?
I believe there’s an important guiding principle.
First, define what you're optimizing for. Take YouTube—they can’t recommend videos based solely on preferences like Google does. They must show video-related information and run experiments to discover what truly matters. It’s about understanding which user experience people actually prefer.
If you offer a simple interface but users still feel confused—either because they don’t know how to use it or you haven’t asked them—you need to gather new information.
I believe the key is minimizing what you add—finding the smallest set of content that enables others to get started.
I’m confident companies like Amazon have tested countless homepage designs and ultimately found the optimal version.
Are One-to-Two-Minute Video Tutorials Effective?
I think this is complicated. For example, we created a video tutorial during onboarding, but many people didn’t actually watch it. Companies overly obsessed with user behavior often go too far and end up optimizing odd things. Even if you make a button brighter and bigger, users still won’t be satisfied in the end.
I noticed many people just randomly clicked around like browsing side menu options. My hypothesis: they hadn’t integrated Mixpanel yet, so there was nothing to see. So what were they doing? Just clicking funnels to preserve data—but why? I assumed they were curious, wanting to explore features and see what they could do. So we ran an A/B test. One version had no similar controls—just let people click around and see some images.
Another version included video-like content. We wanted to see what drove integration adoption and measure first-integration conversion rates. The video-like option performed exceptionally well.
Actually, we ran an even simpler test: we just sent people a video saying, “Watch this, super basic,” without implementing anything on the site—and we got amazing conversion rates. Then we decided to embed the video on all tabs, but surprisingly, it made no difference.
So my point is: it really depends. What matters is running experiments to form and test hypotheses. Art is not science—measurement is science. Only through measurement can you verify whether your assumptions are correct.
User Retention vs. Dollar Churn
There are two distinct scenarios here: one is user retention, the other is dollar churn. In cases of sharp dollar decline, the reason is often that companies continue paying even when no one uses the product. This creates incentives to cut costs—both for the company and employees managing budgets. Regarding dollar churn, many situations exist. For example, in B2B companies, even if only one person uses the product, the whole company may keep paying—so you might see 40% user retention. While spending continues, losing 40% of revenue annually is unsustainable and harms company retention. Note: these metrics aren’t directly linked.
For frequently used apps like chat tools, retention typically ranges from 60% to 70%. Apps like Slack may reach 80%—among the highest.
For products like MixPanel, first-year retention is usually only 30% to 40%—not ideal.
Hardware startups should track four key metrics, similar to what you’re building. Most hardware companies include software components, as devices connect to the internet and require data tracking. Data tracking may be harder for hardware firms, but it’s entirely feasible.
For goal-setting, apply benchmarks across company sizes, adjusting based on market characteristics and other inputs. Early on, you may not clearly know your customers, but over years, user conversations provide clarity. Our earliest customers were small businesses.
How to Ensure Product-Market Fit and Recognition?
It took us less than six months to realize we couldn’t land large enterprises—our product wasn’t viable in the market yet, and we lacked development time. Only risk-tolerant companies would consider partnering with us, and most such small businesses were fragile in other areas, making them more open to trying new products.
In such cases, if the target company has little to lose and is willing to take risks, I often use this tactic: charge them, and if they refuse, offer it free—because feedback is invaluable. We wanted to know if anyone would pay, but ultimately found only small businesses were willing to try.
We didn’t build the product solely to attract new users—we also developed specific features focused on retaining existing ones. We believed certain features would make a real impact and offered clear advantages over alternatives. For example, password reset might seem minor, but repeated requests are annoying; without it, users can’t log in—so we had to build it.
Even though MixPanel initially skipped the “forgot password” feature, after 12–18 months, we saw users failing login attempts multiple times, seeing the login screen up to five times. It reminded us of banking services—people are used to retrying several times. But even without the reset feature, we eventually adopted alternative retention tactics, like Facebook’s method: send an email after three failed logins to help users regain access.
Ultimately, retaining existing users became our primary goal—not just acquiring new ones.
How to Measure Product-Market Fit?
This is a crucial question. I believe both qualitative and quantitative methods work. Qualitatively, see if users would recommend your product to friends—that’s usually a strong signal.
Quantitatively, measure user memory—what percentage of users return after one week or 30 days, similar to DAU. You can also define strict usage criteria—e.g., a user must watch 5 videos per day to count as active.
Finding the right metric is critical. Use industry averages as reference, but aim to exceed them. If your product outperforms benchmarks, you likely have solid product-market fit.
For greater precision, consider overall and frequent usage rates. Overall usage shows repeat engagement; frequent usage filters high-quality users more strictly.
In summary, rigorous measurement is essential for assessing product-market fit. Currently, MixPanel’s retention is only 30–40%, indicating we haven’t fully achieved product-market fit and need further optimization.
How to Avoid Overcomplicating Product Development?
After running MixPanel for about ten years, I realized we often overcomplicate things. We tend to add more features in each release, feeling we’ve solved problems, while ignoring critical metrics like retention and profitability.
The same happens with metrics—we start with three, then grow to 20 or more, thinking it gives better control, but it only distracts and leads to errors. I think this is a common founder mistake—getting distracted, unable to focus on boring but vital tasks.
We must learn to focus, challenge ourselves, and not give up easily. Sometimes we need more time to perfect a product instead of rushing out new ones. We need balance—avoid over-optimizing and bloating features, instead focusing on solving real user needs.
In my career, I’ve made mistakes—building unnecessary new products, over-measuring and optimizing things that didn’t need it. But I believe we can learn, become more focused, and better aligned with our goals.
Join TechFlow official community to stay tuned
Telegram:https://t.me/TechFlowDaily
X (Twitter):https://x.com/TechFlowPost
X (Twitter) EN:https://x.com/BlockFlow_News