

Searcher, Builder, Validator: Who Is the Ultimate Winner in MEV?
TechFlow Selected TechFlow Selected
Searcher, Builder, Validator: Who Is the Ultimate Winner in MEV?
The MEV market offers a multi-layered revenue cake for builders and validators. While the MEV "cake" is large, it's important to note that the distribution of this "cake" is highly uneven, with a significant portion flowing to relay auctions.
Author: EIGENPHI
Compilation: TechFlow

Studying the complexity of Ethereum's economy reveals fascinating insights into the Maximum Extractable Value (MEV) supply chain. This intricate network of interactions—particularly between builders and validators under the current PBS scheme—can be explored through the Sankey diagram below. The chart serves as a rich data visualization tool for tracing the sources of MEV, some identifiable and others still mysterious. Let’s take a closer look at this data and its implications.
Value Distribution in the MEV Supply Chain
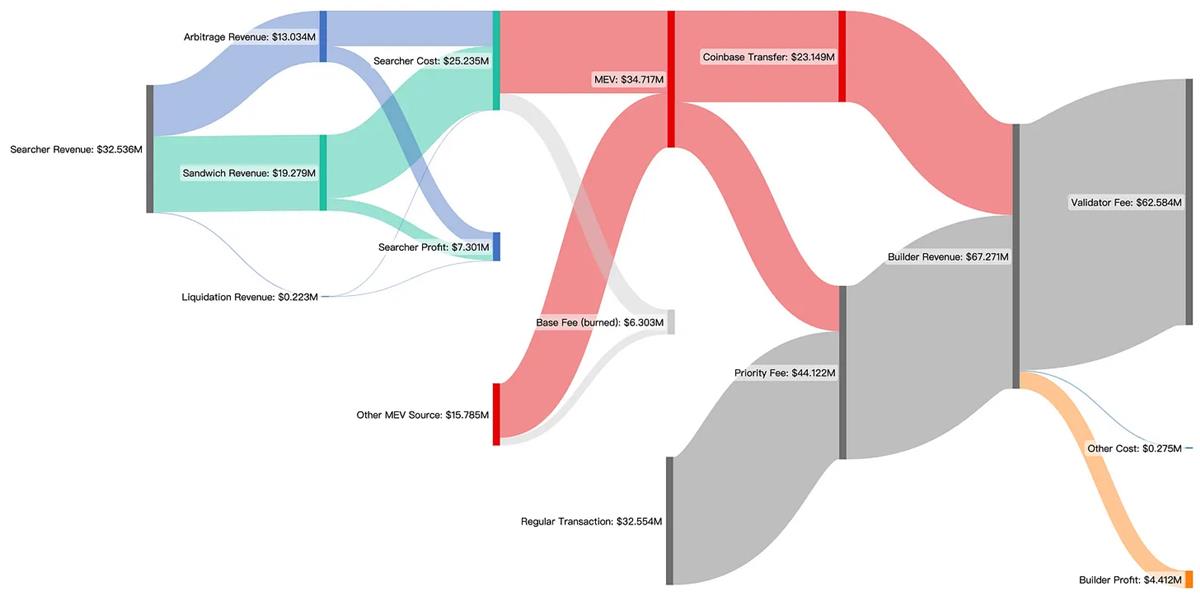
Figure: MEV accounts for 51.6% of builder revenue, with validators being the largest beneficiaries.
The Sankey diagram above illustrates the flow of benefits within the MEV supply chain among different participants—especially builders and validators under the current PBS framework.
The data covers the period from January 1, 2023 to February 28, 2023. During these two months, EigenPhi identified 975,290 transactions involving MEV payments. EigenPhi's algorithm classified 64% of these transactions into three mainstream types of MEV bots. These bots generated $7.3 million in profit and contributed $18.9 million in MEV payments. Among them, MEV accounted for 51.6% of builder revenue, while validators emerged as the biggest beneficiaries.
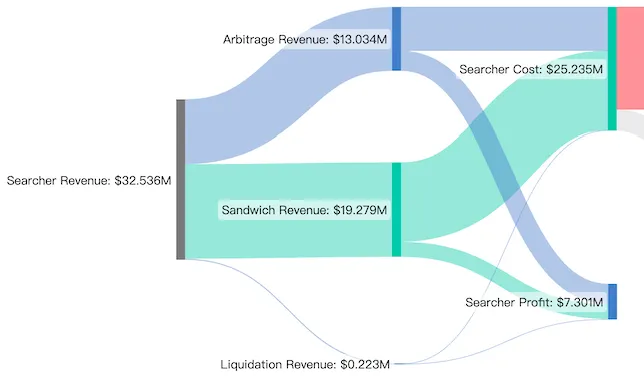
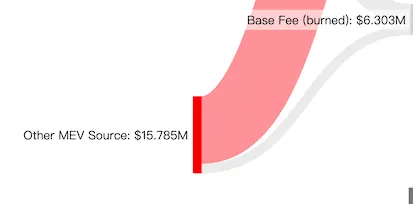
Undefined transaction types make up the remaining 36%, accounting for $15.8 million in MEV payments. These less-defined categories include Just-In-Time (JIT) trading, statistical arbitrage, DEX-CEX arbitrage, and private order flows.
Of the total, $23.1 million was transferred directly to builder addresses via coinbase.transfer(), while the remaining $11.6 million was paid to builders as priority fees.
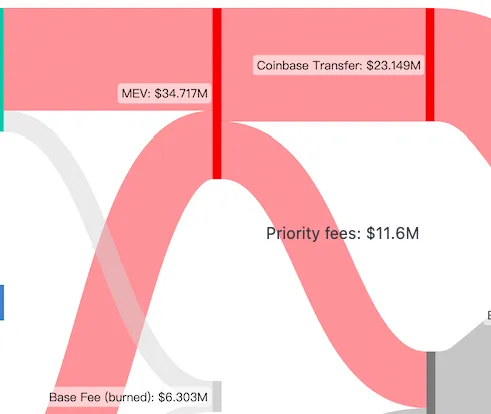
MEV accounted for 51.6% of builder income, with the remaining 48.4% coming from priority fees paid by regular transactions.
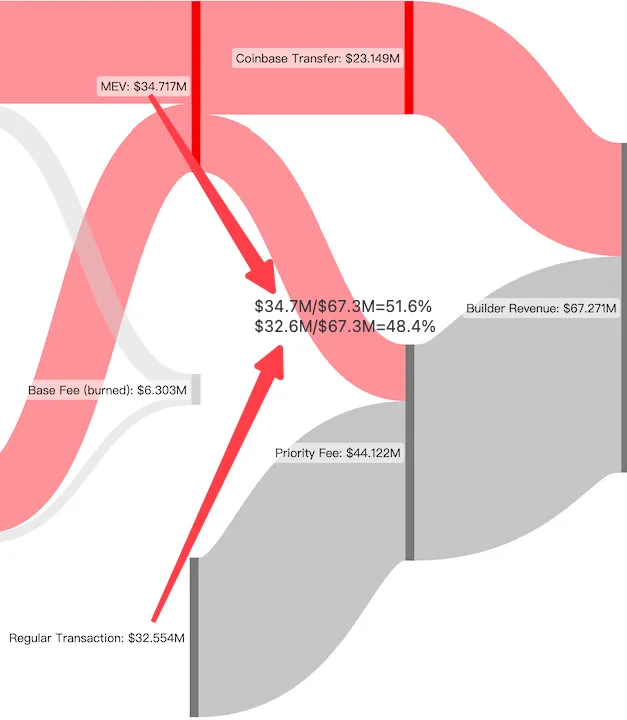

Notably, part of the gas fees paid by searchers and other users is burned as base fees, while the base fees from regular transactions ($2.272 million) are not included in the chart.
However, despite builders earning a staggering $67.3 million in revenue, 93% of it was used to bid in relay auctions to compensate validators, ensuring their blocks were ultimately proposed. As a result, builders' net earnings over these two months amounted to only $4.4 million. Meanwhile, validators earned a total of $62.6 million in the first two months of 2023.
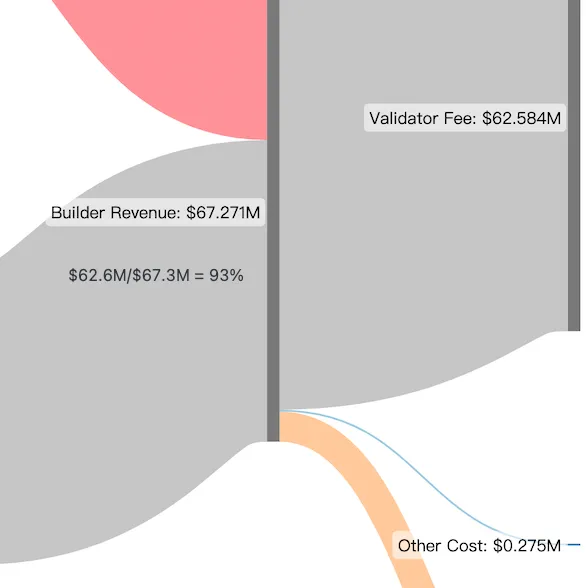
Thus, most of the builders’ revenue is distributed to validators through the relay auction market. Focusing solely on the MEV portion and assuming builders pass all regular transaction fees to validators, 88% of MEV would need to be allocated to validators to ensure successful block proposals.
Oligarchs Capture the Largest Share, Whether Builders or Validators
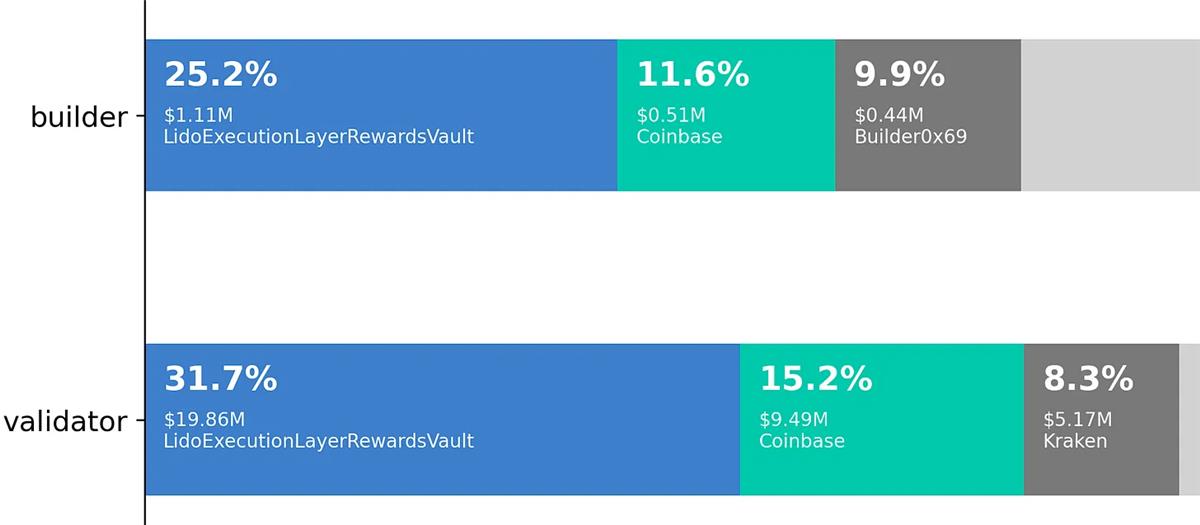
Market competition between builders and validators shows clear oligopolistic effects, with Lido capturing 30% of the market share.
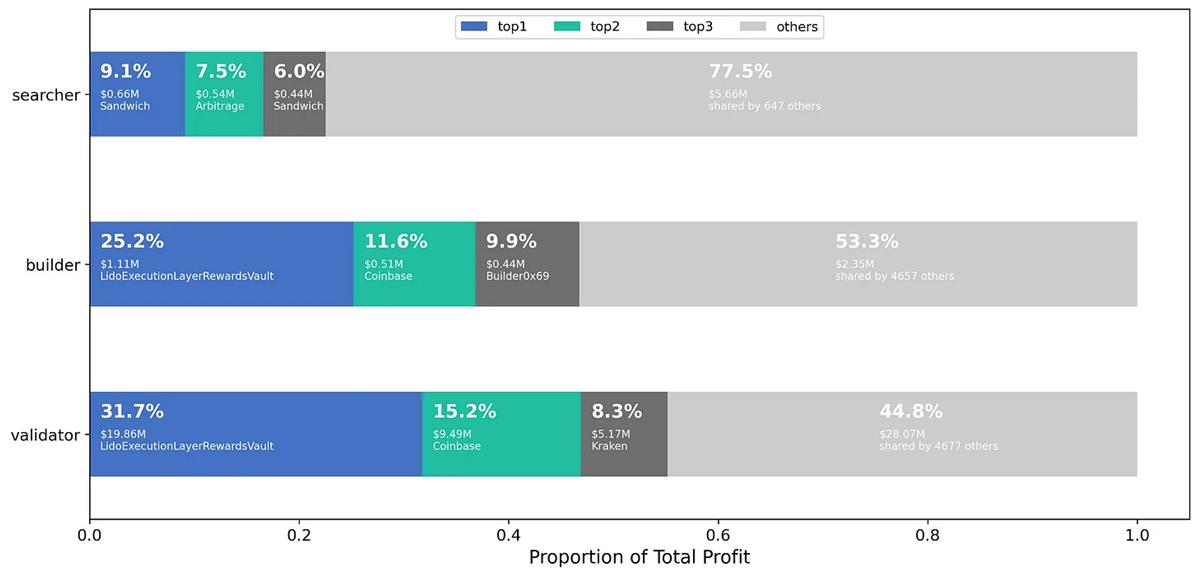
Competition in the market between builders and validators exhibits a clear oligopolistic effect, with the top three players capturing around 50% of total profits. Industry leaders have managed to dominate the market by playing dual roles as both builders and validators. Currently leading the pack, Lido accumulated approximately $21 million in profits over the two-month period, securing a 30% market share. Meanwhile, Coinbase, marked by Mevboost.pics, ranked second with about 15% market share.
Interestingly, Lido’s market share in profits aligns closely with its staking weight and probability of proposing new blocks. According to Dune data, as of May 6, Lido had staked 6,038,112 ETH with 189,000 validator nodes, holding a 31.9% share of block proposal opportunities. Moreover, our on-chain data analysis shows that Lido either proposes blocks directly or wins auctioned blocks from relays at a rate of approximately 30%. Assuming an ETH price of $2,000, transaction fees and MEV generate an estimated annualized return of around 1% for Lido.
The MEV Pie
Finally, as illustrated by the Sankey diagram, the MEV market offers a multi-layered revenue pie for builders and validators. A large portion of the profits has been captured by market leaders such as Lido, who have managed to claim the largest slices for themselves. While the MEV "pie" is substantial, it is important to note that its distribution is highly unequal, with a significant portion flowing into relay auctions.
Given the evident oligopolistic nature of the market and the critical role of MEV income in builder profitability, the future landscape of this space will likely be shaped by strategic decisions made by these leading entities aiming to maintain their dominant share of the MEV pie.
Join TechFlow official community to stay tuned
Telegram:https://t.me/TechFlowDaily
X (Twitter):https://x.com/TechFlowPost
X (Twitter) EN:https://x.com/BlockFlow_News


