When Web3 operations shift from extensive to intensive models, how can one achieve genuine user growth?
TechFlow Selected TechFlow Selected
When Web3 operations shift from extensive to intensive models, how can one achieve genuine user growth?
Pure growth is not the pain point; the key lies in how to improve retention.
Author: SunnyZ
TL;DR
-
Growth in Web3 is becoming increasingly professionalized and refined. Projects that adopt data-driven operations have a significantly higher proportion of high-quality users compared to average projects;
-
Joint campaigns—common in Web3—are effective for growth, but their success depends on how precisely a project can convert its target audience. Four distinct user types require tailored operational strategies;
-
For mature projects past the initial growth phase, sheer user acquisition is no longer the main challenge—retention is key.
Background
Recently, there haven’t been many changes in Web3 growth tactics. However, what’s interesting is the increasing number of collaborative activities among projects. Clearly, individual projects are struggling to grow independently, making mutual traffic exchange a new normal in Web3 growth.
But how effective are these multi-project joint campaigns really?
Do we truly know who our target users are?
How can we track data to uncover real users and improve conversion?
How do we attract whales or KOLs from partner projects to our own?
To find answers, last month I conducted a growth experiment through a joint campaign involving 18 projects, with 20 user-tracking metrics set up, including but not limited to:
Activity Metrics:
-
Time when users joined Discord
-
Discord roles held and quantity
-
Number of messages sent and invites made
Purchasing Power Metrics:
-
Wallet token balances across various types
-
Number of blue-chip NFTs held
Influence Metrics:
-
User Twitter follower count
-
Total views and impressions generated by user retweets, comments, and likes
Loyalty Metrics:
-
Average number of activities participated in
-
Number of POAPs and OATs held
Unfortunately, only 10 out of 18 projects fully tracked the first 10 days of data. Due to limited data volume, conclusions may have some bias. Still, even partial insights offer valuable takeaways.
Post-Campaign Data Review
The campaign lasted 10 days, generating approximately 45k social media impressions, activating around 21k users to the campaign page, and tracking about 2.3k “real users” who completed all tasks, had wallets, engaged in on-chain interactions, and showed social activity—an overall conversion rate of roughly 10%. Regrettably, 8 high-potential projects lacked complete data. Below is a detailed analysis.

*Note: Disclosure — All data in this article comes from Clique.
Real Traffic Distribution
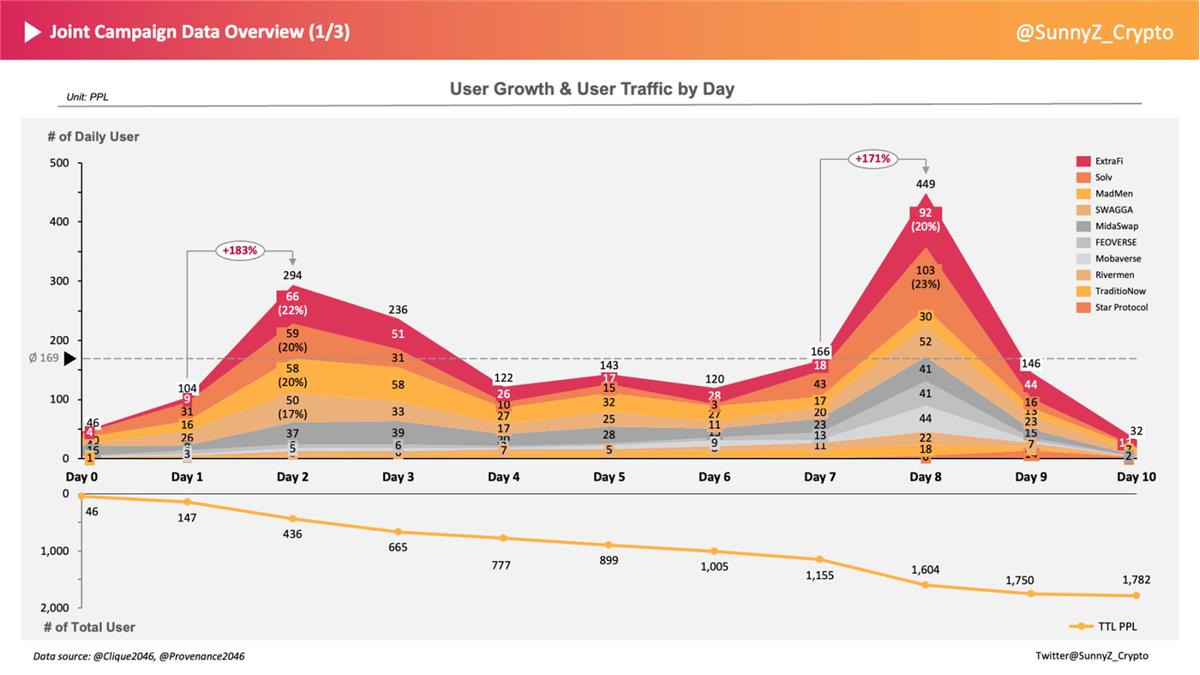
Users increased steadily each day during the campaign, with peaks on Day 2 and Day 8. This suggests information dissemination takes time, and users tend to engage more at the beginning and end of a campaign. Prolonged cycles lead to declining engagement.
New vs. Existing User Distribution
-
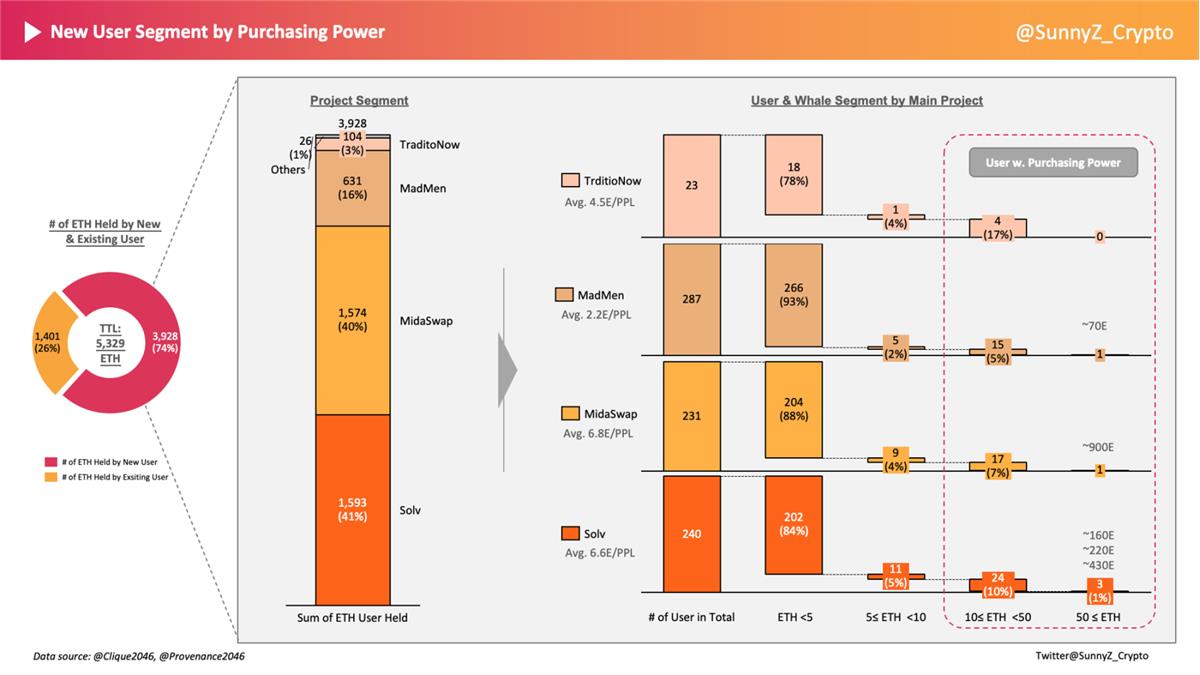
During the campaign, 89% of users were newly following project Twitter accounts and joining Discords—classified as new users. This indicates joint campaigns effectively meet cross-promotion needs, while also showing that single-task campaigns struggle to re-engage existing users;
-
Although existing users made up only 11%, they were of higher quality: they held 26% of total ETH balance and 31% of total followers. Their purchasing power was over twice that of new users, and their social influence was about three times higher—making them highly valuable overall;
-
Designing reactivation campaigns targeting existing users offers better ROI than pure acquisition efforts. The rapid growth of Crew3 reflects strong demand for user engagement in Web3, signaling a shift in growth focus from acquisition to retention;
-
Among all projects, 3 of the top 5 in new user acquisition belonged to DeFi/NFTFi categories, while the other two offered high-value rewards—indicating new users prefer transactional tasks or high-reward activities. The most active existing users came from Solv and ExtraFi, two DeFi projects, suggesting that despite diverse narratives across sectors, real users remain concentrated in DeFi.

User Segmentation & Profiling
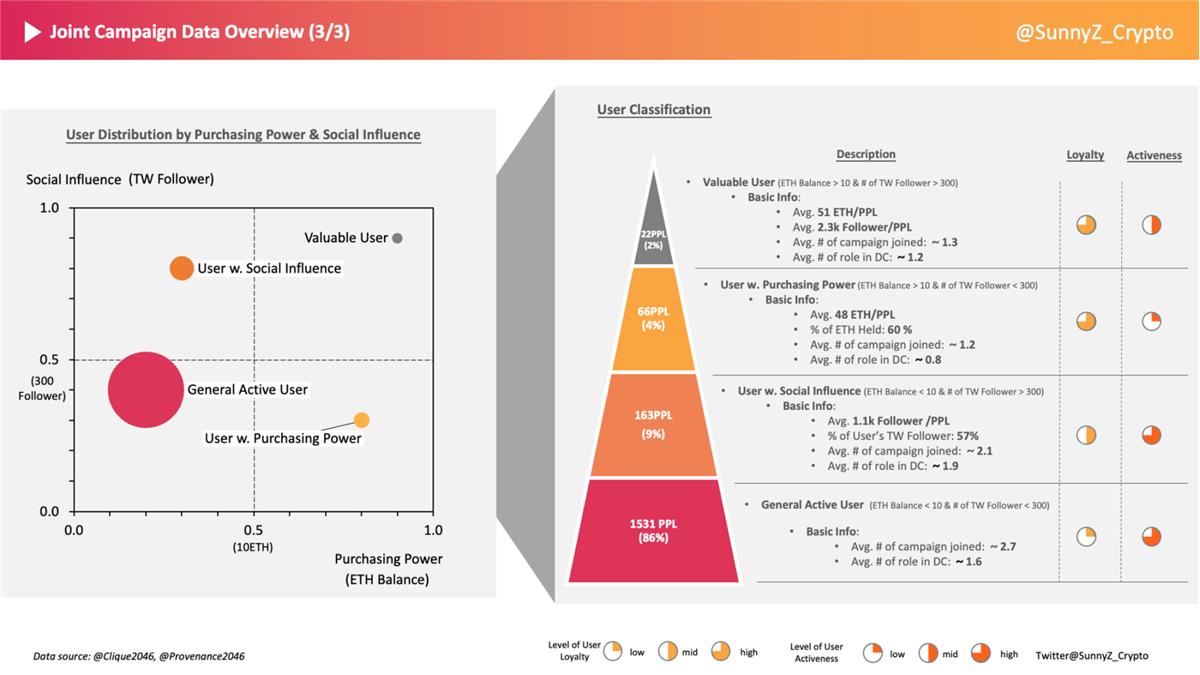
We segmented users based on purchasing power and influence. Purchasing power was measured by ETH and stablecoin wallet balances (median: 10 ETH), while social influence used Twitter follower count (median: 300). Loyalty and activity were assessed via average number of activities joined and Discord roles held, resulting in four user profiles:
-
Valuable Users [High Overall Value]
-
Prefer DeFi projects, highly loyal—typically participate in just one project’s activities—and relatively active, verified with roles in Discord. They hold an average of 14 POAPs, indicating deep understanding of Web3 mechanics and preference for high-quality projects—true enthusiasts who both understand and love the space;
-
Though only 2% of total users, they hold 21% of total ETH and 16% of all followers, with average wallet balances of ~51 ETH and ~2.3k Twitter followers. High purchasing power and influence make them core users. For large campaigns, consider designing more on-chain interaction tasks and allocating larger reward shares to this group.
-
-
Users with Purchasing Power [High Buyers]:
-
No clear project preference—seen across DeFi and NFT projects—with high loyalty, often engaging only with specific projects. These addresses frequently overlap with known project whales and likely have direct relationships with teams—mostly existing users;
-
Low activity—they rarely chat in Discord and hold few roles, averaging 4 POAPs. They don’t post frequently, so follower counts are modest—classic “quiet wealth” types;
-
This 4% group holds 60% of total ETH, averaging ~48 ETH per person, with many holding over 1,000 ETH. Highly capable buyers, but hard to reach through standard channels. Projects should create whale groups or dedicated Discord Whale Channels and notify them directly about major events for higher reach.
-
-
Users with Social Influence [High Influence]:
-
No project preference, moderate loyalty—participate in multiple projects simultaneously, distributed evenly across partners. Highly active, holding at least 2 roles in each Discord, averaging 16 POAPs. Though not wealthy, they have strong influence—typical Web3 micro-KOLs;
-
These 6% of users account for 57% of total Twitter followers. Design retweet, tag-a-friend, or invite-based tasks for them and reward directly in tokens to maximize low-cost user acquisition and multiplier effects on social platforms.
-
-
General Active Users [Active Participants]:
-
No project preference, low loyalty—participate in at least 3+ projects simultaneously. Very active, typically holding 1–2 roles in Discord, almost all possess POAPs or OATs—likely “grifters” or “farmers”;
-
86% of users fall into this category. Their scale presents a challenge: how to extract value? I believe every real user matters—as long as they’re not bots. With proper conversion design, growth is achievable. Thus, introduce more daily tasks and distribute rewards based on sustained activity rather than one-time actions.
-
As a project, when designing larger campaigns, leveraging multidimensional user data to tier rewards—allocating different incentives to different user types—can greatly improve retention, optimize ROI, and secure core users instead of relying solely on raffles. With so many grifters and scientists in the space, if rewards end up in the hands of non-genuine users, it brings little long-term benefit.
Cross-Project Data Analysis
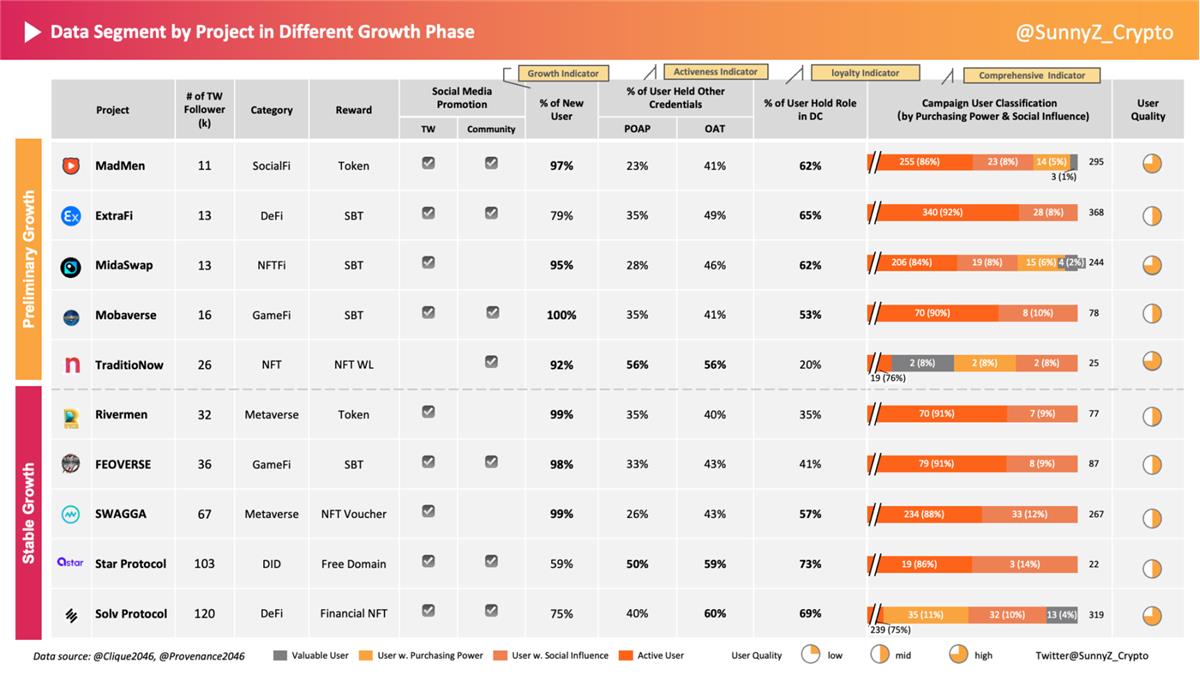
Since all participating projects used identical promotion methods, timing, duration, and task platforms—with minimal external variables—this became a controlled comparative experiment. Yet outcomes varied dramatically. Seven projects achieved over 90% new user rates, with over 65% of users verified and role-holding in Discord, while others underperformed.
Are these differences due to sector preferences, or are they driven by reward structures and operational approaches? Cross-comparison may reveal the truth.
Based on project age and follower count, we categorize them into two groups: Early-Growth Projects and Stable-Growth Projects:
-
Early-Growth Projects:
-
Smaller user base; primary goal is user acquisition. Willing to pay for traffic, less concerned with user quality—still in the scaling phase;
-
MadMen and MidaSwap, despite fewer social followers, attracted high-quality participants. User distribution across the four segments was balanced. Interviews revealed:
-
MadMen integrated its own promotional channel, encouraging viewers of its video to go directly to the campaign page. Rewards were redeemable for tokens. Its early users came from partnerships with premium GameFi projects—users already asset-rich and willing to invest time and effort, leading to strong performance;
-
MidaSwap ran parallel promotions across platforms during the campaign, enabling cross-platform user flow. Though still in private testing with limited outreach, it focused on NFT insider circles—resulting in relatively more NFT whales and KOLs;
-
ExtraFi, a pre-launch project, saw high participation likely due to strong incentives—beyond SBTs, all qualified users received OG Discord roles tied to future token expectations;
-
For such projects, promotional channels and meaningful rewards are the main drivers of participation;
-
-
Stable-Growth Projects:
-
Established user base; goals center on acquiring genuine users and converting core users. Focus on both quantity and quality—currently in optimization phase;
-
SWAGGA and Solv Protocol showed high user stickiness. Both reported no special promotions or rewards—the current level of engagement is business as usual. They frequently run activities to keep users active. Whales naturally stay updated, and being pre-token launch, users likely hold optimistic expectations;
-
For these projects, long-term operations that boost interaction rates are the key drivers of campaign success.
-
After conducting 1:1 interviews, I found that whether early-stage or established, projects with精细化 operations consistently demonstrated higher user quality and stickiness. In today’s hyper-competitive Web3 landscape—where features, UX, and rewards are all being optimized—professionalized operations are increasingly critical.
Analysis of New User Behavior
Mutual user acquisition through joint campaigns is the primary goal for most projects. These new users are ideal targets—they actively participate in similar events and are easily convertible. Successfully identifying and converting those with purchasing power or influence from public traffic can dramatically amplify growth.
- Purchasing Power
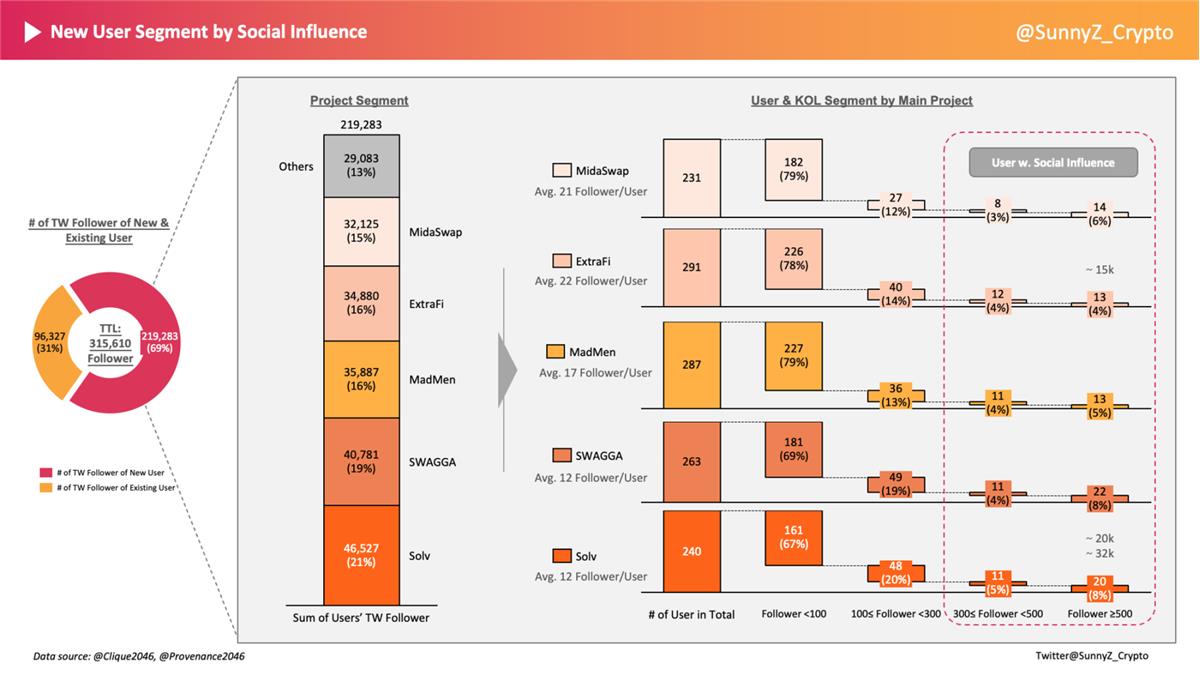
Whales among new users were mainly found in Solv, MidaSwap, MadMen, and TraditioNow, averaging ~46 ETH per wallet. Several new users on Solv held over 150 ETH; one MidaSwap user held over 900 ETH. To precisely target whales in future joint campaigns, consider deeper collaboration with such projects and offer higher-tier rewards. In the chart below, the 60+ users labeled “User w. Purchasing Power” represent prime conversion targets.
- Influence
KOLs among new users were primarily seen in Solv, SWGGA, MidaSwap, MadMen, and ExtraFi, averaging ~1,000 followers. Three had over 15k followers, with one reaching 32k—surpassing many projects’ own followings.
From earlier profiling, KOLs are easier to convert than whales—highly active and more accessible. To leverage their influence, add social sharing or invite-based tasks in joint campaigns. The 190+ users marked as “User w. Social Influence” in the chart below are ideal targets.
How to Optimize Operations Based on Data?
Set Up Data Metrics
The first step toward精细化 operations is setting clear data metrics. Without data, optimization is blind.
Web3 user data is unique: assets, transactions, and some behavioral data live on-chain, but much remains off-chain. Building accurate user profiles requires combining on-chain and off-chain data—including identity, transaction history, social activity, and asset holdings.
Many operational suggestions have already emerged from the above analysis. Here’s a quick summary:
Key Optimization Steps
1. Timing of Promotion
Based on traffic patterns, recommend starting a 2-day pre-campaign warm-up and sending reminders 1–2 days before closure. Keep campaigns short and fast—ideally under 5 days. For larger initiatives, break them into weekly releases.
2. Tiered Rewards & Targeted Engagement
Once user segments are identified, tailor operations and reward tiers accordingly: reserve significant rewards for OGs and design more on-chain tasks for them; create whale groups or Whale Channels for high-buyers and notify them directly; reward influential users with tokens and emphasize retweets, tagging, content creation, or referrals; for the large base of active users, introduce more daily tasks and reward based on sustained engagement.
3. Selecting Campaign Partners
Clarify your campaign objective and target audience, then selectively partner with aligned projects—don’t accept every invitation. Blindly joining campaigns without strategy leads to mediocre results with no clear learnings.
Next Step
This growth experiment yielded many insightful findings. I plan to continue running these experiments long-term. This round didn’t separate by sector—next time, I’ll segment by vertical: DeFi, GameFi, DID, Metaverse, etc., inviting only same-sector projects. From a data perspective, I want to see how user profiles differ, where real users cluster, and what behavioral patterns emerge.
Projects interested in collaborating—please reach out. And if you’d like to join me in running these experiments, DM me 🙋!
Collaboration Contact
This was my first Web3 growth experiment—many areas need improvement. Huge, huge thanks to all participating and supporting projects. Wishing everyone continued success—WAGMI!
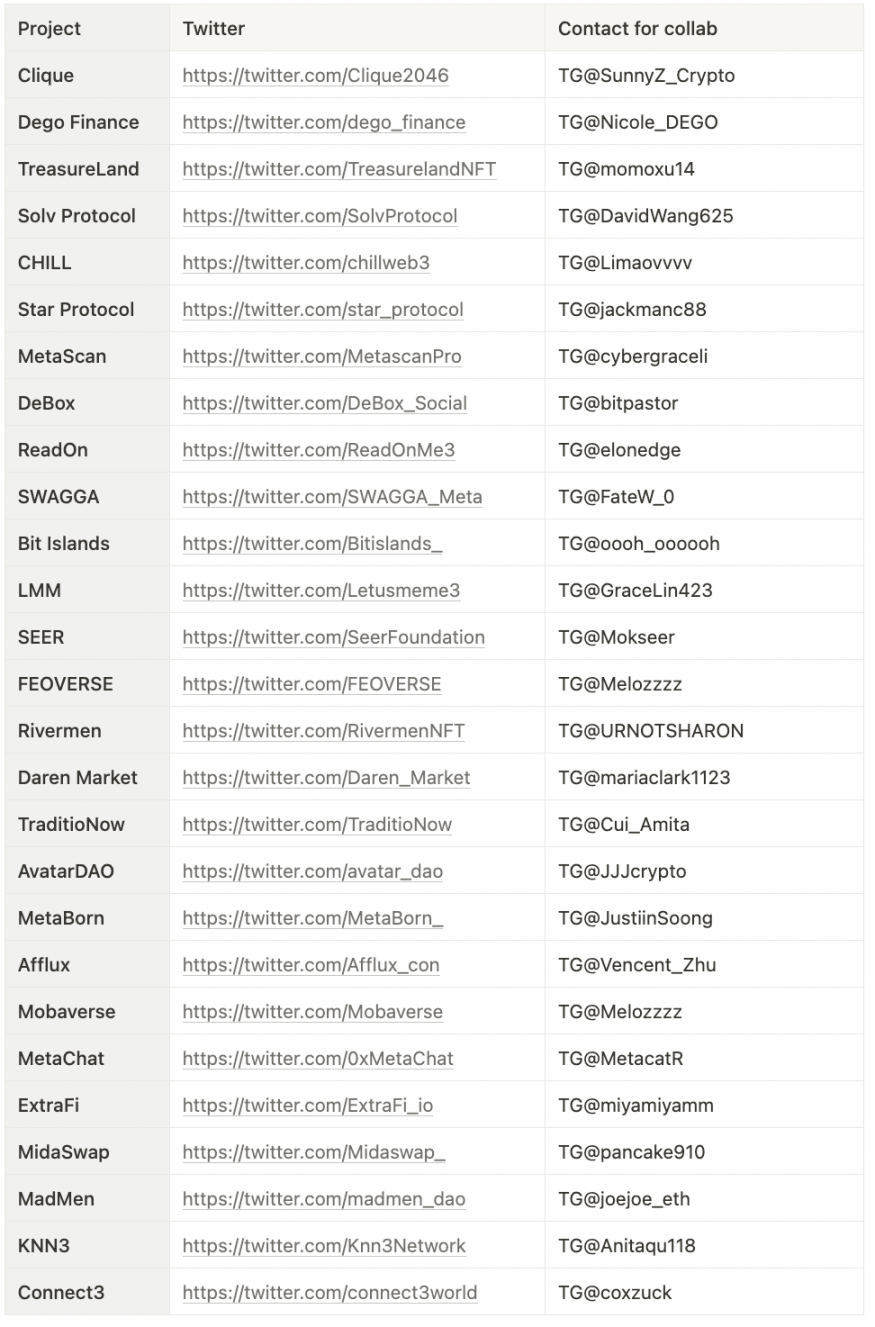
Below are project contact details. If you’re interested in collaboration or have questions, please connect directly with the teams.
Final Thoughts
Here are a few questions I’m often asked—interesting enough to share publicly and spark discussion:
1. Why are so many Web3 projects building or pivoting to task platforms?
Underlying logic: Task platforms are a symptom—the core value lies in user data and its monetization potential.
Market reasons:
-
Market size: The “to earn” market is vast, non-monopolistic, and still fragmented—room exists for multiple players with undefined competitive dynamics. Each niche has unmet needs—ideal entry conditions;
-
Supply and demand:
-
Growth is an eternal need—where there’s demand, there’s a market;
-
More projects than users—supply exceeds demand. Shifting to serve B2B clients becomes easier for traction. Task platforms have low technical barriers, making them attractive for channel-rich projects;
-
Web3 channels are highly fragmented. Beyond major exchanges, most rely on communities. Task platforms aggregate giveaways to consolidate scattered communities—effectively solving customer acquisition;
-
Industry stage reasons:
-
During bear markets, nearly all sectors decline—except task platforms, which grow逆势. Whether pivoting or launching new ones, the ROI is relatively high;
-
Web3 is still early. Growth tactics remain limited—mainly token/WL drops. Lack of precise user data prevents targeted marketing. I believe current task platforms aren’t the endgame. Today’s model mimics private-domain playbooks. Web3 should be open—shared user pools with transparent, data-driven acquisition. But this requires massive, accurate datasets. I look forward to a project that truly nails the user data layer.
2. What does good Web3 growth look like?
One-liner: A hexagonal warrior. See the diagram below ⬇️

Beyond this, I have additional thoughts on how data-focused or SaaS-type projects should approach growth—might write a separate piece later (if I find the time 👀).
Join TechFlow official community to stay tuned
Telegram:https://t.me/TechFlowDaily
X (Twitter):https://x.com/TechFlowPost
X (Twitter) EN:https://x.com/BlockFlow_News