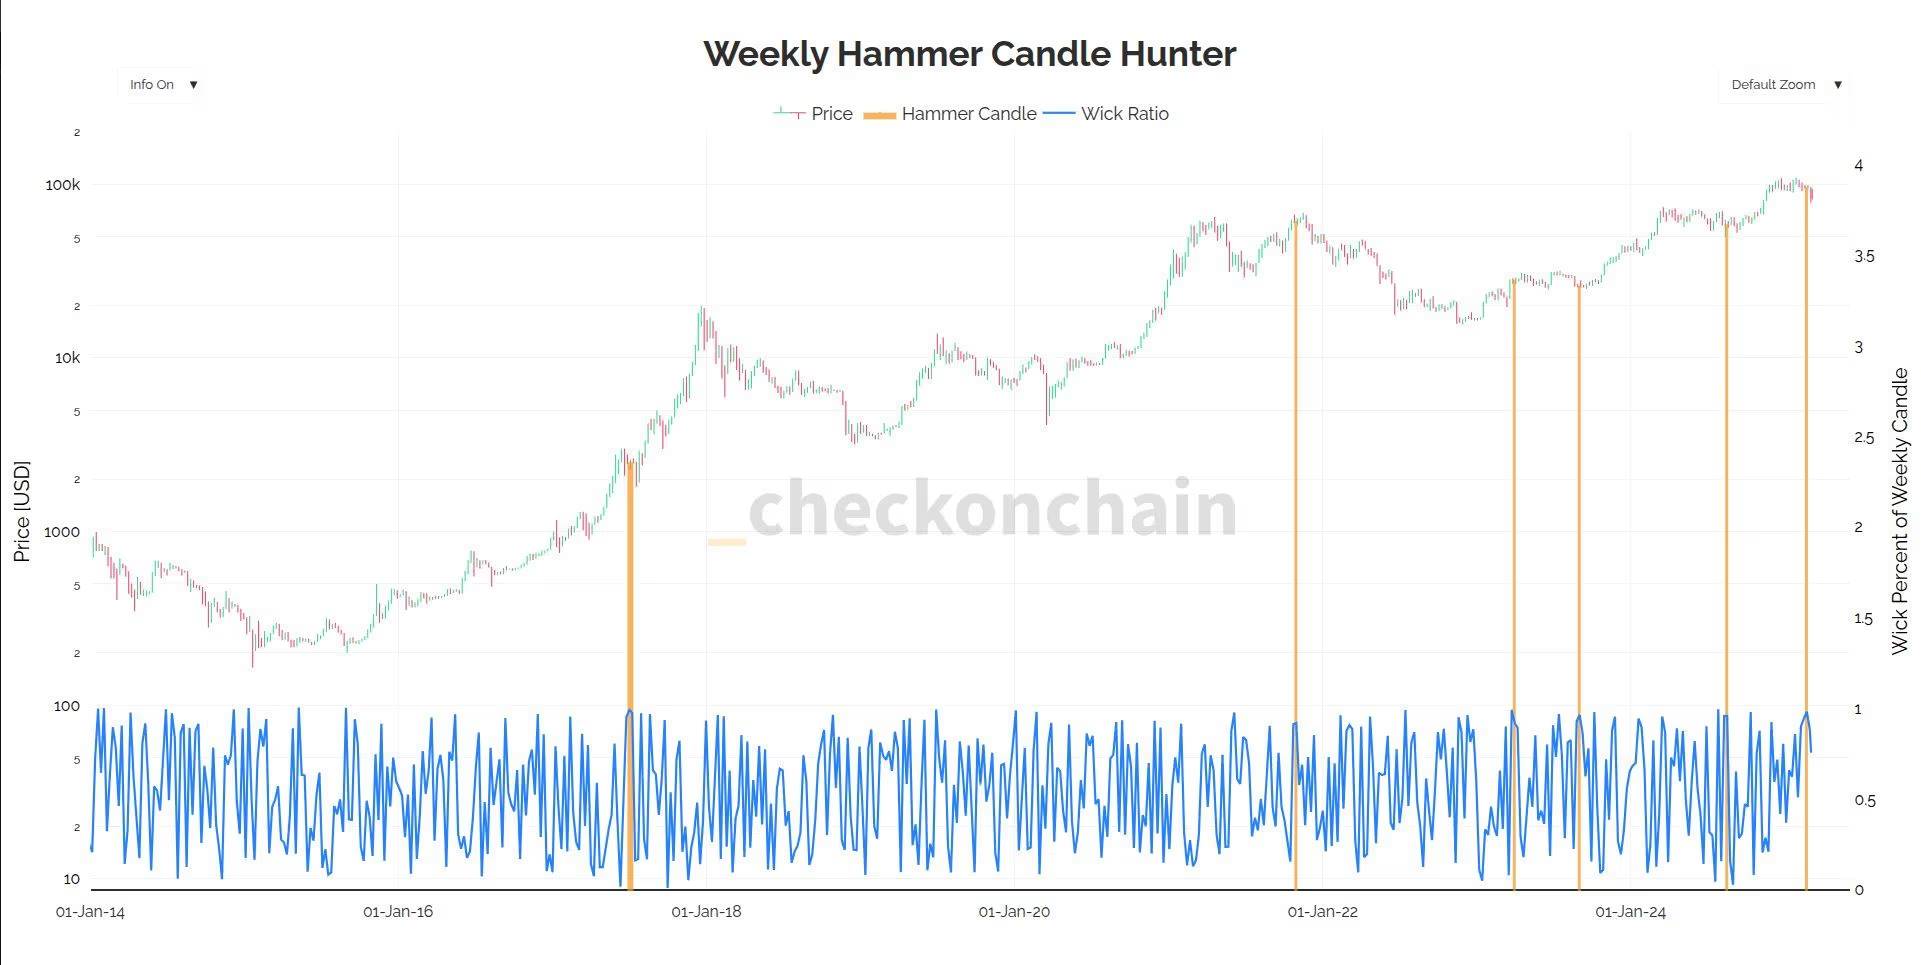
TechFlow news, on March 6, according to CoinDesk, Bitcoin has recently displayed consecutive hammer candlestick patterns over the past two weeks—a phenomenon extremely rare in Bitcoin's history. Analyst Checkmate defines a hammer pattern as one where the upper or lower wick occupies 90% of the total price range, leaving a small body and a long wick.
Data shows that during the week of February 24, Bitcoin fluctuated between a low of $78,167 and a high of $96,515, with a volatility amplitude of 23%. The following week starting March 3, prices moved between a low of $81,444 and a high of $94,415, showing a 16% volatility. Both weeks formed open-high-low-close candlestick patterns characterized by long lower wicks and small bodies, with double-digit percentage swings.
Checkmate’s analysis reveals that in Bitcoin’s history, such weekly candlesticks with 90% lower wicks have only appeared during five periods: during the 2017 bull market, near the end-of-2021 bull peak close to $69,000, after the 2023 Silicon Valley Bank crisis, following the summer 2023 pullback, and during the summer 2024 downturn.
While this data does not reveal a definitive cyclical pattern for Bitcoin, the 2017 bull market correction stands out significantly, suggesting such formations may signal key turning points in price trends.