$6 Trillion Evaporated in 45 Days: Is This a Bubble or an Opportunity?
Written by: The Kobeissi Letter
TechFlow
The question we are asked most right now is: Is there an "AI bubble," and has it already burst?
U.S. stocks have lost an average of $225 billion per day over 31 consecutive trading days.
Below, we systematically break down: how things reached this point, what is currently happening, and what we see next.
Since November 2022, we have been highly bullish on AI, calling it the greatest technological revolution in history.
Our judgment that you "either hold assets or get left behind" is built on innovation-driven returns and accumulating inflation.
Over the past six weeks, AI trading has undergone one of its harshest tests since its inception, rivaling the intensity of the April 2025 trade war period.
The reality is that AI is disrupting the established order of global markets, economies, and civilization. This disruption brings emotional polarization, and the sharp volatility in asset prices only amplifies it.
This is precisely what we are witnessing right now.
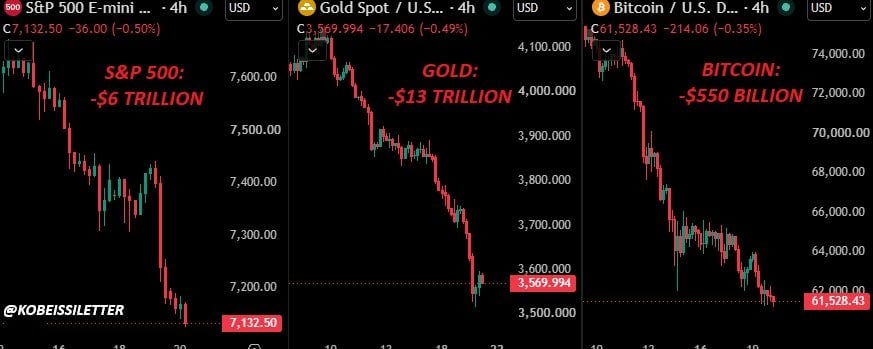
Chart: Recent trends for the S&P 500, gold, and Bitcoin. Annotations indicate the S&P 500 lost $6 trillion, gold lost $13 trillion, and Bitcoin lost $550 billion.
The Past 45 Days: Quite Chaotic
Before diving in, it is necessary to first take stock of exactly how much has happened since the S&P 500 last hit an all-time high on October 6.
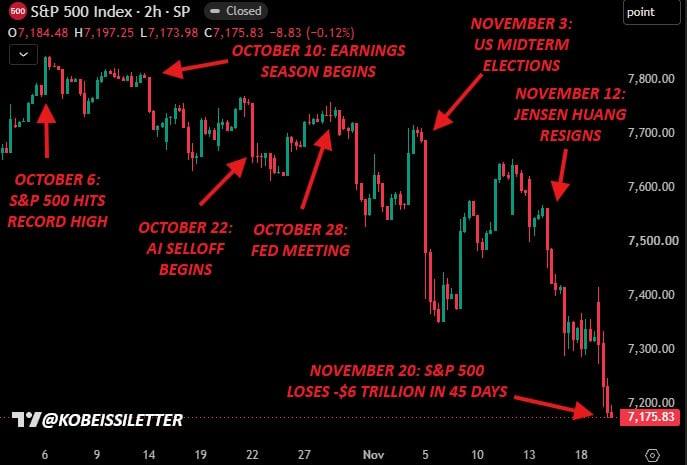
Chart: S&P 500 performance over the past 45 days. Annotations include Oct 6 all-time high, Oct 10 earnings season start, Oct 22 AI selloff initiation, Oct 28 Fed meeting, Nov 3 midterm elections, Nov 12 Jensen Huang resignation, and Nov 20 cumulative $6 trillion wiped out over 45 days.
Over the past 45 days, the market has processed countless headlines related to the Iran war, the Q3 2026 earnings season, concerns surrounding AI capital expenditures and free cash flow, the October Federal Reserve meeting, U.S. midterm elections, the NVIDIA ($NVDA) turmoil, ultimately wiping out $6 trillion in market capitalization.
In addition, Anthropic's IPO recently raised over $100 billion, becoming the largest IPO in history, and has notably drained market liquidity over the last few trading sessions.
At a moment like this, investors need to step back and ask themselves a critical question: What has changed, and what has already been priced in?
Many Concerns Are Already Priced In: CapEx and Free Cash Flow
This sell-off primarily stems from concerns over AI capital expenditures at major U.S. tech companies and their impact on free cash flow and profitability in 2027 and 2028.
These concerns are real.
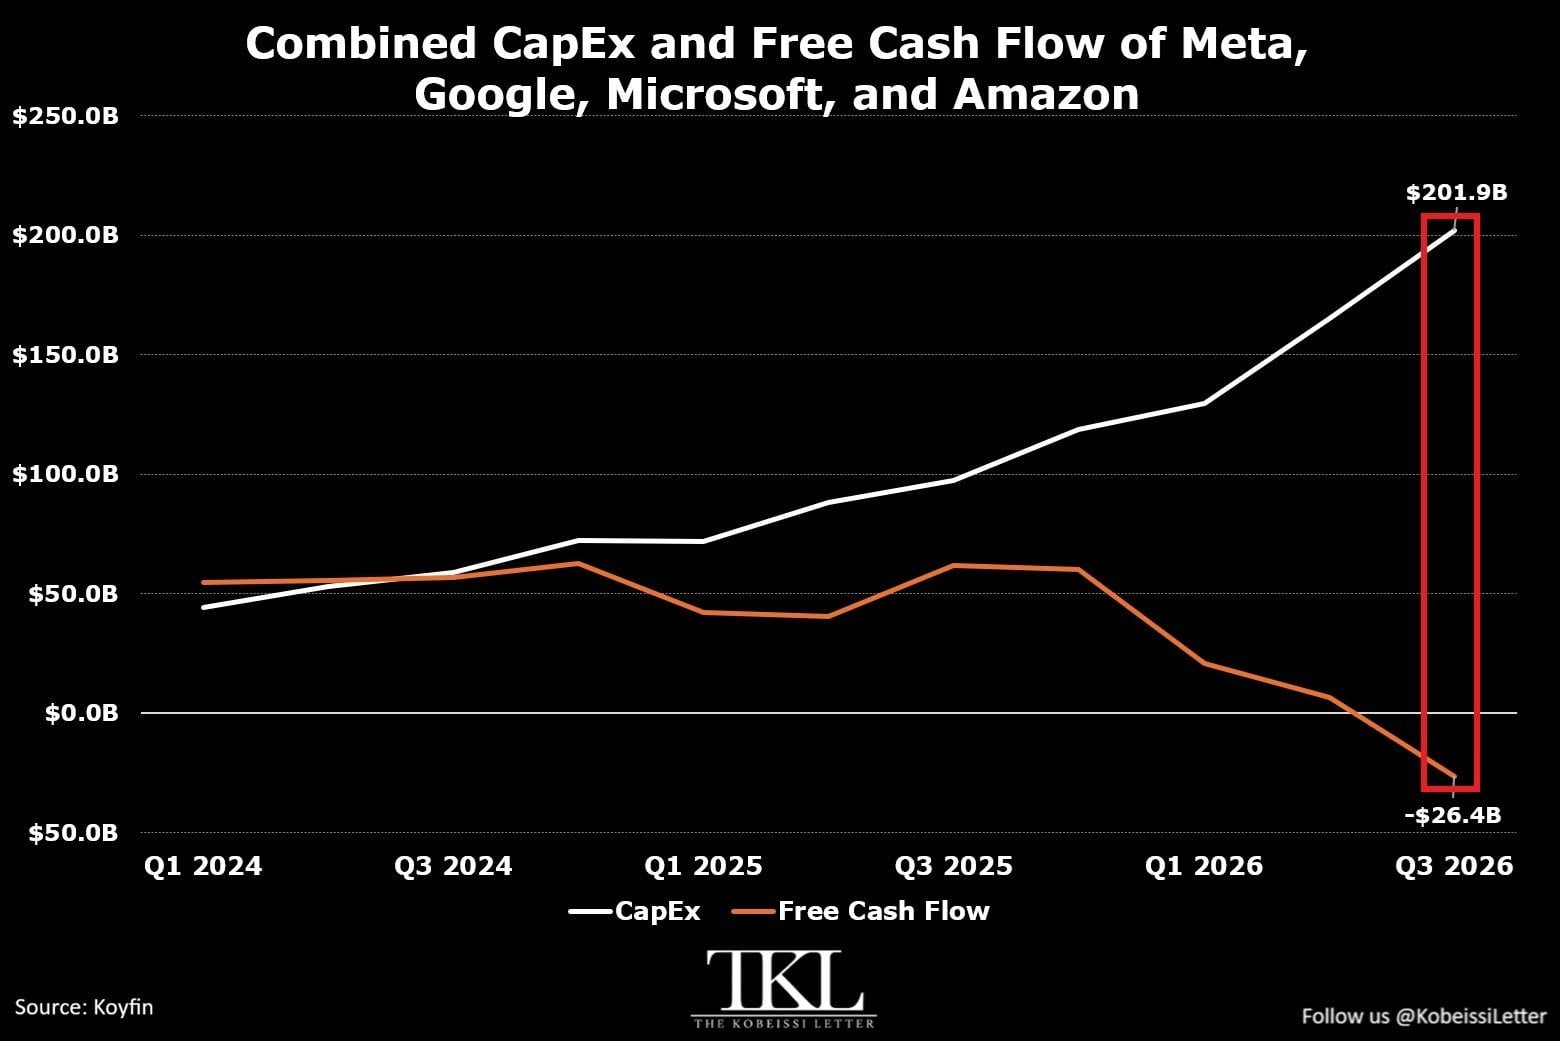
Chart: Combined capital expenditures and free cash flow for Meta, Google, Microsoft, and Amazon. Q3 2026 CapEx reached $201.9 billion, with free cash flow at -$26.4 billion.
Combined capital expenditures for Amazon ($AMZN), Alphabet ($GOOGL), Meta ($META), and Microsoft ($MSFT) increased by $36.9 billion in Q3 2026, reaching a record $201.9 billion.
This figure more than doubled over the past 12 months, up 356% from Q1 2024. Over the past three years, combined capex for big tech has reached $1.6 trillion.
However, it must be acknowledged: record infrastructure investment is a prerequisite for the greatest technological revolution in history. Temporary negative free cash flow is the short-term cost of long-term construction.
A significant portion of these concerns has already been priced in. However, they will not easily fade until there is a clearer answer on the return on invested capital—likely not until Q1 or Q2 2027.
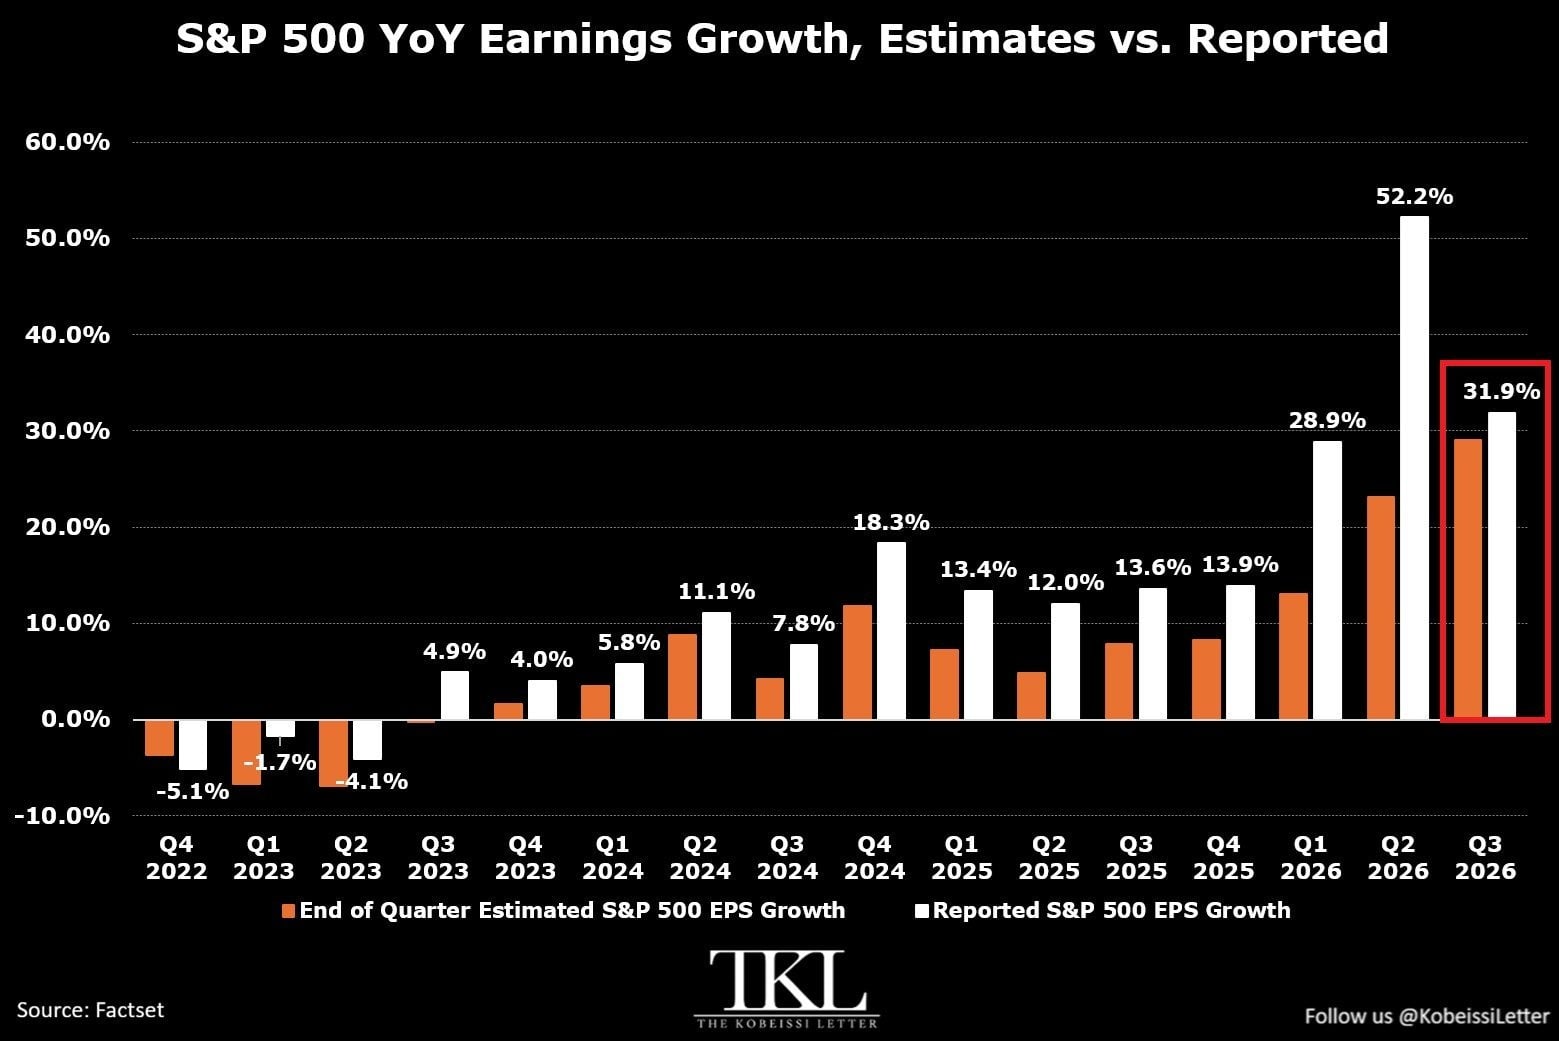
Chart: S&P 500 EPS year-over-year growth rate, comparing expectations vs actuals. Actual growth for Q3 2026 was 31.9%.
Few markets are currently both so fearful and still growing this strongly.
To date, S&P 500 companies reported a 31.9% year-over-year increase in EPS for Q3 2026, marking at least the strongest annual growth in four years.
Earnings have beat estimates for 13 consecutive quarters. The pace of AI buildout is stronger than most realize.
Democratic Party "Sweeps" Midterm Elections, "Trump Put" Comes to an End
Moving forward, we believe a significant catalyst for the recent sharp pullback in tech stocks is tied to the results of the U.S. midterm elections. This election effectively ended what we call the "Trump Put."
From President Trump's first term (2016–2020) and his current second term, markets have found comfort in his ability to steer events during volatile periods. The so-called "Trump Put" is a hedging concept: if the market looks ugly, Trump will intervene, as a stable market has always been his priority.
With the Democratic Party sweeping the midterm elections, we believe the "Trump Put" is effectively over. Further catalyzing the disappearance of this backstop was the post below on November 4:
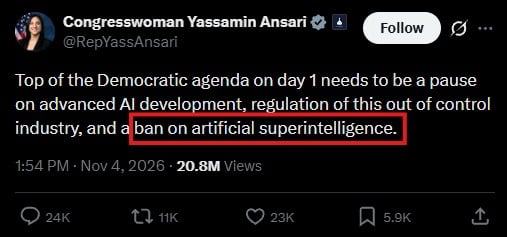
Chart: Rep. Yassamin Ansari posted on Nov 4, 2026, stating that the Democratic Party's first-day agenda should include halting advanced AI development, regulating the 'out-of-control' industry, and banning artificial superintelligence.
President Trump's ability to intervene in markets has been partially weakened by the shift in control of the Senate and House. Calls to ban AI are heating up, and the market has already priced in aggressive regulation and scenarios where AI could be banned after Democrats take power in January 2027.
The end of the "Trump Put" is irreversible and will likely lead to steeper pullbacks in U.S. equities. However, we believe concerns surrounding regulation are exaggerated.
A U.S. ban on AI will not happen. Even if such a ban were enforced, it would essentially amount to the U.S. ceding its position in the global AI race to China.
Regulation will increase, and new taxes may emerge, but the market is pricing in more extreme scenarios, heavier than what we believe will ultimately materialize.
At the end of the day, regardless of who holds power, the United States wants to win.
The Fed Is Raising Rates in an Anxious Market
Beyond AI investment concerns and shifting political dynamics, the Fed is aggressively hiking rates.
The Iran war is nearing its 300th day, and U.S. inflation has remained above the Fed's 2% target for 67 consecutive months. Fed Chair Warsh has made clear that his top priority is bringing inflation down to 2%, with no exceptions.
This means AI build costs, already expensive, will become even pricier. Not to mention, the U.S. federal debt situation is deteriorating further.
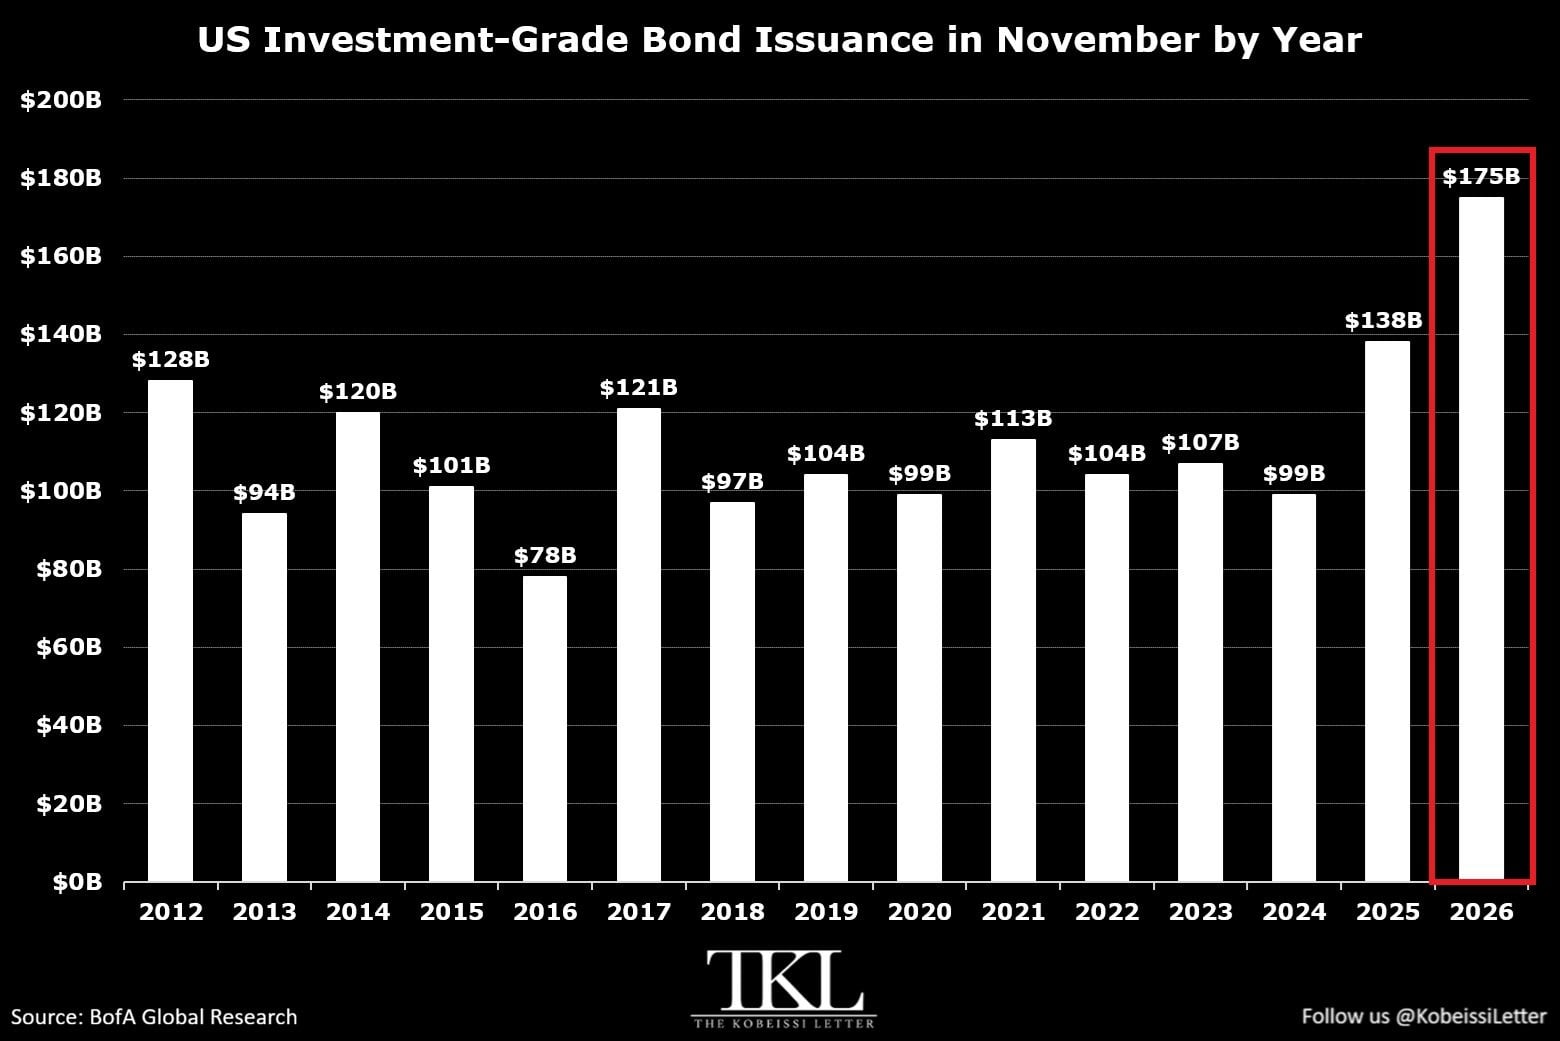
Chart: Year-over-year comparison of U.S. investment-grade bond issuance in November. November 2026 is projected to reach $175 billion, the highest November level on record.
As shown above, U.S. investment-grade corporate bond issuance is expected to increase by $37 billion year-over-year in November, up 27% to $175 billion, the highest level for any November on record. We believe the Fed raising rates against this backdrop further exacerbates recent instability. Will this change?
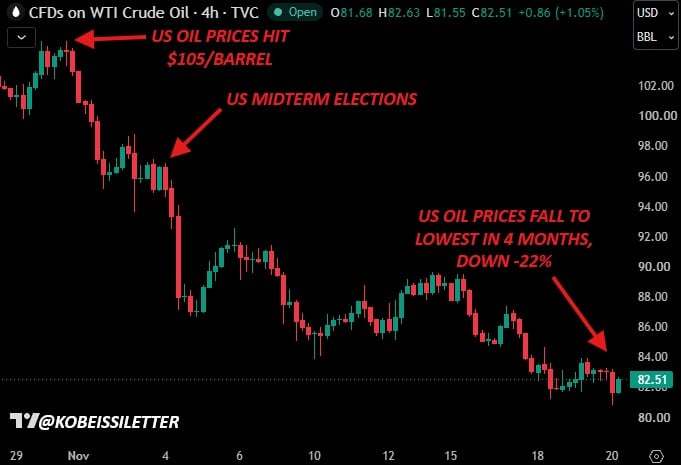
Chart: Recent trend of U.S. crude oil near-month prices. Oil once touched $105 per barrel, pulled back after the midterms, falling ~22% from prior highs to ~$82.51, a 4-month low.
The transfer of political power, combined with the recent market downturn, has already driven oil prices down by approximately 22% this month. Coupled with market instability, the Fed's outlook for 2027 is likely to shift, especially as it becomes clearer that the Iran war is nearing its end.
On November 2, we published the analysis below on U.S. oil prices ahead of the midterms, when our target was a drop below $93.00. Since then, oil prices have fallen to their lowest level since August 2026.
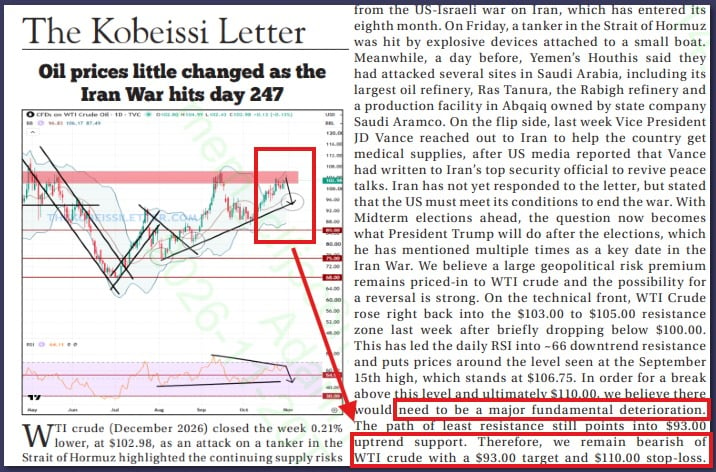
Chart: Screenshot of The Kobeissi Letter's Nov 2 oil analysis, noting the Iran war was on Day 247 and setting a $93 target.
This Sunday, we will release the latest issue of The Kobeissi Letter; consider subscribing to read the full article.
Even though oil prices have fallen, "higher for longer" remains temporarily in play. However, we believe the likelihood of the Fed's policy becoming less restrictive is rising by mid-2027.
NVIDIA, AMD, and the China Chip Landscape
Over the past two weeks, NVIDIA lost Jensen Huang—the leading figure of the AI revolution—as its stock plummeted 40% over several weeks; AMD is currently accused of smuggling chips to China, and the market has factored in major concerns regarding the fallout.
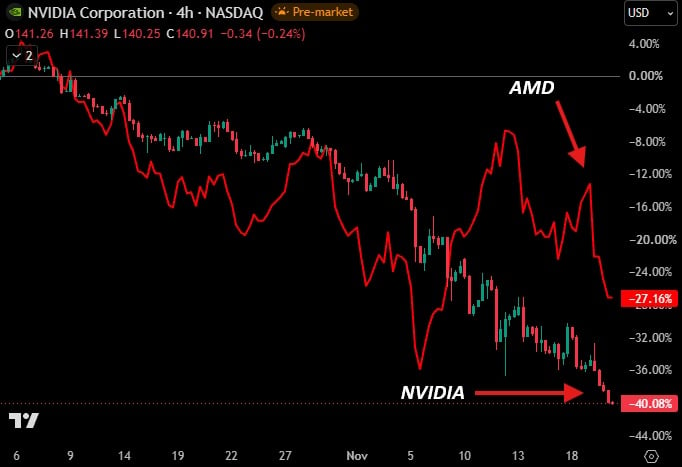
Chart: Recent weekly performance of NVIDIA and AMD. NVIDIA fell ~40.08%, AMD fell ~27.16%.
You have likely seen that we have taken a clear stance on the NVIDIA situation, adopting the position early on that "Jensen Huang is innocent until proven guilty." We called on the board to leave room for Huang until an independent investigation yields clear facts.
We hold this view because of the innovation and impact Huang has brought to the AI revolution and U.S. success. NVIDIA's stock is now priced almost as if "Huang will not return," effectively writing off the entire forward guidance.
A similar situation is unfolding for AMD. On November 19, a short report accused the company of smuggling chips to China, a claim that remains largely unproven.
Affected by these events, the sector's forward P/E ratio has fallen to its lowest level since March 2020.
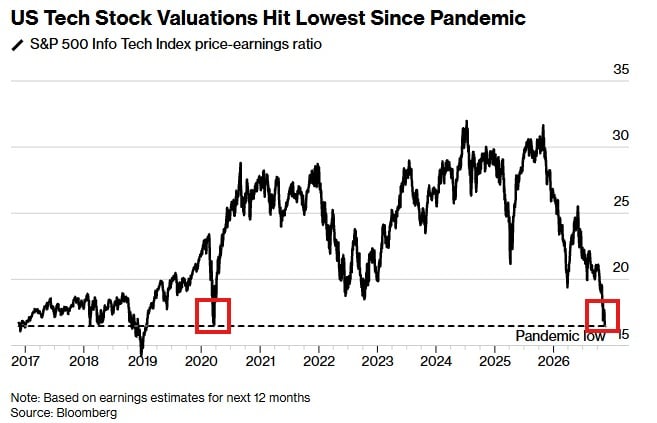
Chart: S&P 500 Information Technology Index forward P/E ratio, which has retreated to near its lowest level since the pandemic.
NVIDIA's forward P/E ratio has dropped to 9x, making it one of the cheapest stocks in the S&P 500, and even cheaper when juxtaposed with the earnings growth the company is delivering.
What does this mean? The market does not believe the "E" in the forward P/E ratio.
Despite NVIDIA providing fiscal year 2028 revenue guidance of approximately $750 billion, the market refuses to believe it, even without Huang.
There is already significant room for upside surprises baked into the current market.
Sentiment Has Reached Crisis Levels
On October 15, we published an analysis titled "Stealth Bear Market," pointing out that beneath the surface of the S&P 500, particularly in tech, a bear market had already emerged. The shift in sentiment began then. It did not start with the midterms or the NVIDIA turmoil.
As shown below, those events merely accelerated the shift in sentiment.
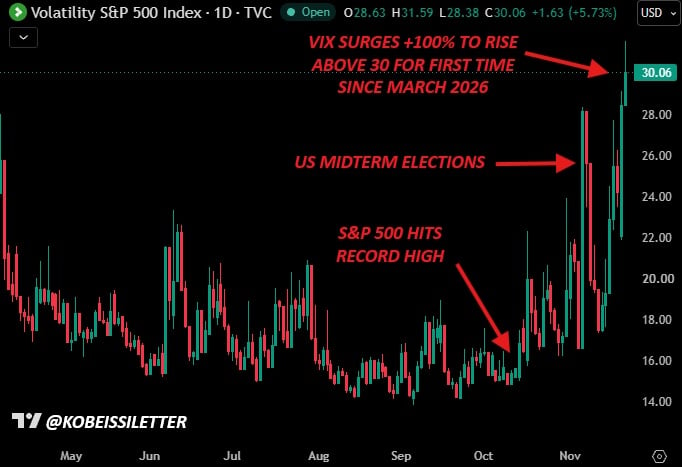
Chart: CBOE Volatility Index (VIX). Rose over 100% from its October low, breaking above 30 for the first time since March 2026.
The Volatility Index ($VIX) has risen over 100% from its October low, posting its largest single-day gain since February 2018 on November 5. View this sudden spike in panic alongside the liquidity drain from Anthropic ($ANT)'s IPO.
Institutional demand for the IPO reached $400 billion, with retail orders hitting $100 billion after the book closed on Tuesday. At the then-expected $78 offering price, this approached eight times the initial $64.4 billion raise size.
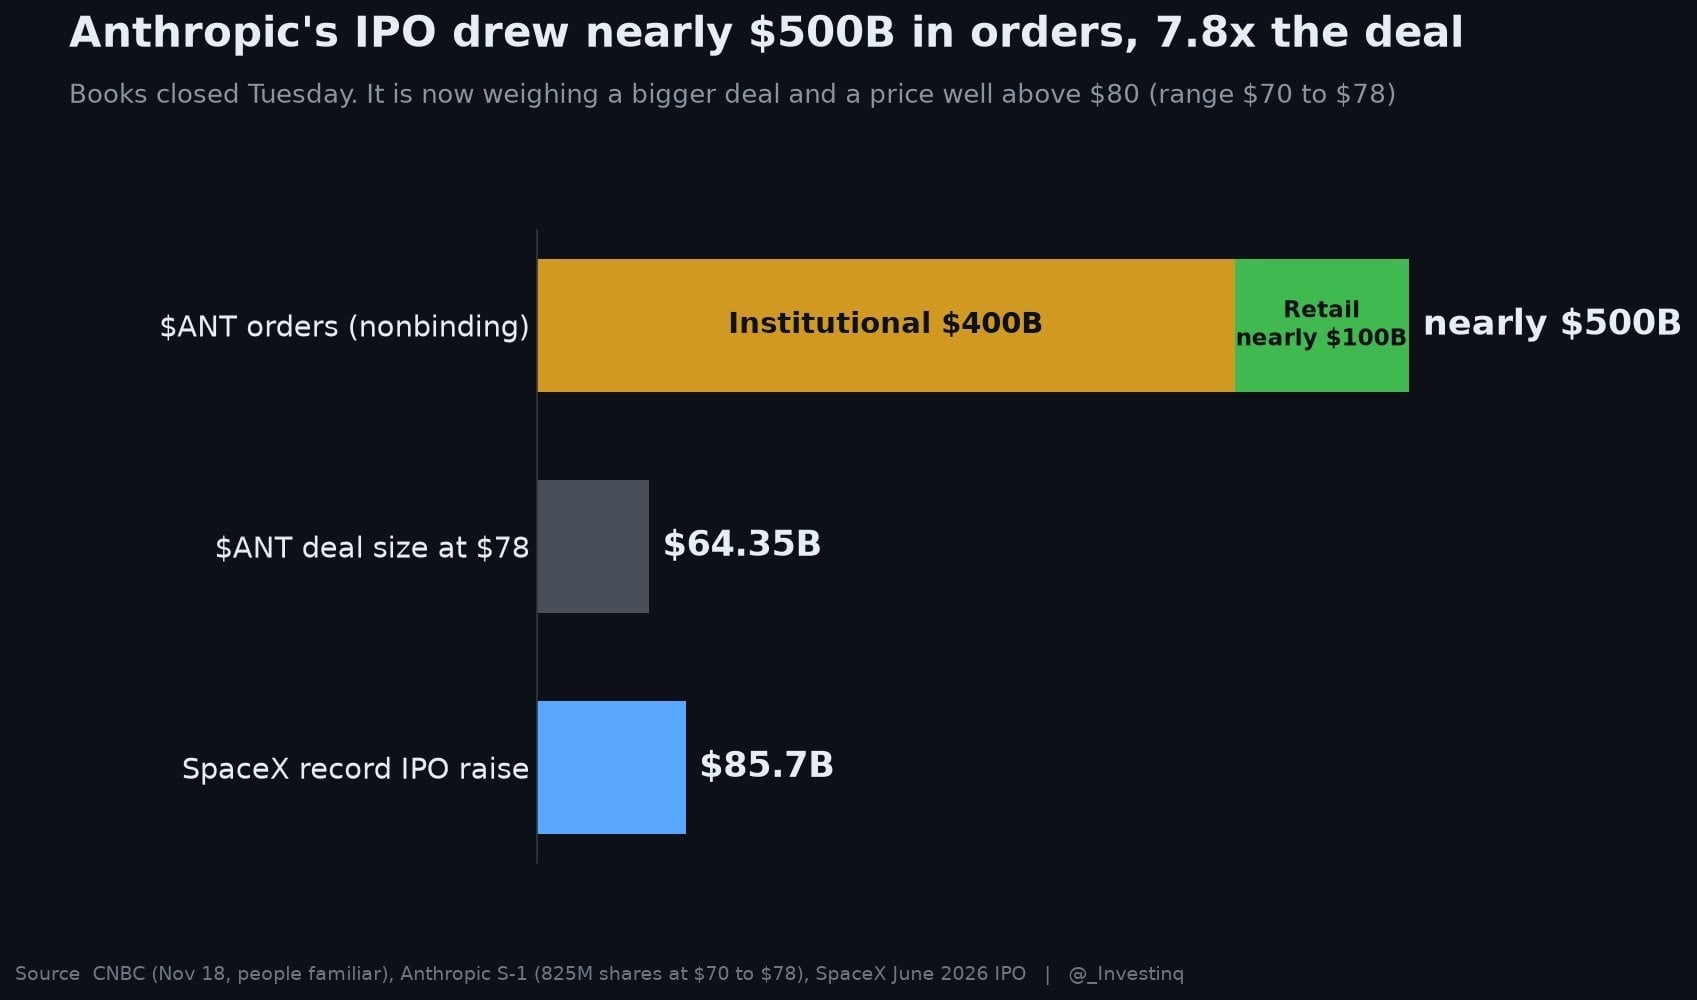
Chart: Anthropic IPO order sizing. Institutional ~$400B, Retail ~$100B, Total ~$500B, roughly 7.8x the $64.35B raise at the $78 price; compared against SpaceX's record $85.7B IPO raise.
The sudden shift in sentiment, compounded by a sharp liquidity drawdown, created the price action we saw this week: stocks, gold, crypto assets, and nearly everything else sold off across the board.
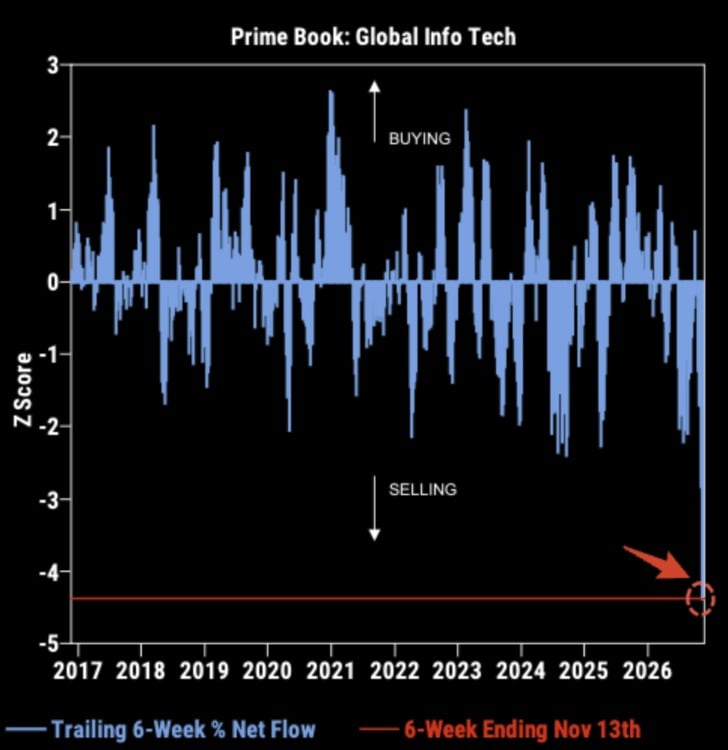
Chart: Net flows for Global IT Prime Books over the past 6 weeks. The 6 weeks ending Nov 13 saw one of the deepest net outflows in a decade.
Hedge funds recorded their largest six-week rolling net outflows in over a decade this month. This was a frantic dash for the exits.
Once liquidity returns, we believe the market will stabilize.
Conclusion: What Comes Next?
This brings us back to the initial question: Is there an "AI bubble," and has it burst?
Our answer is: No.
Without a doubt, the AI revolution is facing one of its harshest tests to date. However, we believe the market has begun pricing in a more pessimistic outcome than what current fundamentals suggest.
We believe the market is in a normal correction. Even if the S&P 500 falls another 10% from current levels, it would still fall within the bounds of a healthy pullback.
If anyone claims the bear market will continue straight through 2027, they are betting that the aforementioned factors will not only materialize but worsen. Current asset valuations already price in substantial negative sentiment. We will remain cautious of the rapidly circulating narrative that "the S&P 500 could fall another 30%+."
The reality is that sentiment has become extremely polarized. As always, we believe this polarization creates opportunities.
At these levels, the market is pricing in a combination of: rates staying higher, aggressive AI regulation, disappointing ROI on AI infrastructure investments, and long-term uncertainty surrounding some of the tech industry's most critical companies. Heading into 2027, there is still significant room for positive surprises.
We are not saying the market has bottomed. Volatility will remain elevated, liquidity will stay tight, and further declines are entirely possible as uncertainty persists.
However, the risk-reward structure is becoming increasingly attractive, particularly for high-quality tech companies with strong balance sheets, accelerating earnings growth, and durable competitive advantages.
We believe a significant portion of the pessimism is already priced in, while the market overlooks the possibility of positive surprises. Once the dust settles, we expect buying the dip to quickly rotate back into high-quality tech stocks, mirroring the setup in April 2025.
For the long term, asset holders will still prevail.
A final note on our strategy: Maintaining objectivity during shocks and adhering to a disciplined process is key to becoming a successful investor.
An objective and systematic approach is precisely why we outperform market benchmarks.
As shown below, our investment strategy has returned nearly five times the S&P 500 since 2020.
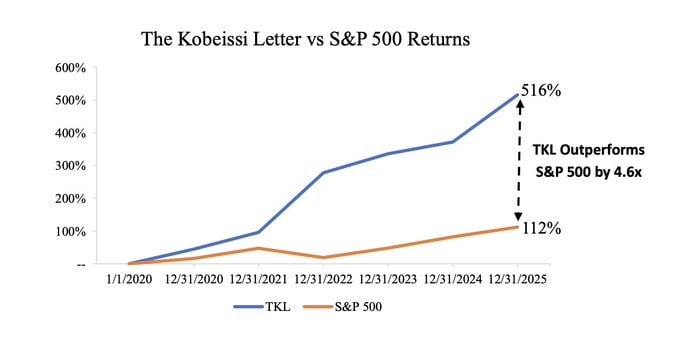
Chart: Return comparison between The Kobeissi Letter strategy and the S&P 500. Strategy returned ~516%, S&P 500 ~112%, outperforming by ~4.6x.
If you wish to receive our paid daily analysis, you can access it by joining the service.
Follow @KobeissiLetter to track ongoing developments on this topic.
Join TechFlow official community to stay tuned
Telegram:https://t.me/TechFlowDaily
X (Twitter):https://x.com/TechFlowPost
X (Twitter) EN:https://x.com/BlockFlow_News
 @KobeissiLetter