
Bitcoin Decouples From AI Rally: Chip Stocks Surge 85% While BTC Drops 39%, Is the "Digital Gold" Narrative Turning?
Author: DWF Labs
Edited by: TechFlow
TechFlow Summary:For a long time, Bitcoin has been hailed as "digital gold," but its linkage trajectory on real balance sheets and trading terminals often runs counter to this reputation. Since the massive liquidity injection of 2020, Bitcoin has essentially evolved over an extremely long cycle into a shadow asset for high-beta tech stocks, exhibiting tight co-movement with the Nasdaq Index.
However, as semiconductor chip stocks recently seize the volatility crown and the AI narrative diverts risk capital, Bitcoin is showing unprecedented signs of asset divergence: negatively correlated with chip stocks on one hand, while its 90-day correlation with traditional gold hits a decade high on the other. Through more than ten years of quantitative data, this article deeply dissects the true macro-linkage code behind Bitcoin.
Since 2020, Bitcoin's linkage with U.S. stocks has been the closest.
Its correlation with the Nasdaq Index leapt from near zero to 0.4; on trading days when the Nasdaq fell 1% or more, Bitcoin followed suit roughly three-quarters of the time, averaging a 2.0% decline, whereas traditional gold barely dipped 0.2% during the same periods.
Meanwhile, Bitcoin's annualized volatility has nearly halved since 2017 (dropping from 90% to 44%). In 2026, the annualized volatility of the semiconductor chip sector even surpassed Bitcoin for the first time in history.
In recent macro narratives, Bitcoin is significantly diverging from AI-driven trades. After removing the noise from the Nasdaq broad market itself, Bitcoin's correlation with chip stocks has been -0.30 since March 2026: when chip stocks outperform the Nasdaq, Bitcoin tends to lag noticeably. From September 2025 to date, the chip sector has surged cumulatively by 85%, while Bitcoin has fallen cumulatively by 39%.
Conversely, Bitcoin's association with gold hit a ten-year high in September (a 90-day correlation of 0.59).
Bitcoin's most well-known label is "digital gold." But in actual trading, to what extent does Bitcoin truly synchronize with gold? If not gold, what asset is it actually resonating with?
Bitcoin's Linkage with U.S. Stocks Is Closest
From 2016 to 2019, Bitcoin traded almost independently of the vast majority of global traditional assets.
During those years, its correlation with equities, gold, U.S. Treasuries, and the dollar index remained consistently weak. The annualized correlation coefficient never exceeded 0.22 nor fell below -0.14, hovering randomly within a narrow positive/negative range with no discernible persistent pattern.
Despite its "digital gold" moniker, Bitcoin's correlation with gold remained weak for most of the past decade: across ten full calendar years, the coefficient stayed between -0.05 and 0.15 for eight of them, with only short-term spikes in 2019 (0.22) and 2020 (0.30). Year-to-date in 2026, their correlation stands at 0.32, marking a historical peak.
This surge in correlation occurred primarily in the summer of 2026. Prior to that, the 90-day rolling correlation between the two hovered around 0.2 until it began climbing rapidly in June, peaking at 0.59 in September—a ten-year high that far exceeded Bitcoin's concurrent correlation with the Nasdaq Index (0.34).
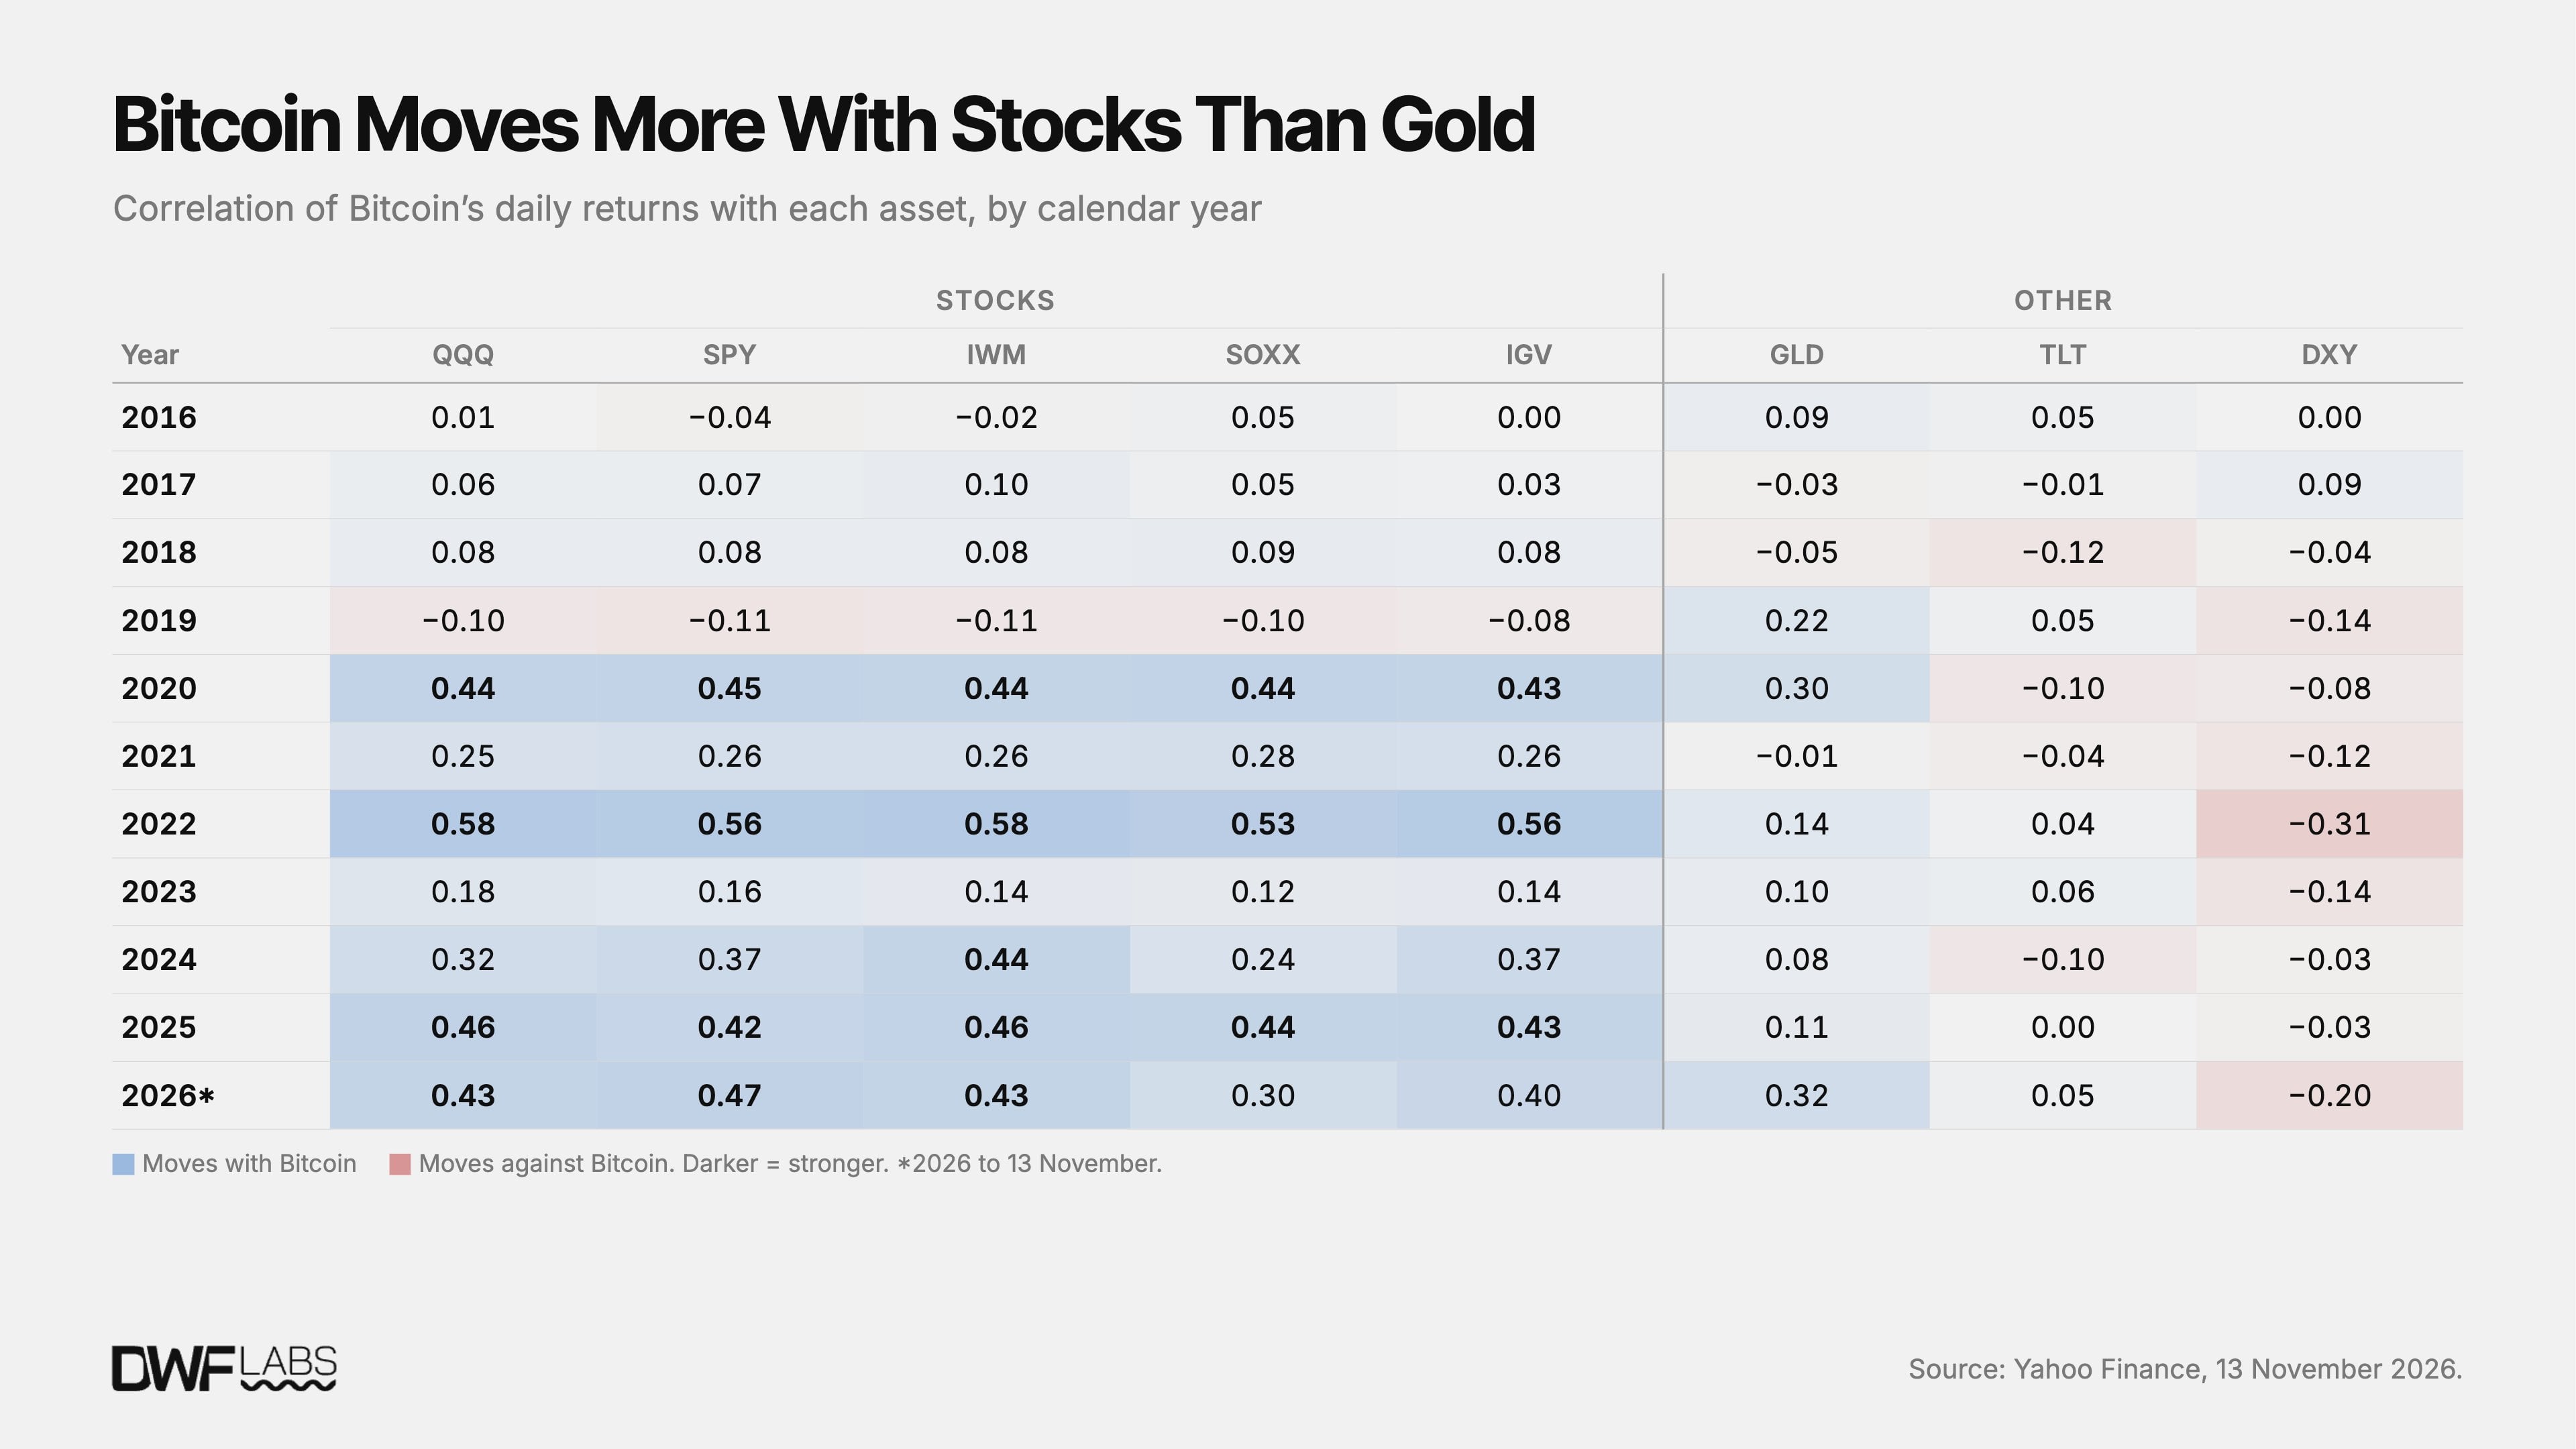
Chart: Overview of Bitcoin's Annualized Correlation with Major Macro Assets from 2016 to 2026
However, viewing the broader picture, U.S. equities remain the asset most tightly coupled with Bitcoin. Whether compared to the S&P 500 (SPY) or the Nasdaq 100 (QQQ), Bitcoin's correlation coefficient was near zero prior to 2020, then quickly climbed to 0.39–0.40 between 2020 and the approval of spot ETFs. Following ETF launches, this correlation has consistently held steady at 0.39. During the liquidity-tightening selloff wave of 2022, the 90-day correlation peak broke through 0.6, while the 30-day peak briefly exceeded 0.8. The massive flood of cheap liquidity released by global central banks from 2020 to 2021 flowed simultaneously into both reservoirs.
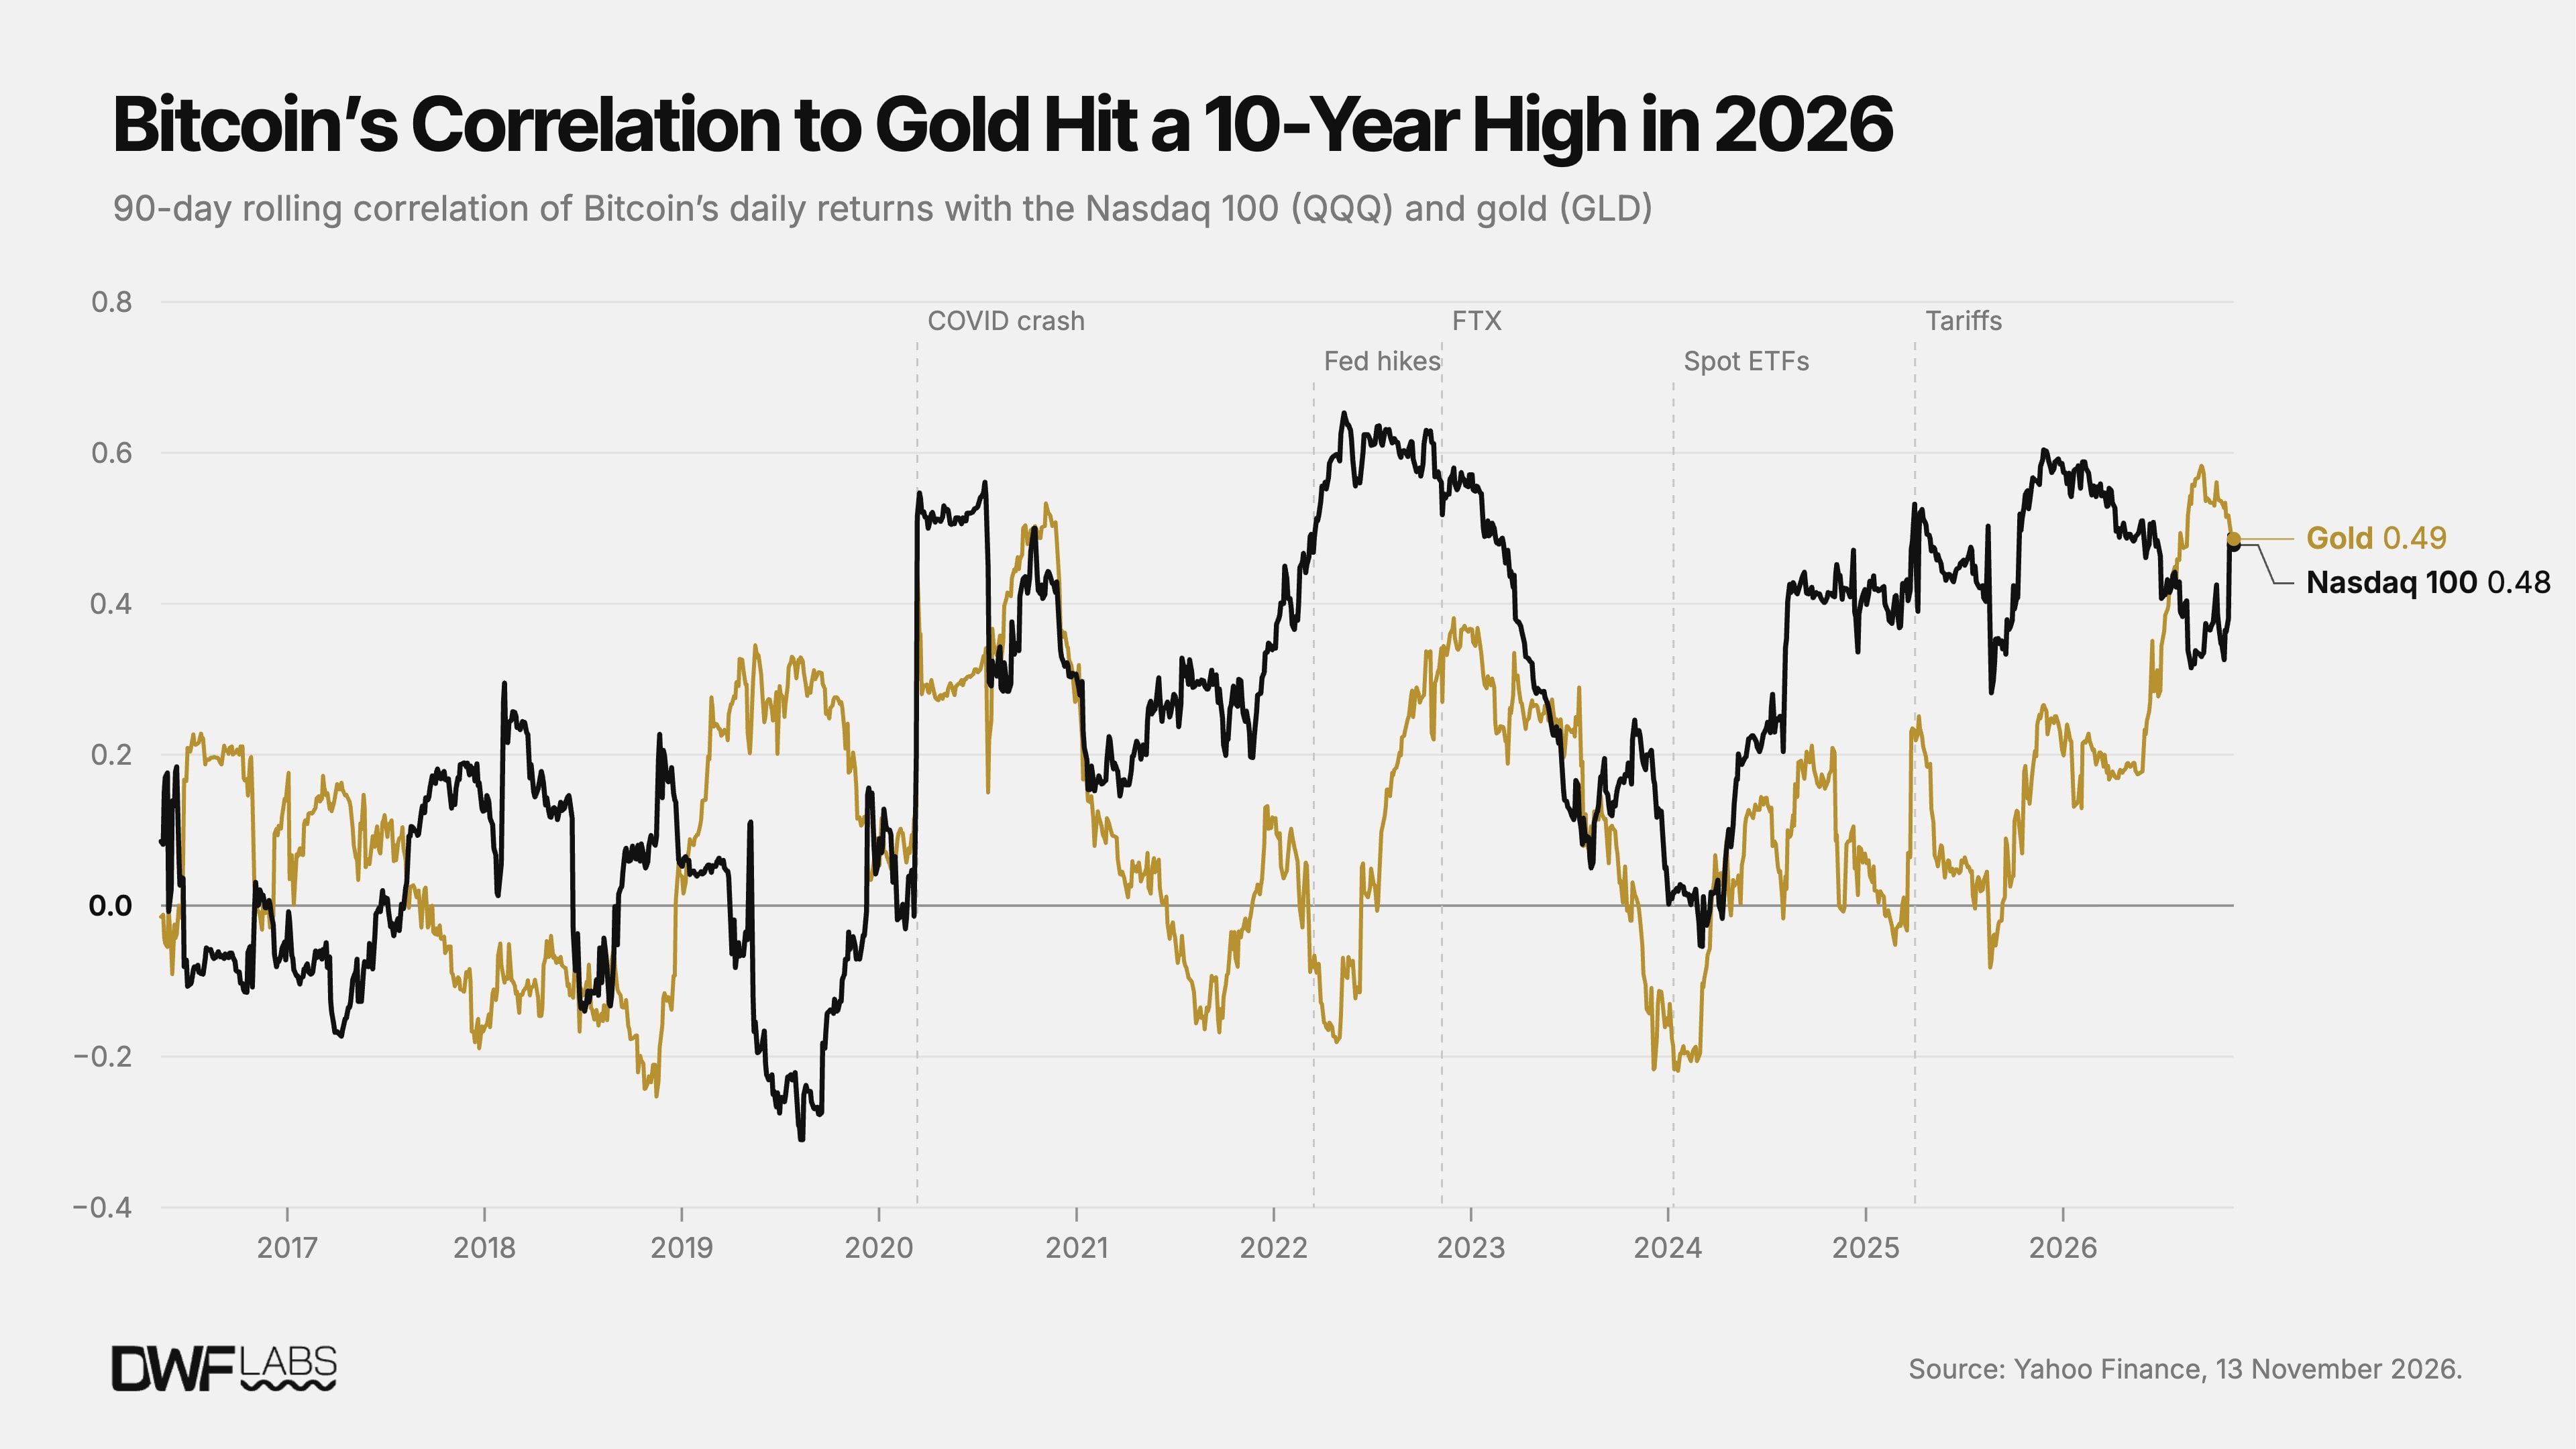
Chart: Historical Trend of Rolling Correlations Between Bitcoin, Nasdaq 100, and S&P 500
A correlation coefficient of 0.4 indicates a moderate, rather than extreme, relationship. Stock market volatility explains roughly one-sixth of Bitcoin's intraday moves. What truly merits attention is its long-term evolutionary trend: shifting from zero linkage to a stable 0.4, it exhibited sharp spikes during previous rounds of systemic deleveraging and selloffs, peaking at 0.65 for the 90-day metric in May 2022.
Other U.S. equity sub-sectors exhibit similar evolutionary trajectories. Correlations between Bitcoin and small-cap stocks (IWM), semiconductor chips (SOXX), and enterprise software (IGV) all surged dramatically in 2020, peaked at 0.58 during the 2022 selloff, then briefly retreated and rebounded in 2023. However, the chip sector has begun decoupling from this group in recent years: correlations with Bitcoin were significantly lower in 2024 and 2026 (at 0.24 and 0.30, respectively) compared to other sectors.
Furthermore, Bitcoin shows a weak negative correlation with the Dollar Index (DXY), most pronounced in 2022 (-0.31) and this year (-0.20). There is no stable linkage pattern with long-dated U.S. Treasuries (TLT), as yearly correlations have merely oscillated narrowly between -0.11 and 0.06. Partly due to a drift in the bond market's own positioning: pre-2020, Treasuries were negatively correlated with U.S. equities, but since 2021, Treasuries and equities have also begun moving in tandem.
Bitcoin Declines More Sharply When U.S. Stocks Slide
When the Nasdaq Index falls 1% or more in a single day, Bitcoin declines along approximately three-quarters of the time: the ratio stood at 74% from 2020 until spot ETF approvals, edged up to 77% post-listing, with an average daily drop of 2.0%.
This is absolutely not how traditional safe-haven assets or stores of value should behave during market panic. By contrast, on trading days where the Nasdaq plunges more than 1%, gold drops only 57% of the time, and its average decline is a mere 0.2%.
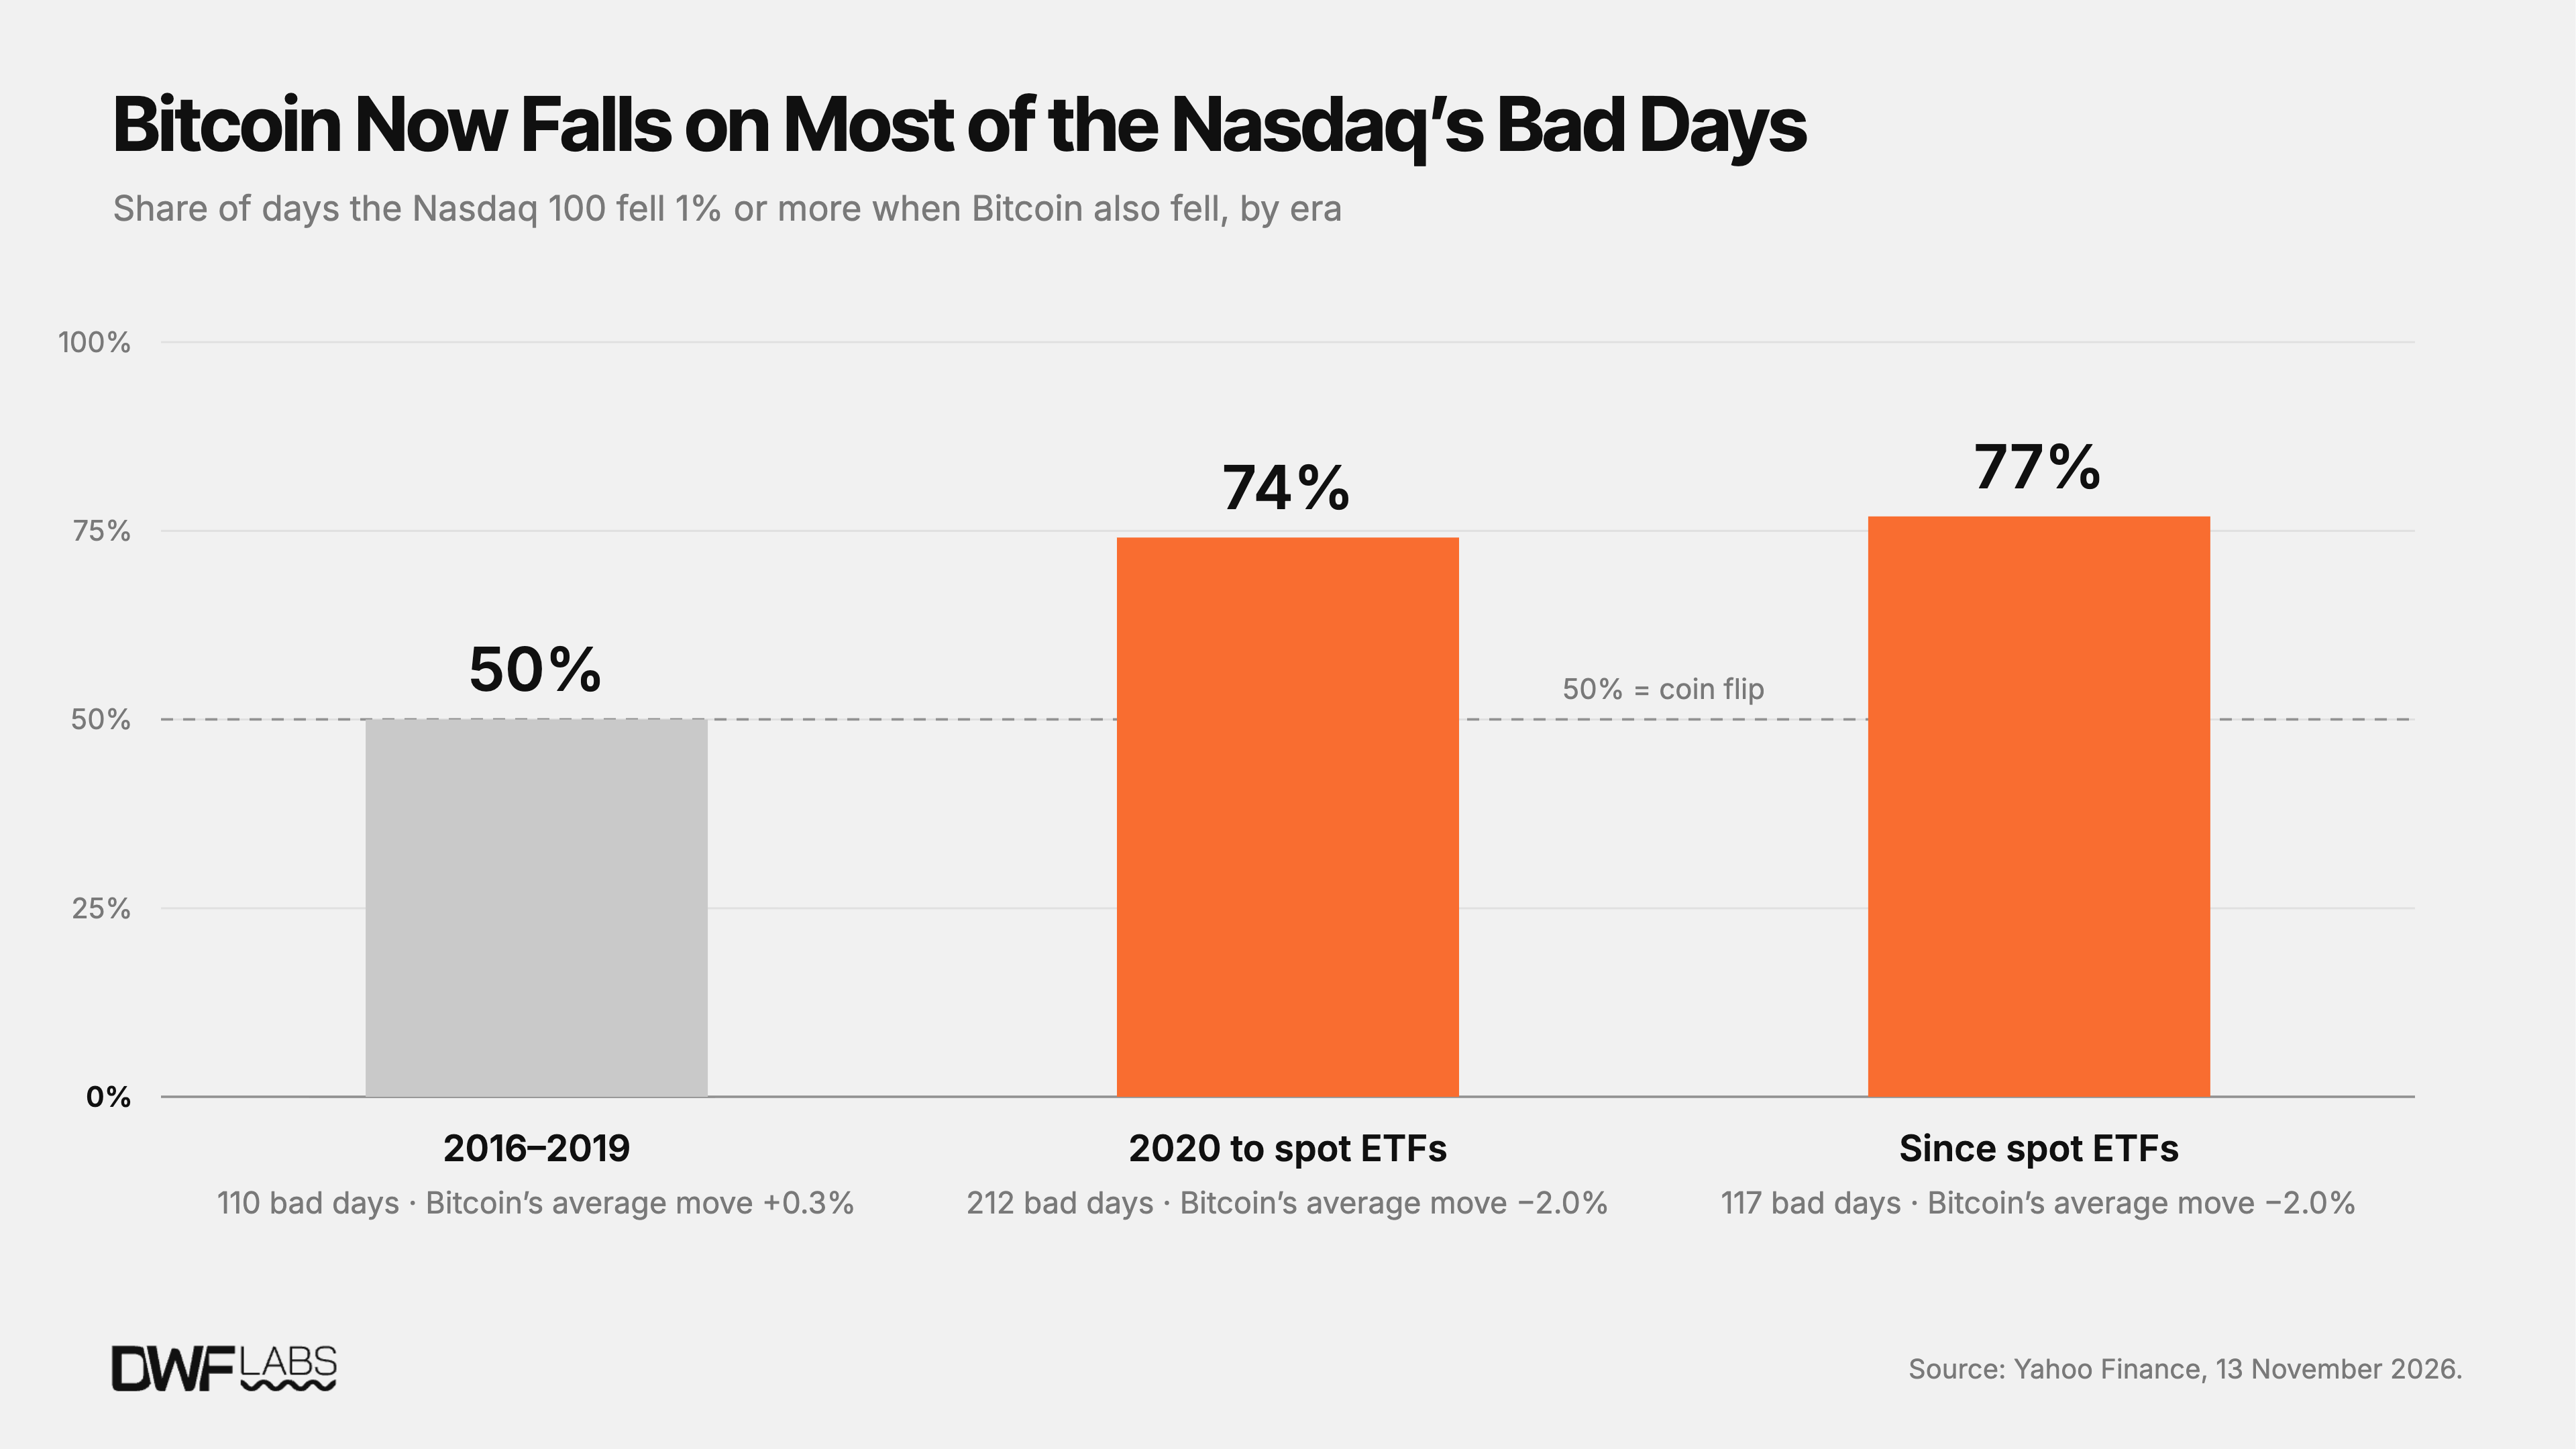
Chart: Comparison of Drawdown Magnitude Between Bitcoin and Gold on Sharp Nasdaq Drop Days
Chip Stocks Seize the Volatility Crown
In 2017, Bitcoin's annualized volatility once soared to a staggering 90%, five times that of semiconductor chip stocks and nine times the Nasdaq Index at the time. Year-to-date in 2026, however, Bitcoin's annualized volatility has dropped to 44%, trailing only slightly above the 40% recorded in 2025—the lowest in the past decade. Even so, its current volatility remains twice that of the Nasdaq Index (22%).
The most unexpected reversal comes from the semiconductor sector (SOXX). Chip stocks' annualized volatility reached 52% in 2026, surpassing Bitcoin for the first time in a decade of quantifiable records. In every single year from 2016 to 2025, Bitcoin was the most volatile among all major asset classes (in 2025, it narrowly led at 40% versus chips at 39%).
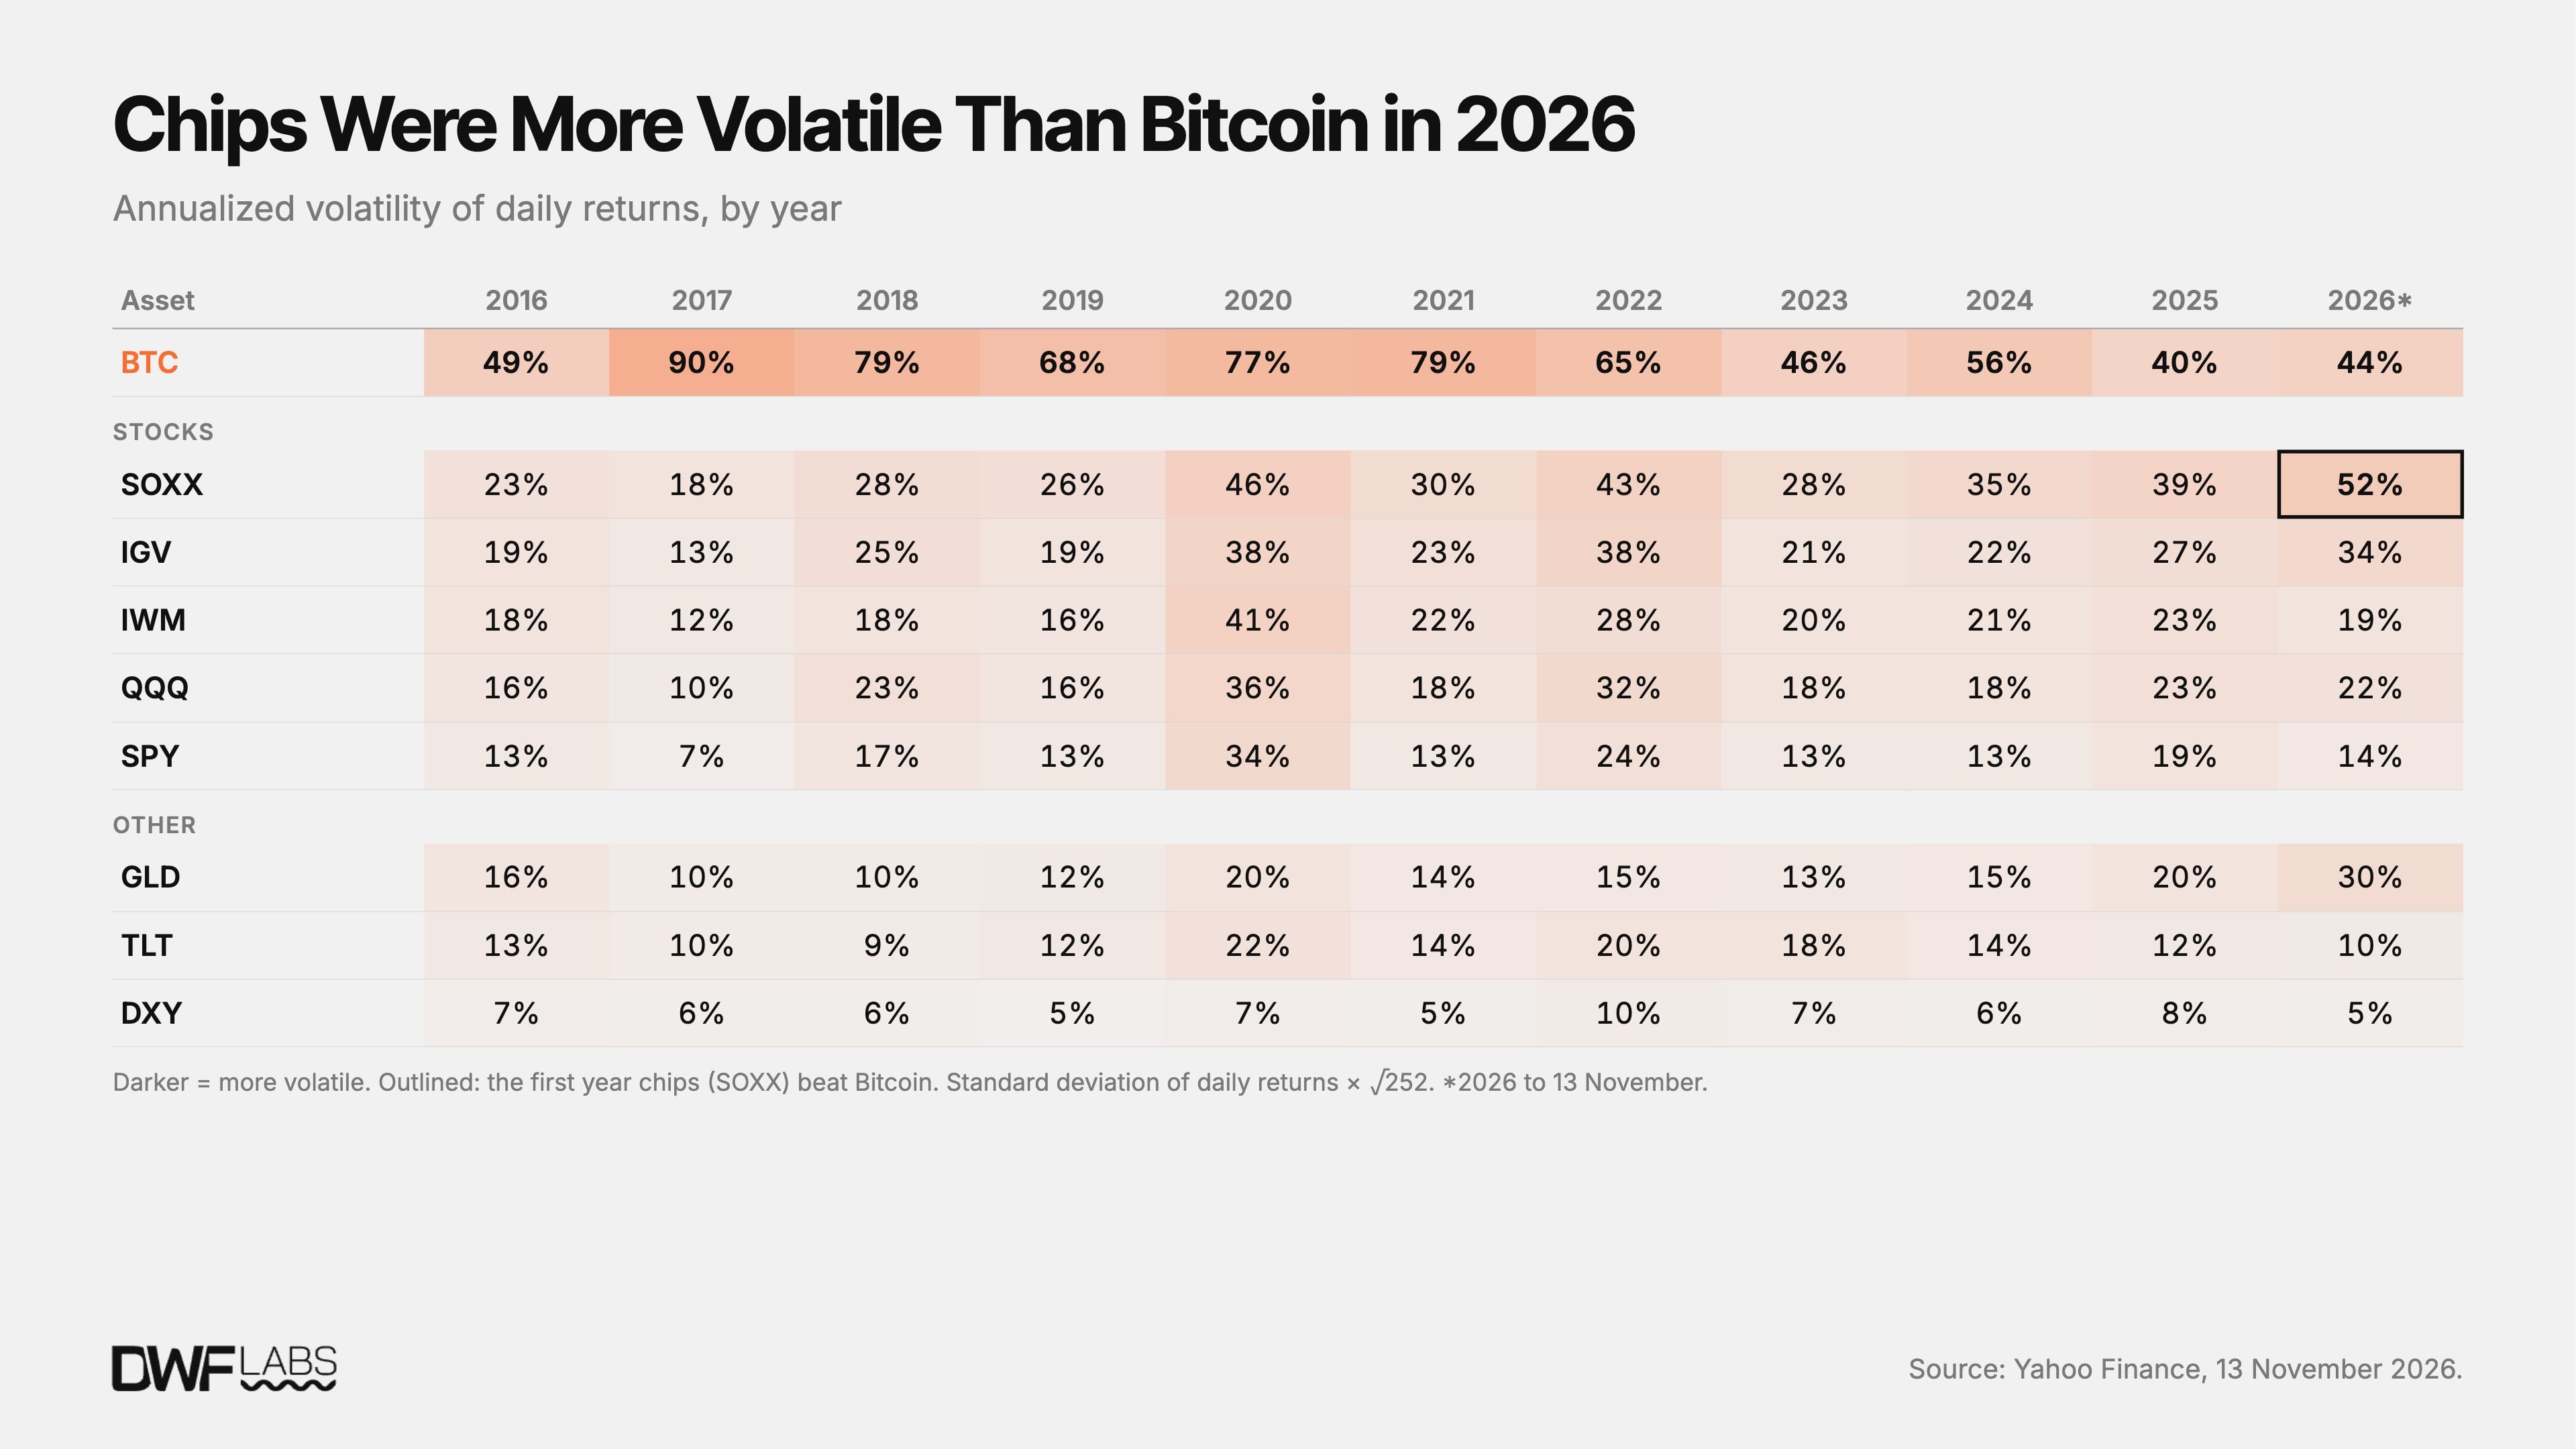
Chart: Comparison of Annualized Volatility Between Bitcoin, Semiconductors, Tech Stocks, and Gold
Since 2017, Bitcoin's volatility has nearly halved (from 90% to 44%), declining almost unidirectionally in every year except for a minor bounce in 2026. Conversely, over the same period, volatility across major U.S. equity sub-sectors and gold has risen comprehensively: Nasdaq annualized volatility climbed from 10% to 22%, software stocks from 13% to 34%, while chip stocks and gold more than tripled, hitting historical highs of 52% and 30%, respectively. Only long-dated U.S. Treasuries and the Dollar Index maintained relatively flat volatility profiles.
The AI Trade Frenzy Is Leaving Bitcoin Behind
The semiconductor chip sector has completely broken free from the Nasdaq broad market's gravitational pull since September 2025. By month-end, the 60-day rolling correlation between chips and the Nasdaq plummeted to 0.61, marking the lowest level since 2018.
Since then, compute-driven chip stocks have surged cumulatively by 85%, the Nasdaq broad market rose 21%, the traditional software sector fell 6%, and Bitcoin plunged heavily by 39%. The AI narrative has become an absolute black hole absorbing macro risk-on liquidity, leaving the crypto market far behind.
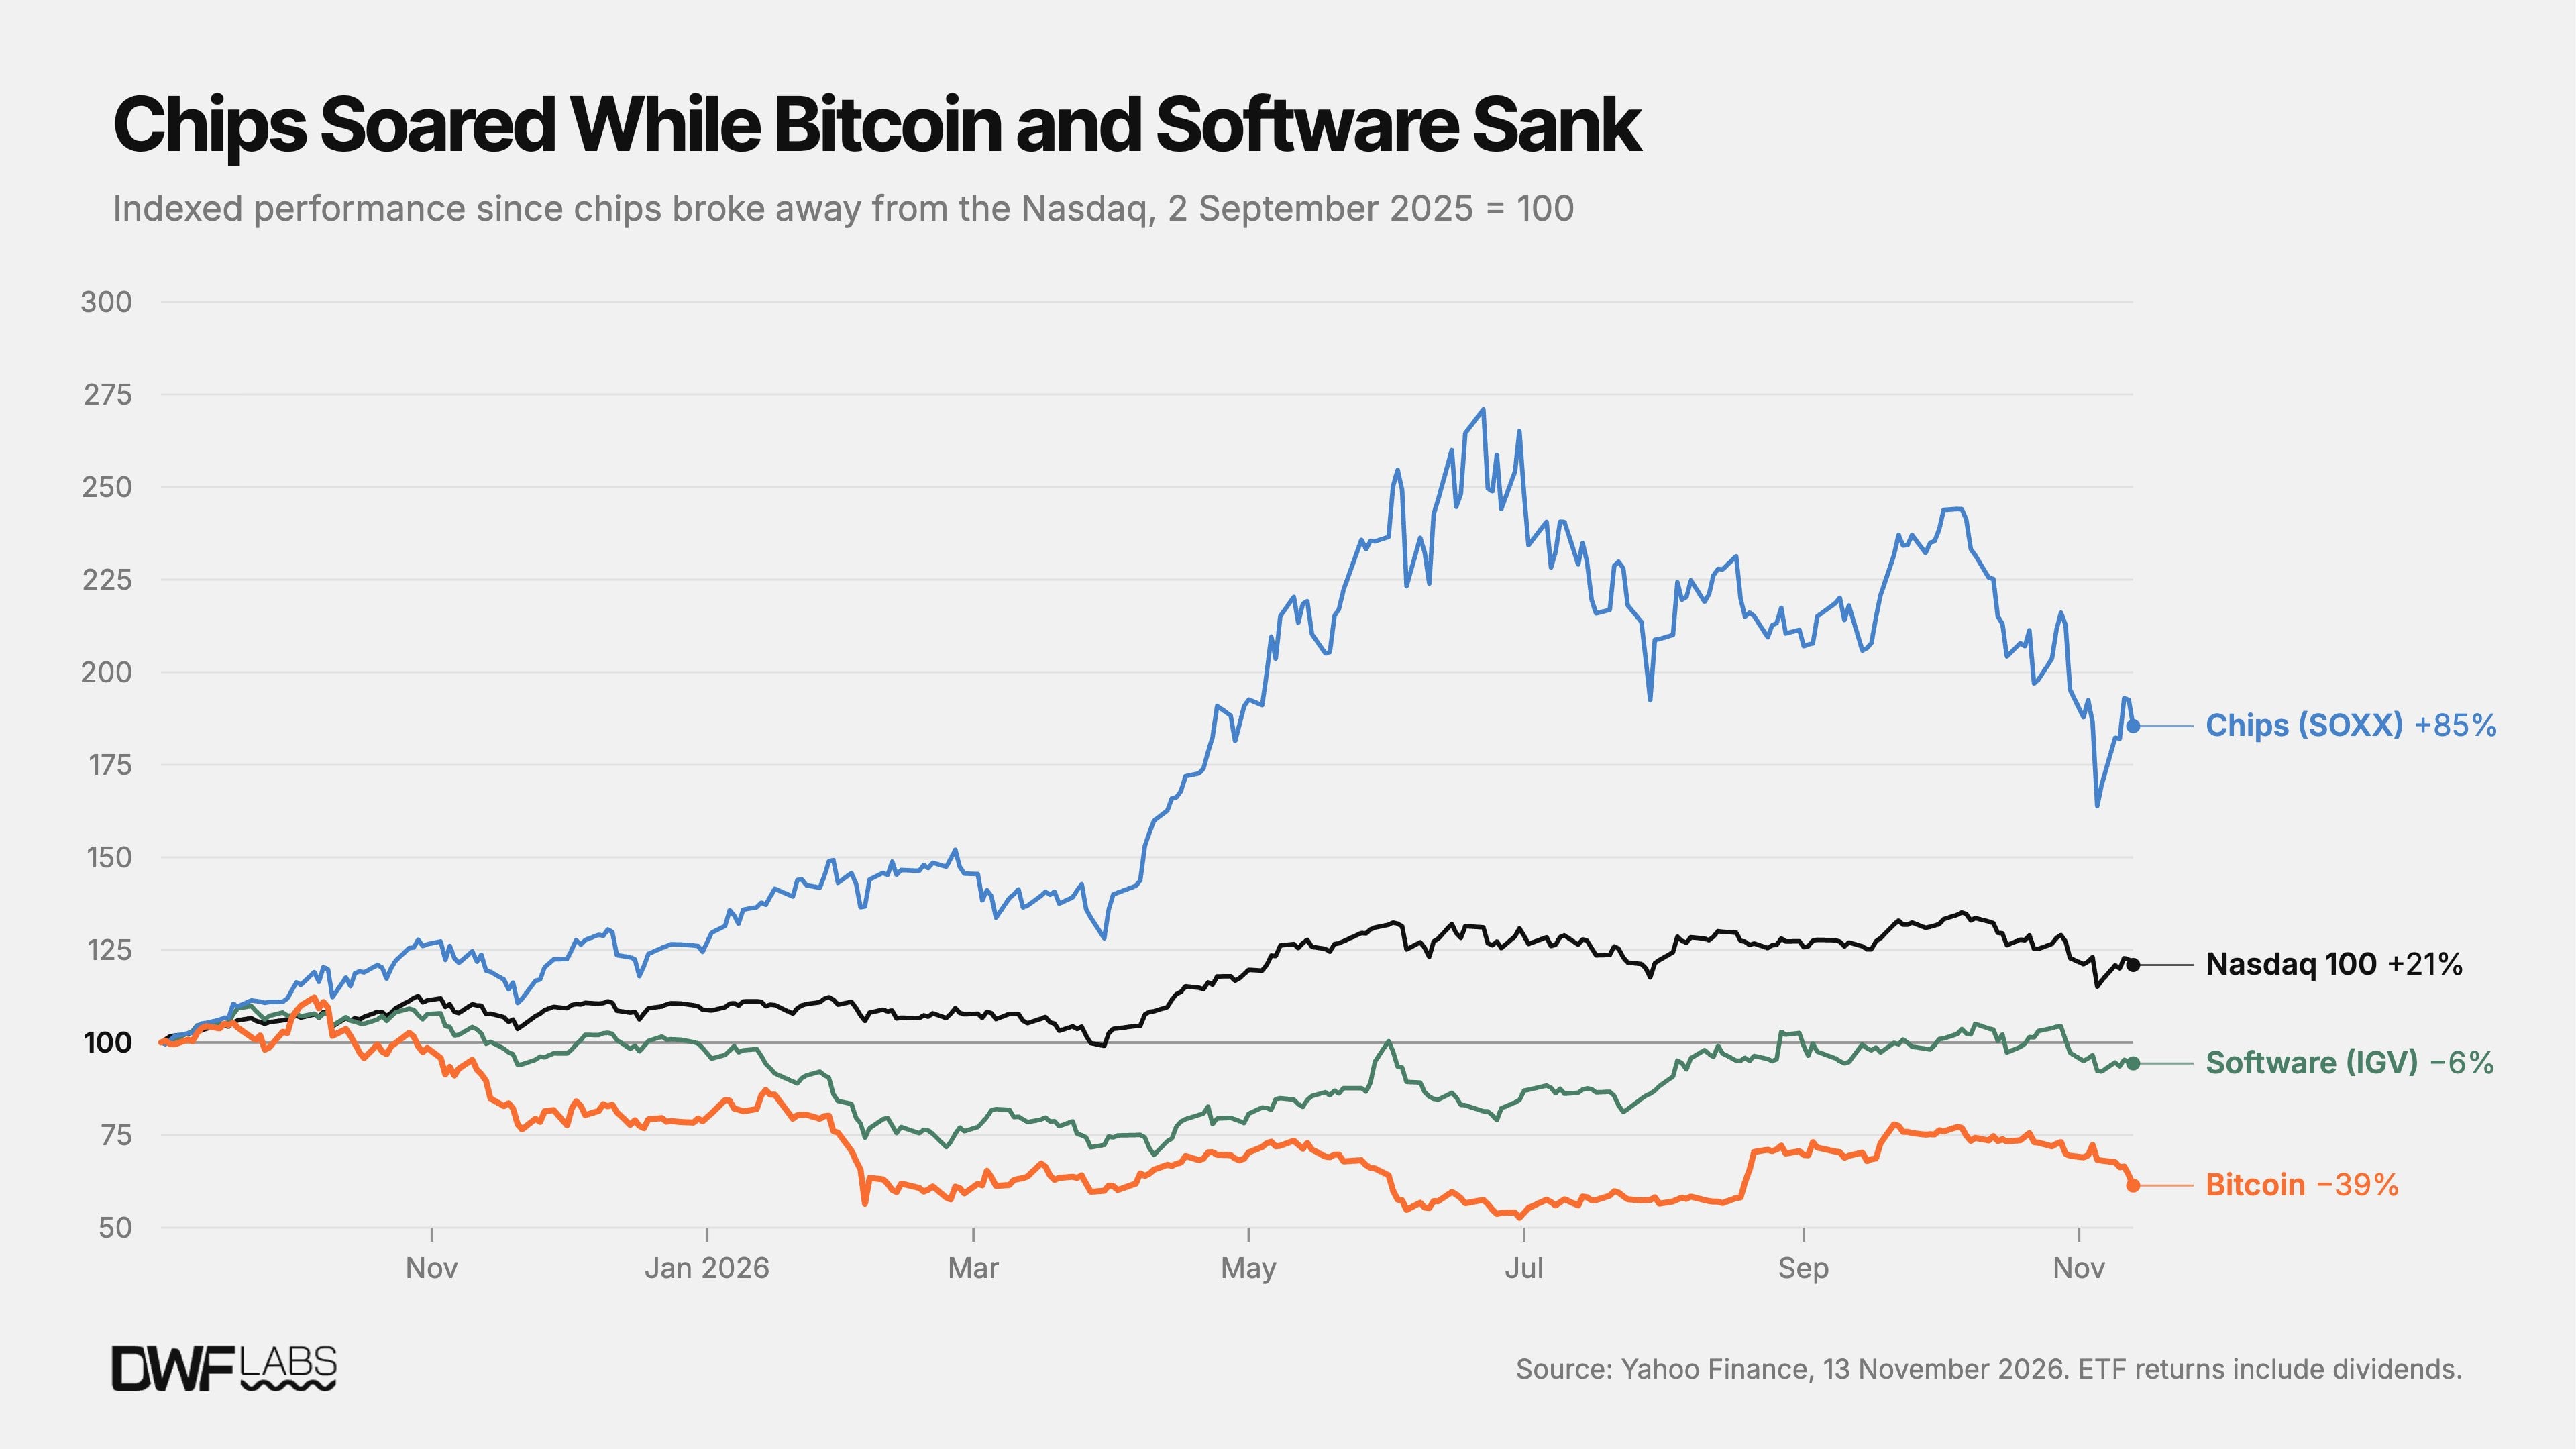
Chart: Sharp Divergence Between Chip Sector Surge and Bitcoin Drawdown Since September 2025
Moving with Software Stocks, Against Chip Stocks
In 2026 surface-level data, Bitcoin still maintains positive correlations with chip stocks (0.30) and software stocks (0.40), but this facade stems primarily from the broad Nasdaq Index's overarching macro pull on all three.
To fully isolate the noise of Nasdaq broad-market gains and losses, we calculated each asset's excess return relative to the Nasdaq: for instance, if the Nasdaq rises 2% one day and the chip sector rises 3%, the chips' relative gain is +1%. Using this baseline, we further test whether Bitcoin's relative excess returns resonate with chip stocks or align with software stocks.
Prior to ChatGPT's launch, Bitcoin's excess return trajectory showed no clear link to either (correlation of 0.02 with chips, 0.03 with software). Post-ChatGPT breakout, Bitcoin began lagging significantly on days when chip stocks led (correlation of -0.11). Meanwhile, from September 2025 onward, Bitcoin started trending closely with software stocks (+0.35), though a brief period of synchronized movement occurred earlier when a broad tech selloff in late 2025 dragged chips along (+0.18). However, since March 2026, this divergence has been firmly established: Bitcoin's excess return trajectory shows a positive correlation of +0.20 with software stocks, alongside a clear negative correlation of -0.30 with chip stocks.
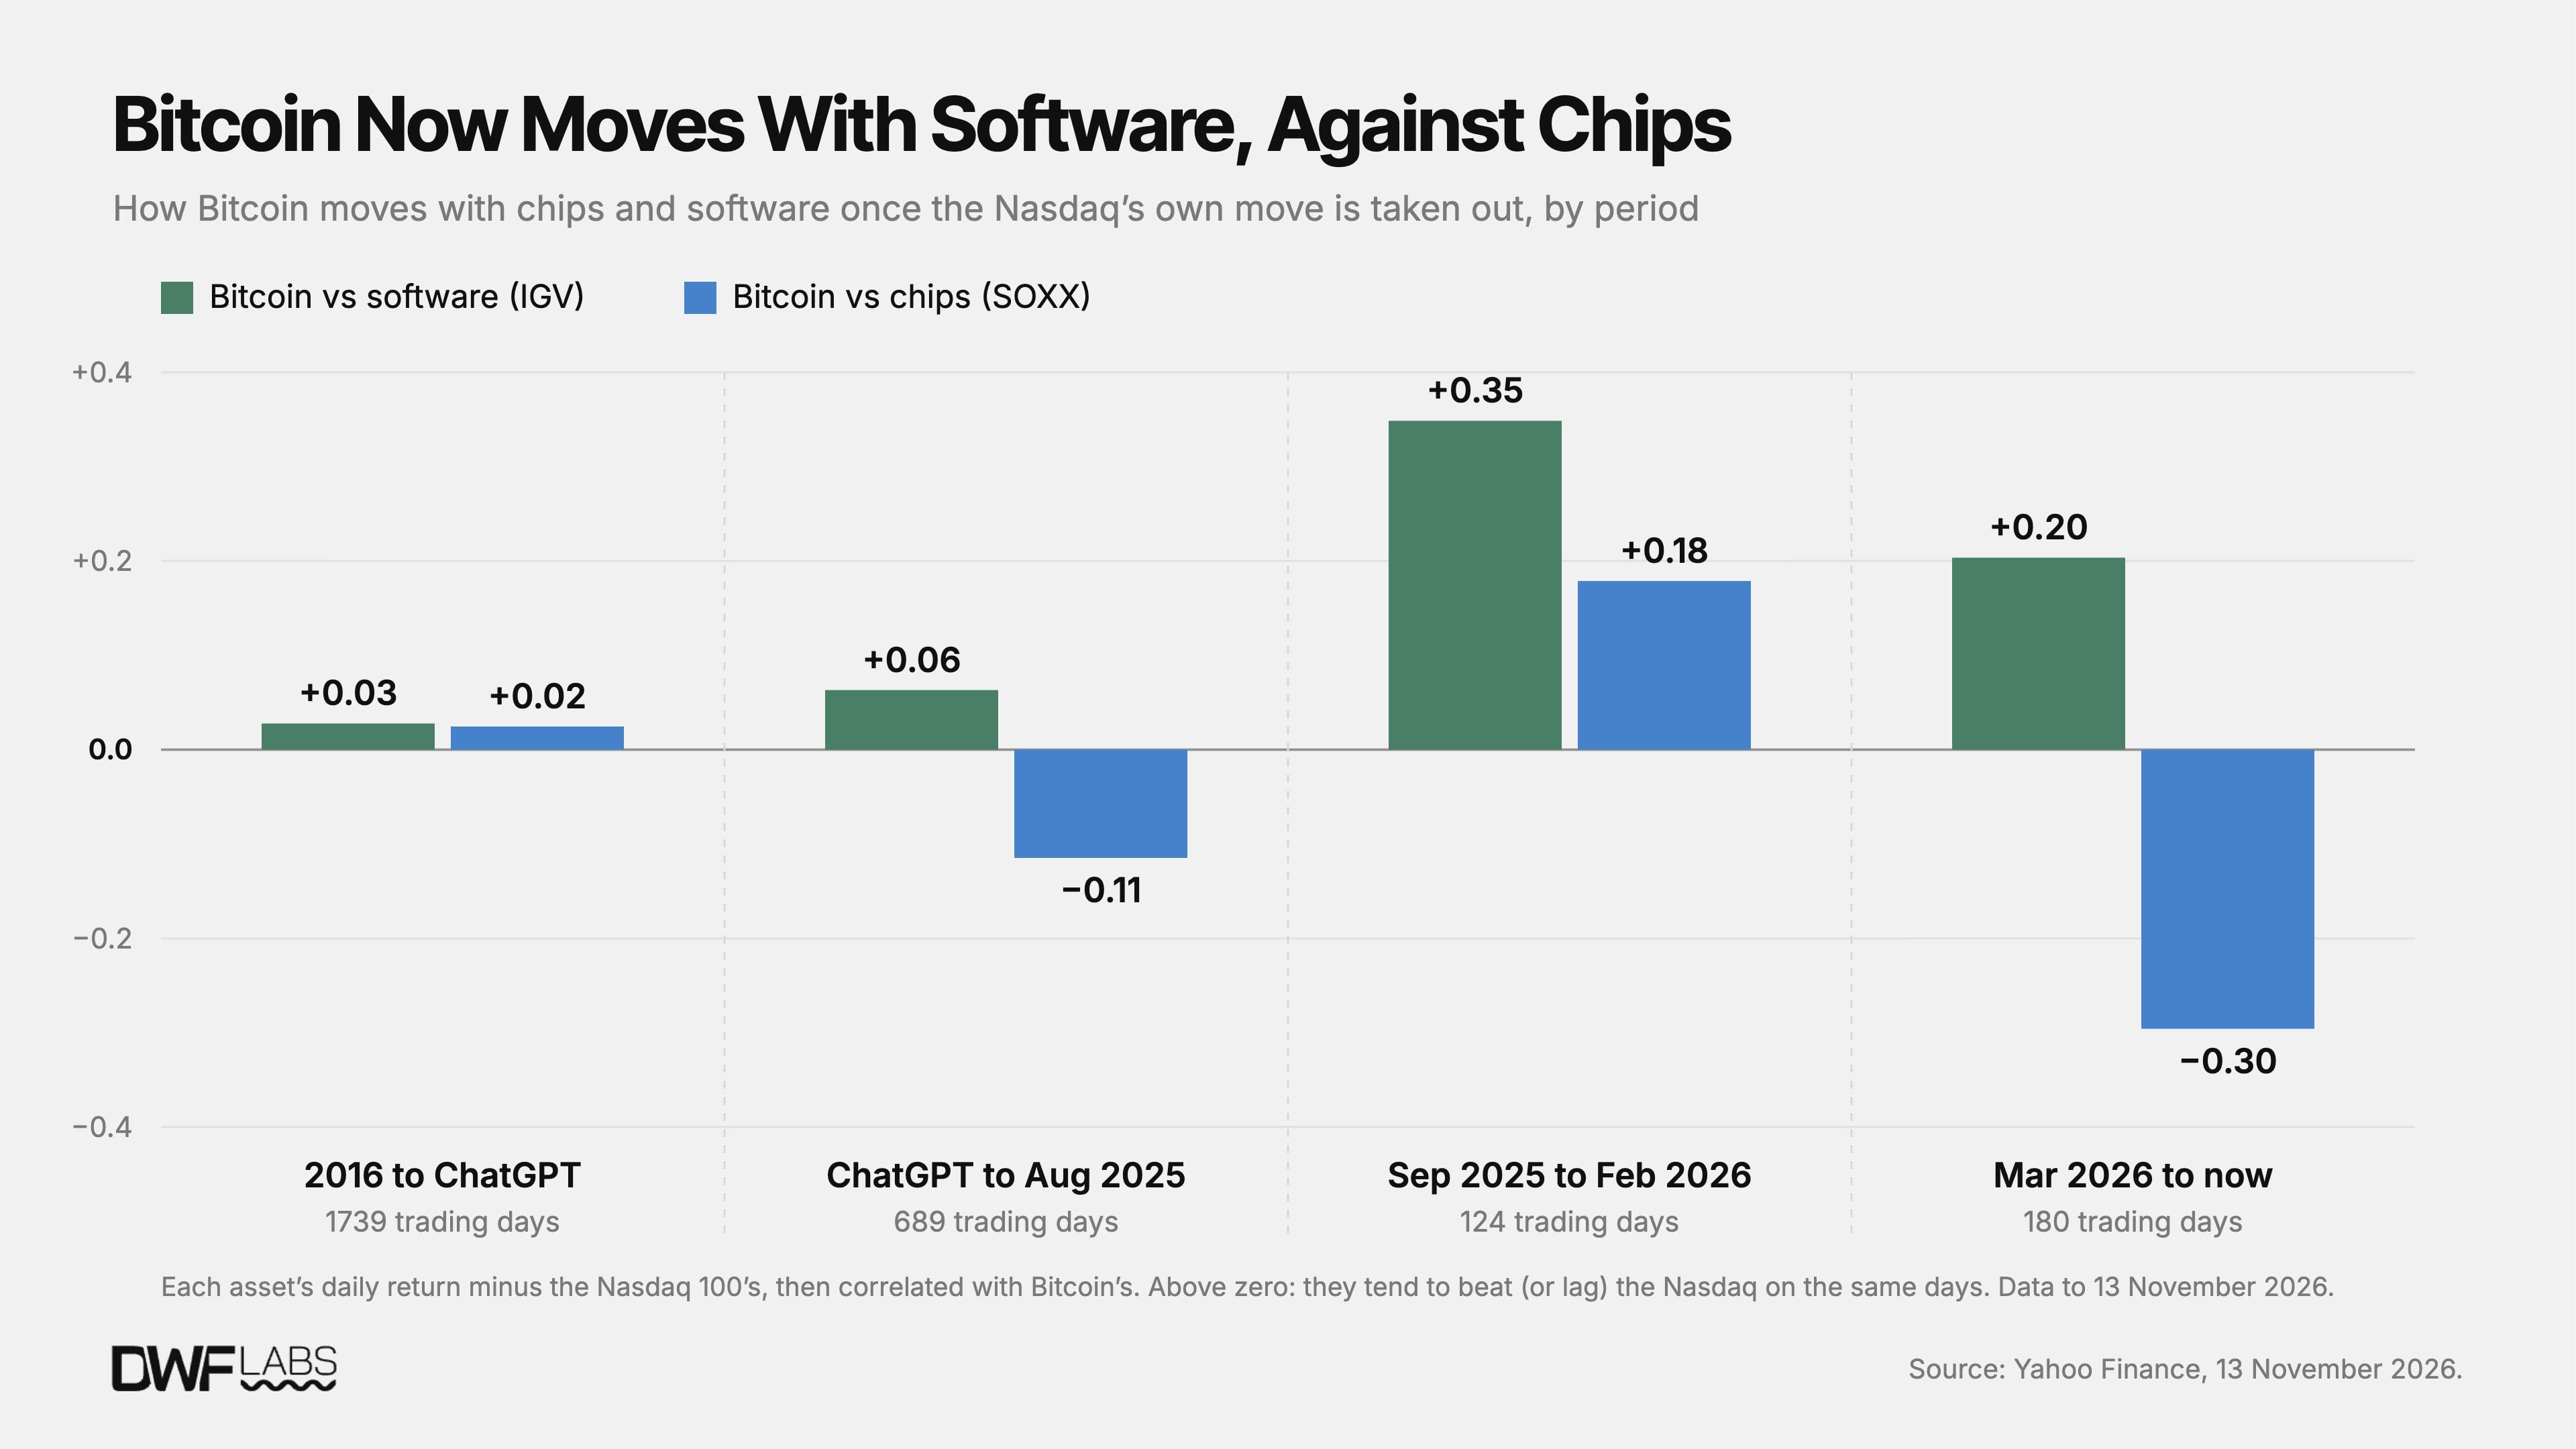
Chart: Daily Relative Return Correlation Between Bitcoin, Chips, and Software After Removing Broad Market Impact
Monthly returns measured using the identical method point to the exact same conclusion. Since ChatGPT's emergence, Bitcoin's monthly relative returns against the Nasdaq have moved inversely to the chip sector (negative correlation reaching -0.33, previously just -0.07). In the 22 months where chips outperformed the Nasdaq, Bitcoin underperformed the index by an average of 1.2%; conversely, in the 25 months where chips lagged the broad market, Bitcoin outperformed by an average of 3.6%. Pre-ChatGPT, this industry rotation had virtually zero impact on Bitcoin (outperformance months averaged +3.3%, lagging months averaged +3.4%).
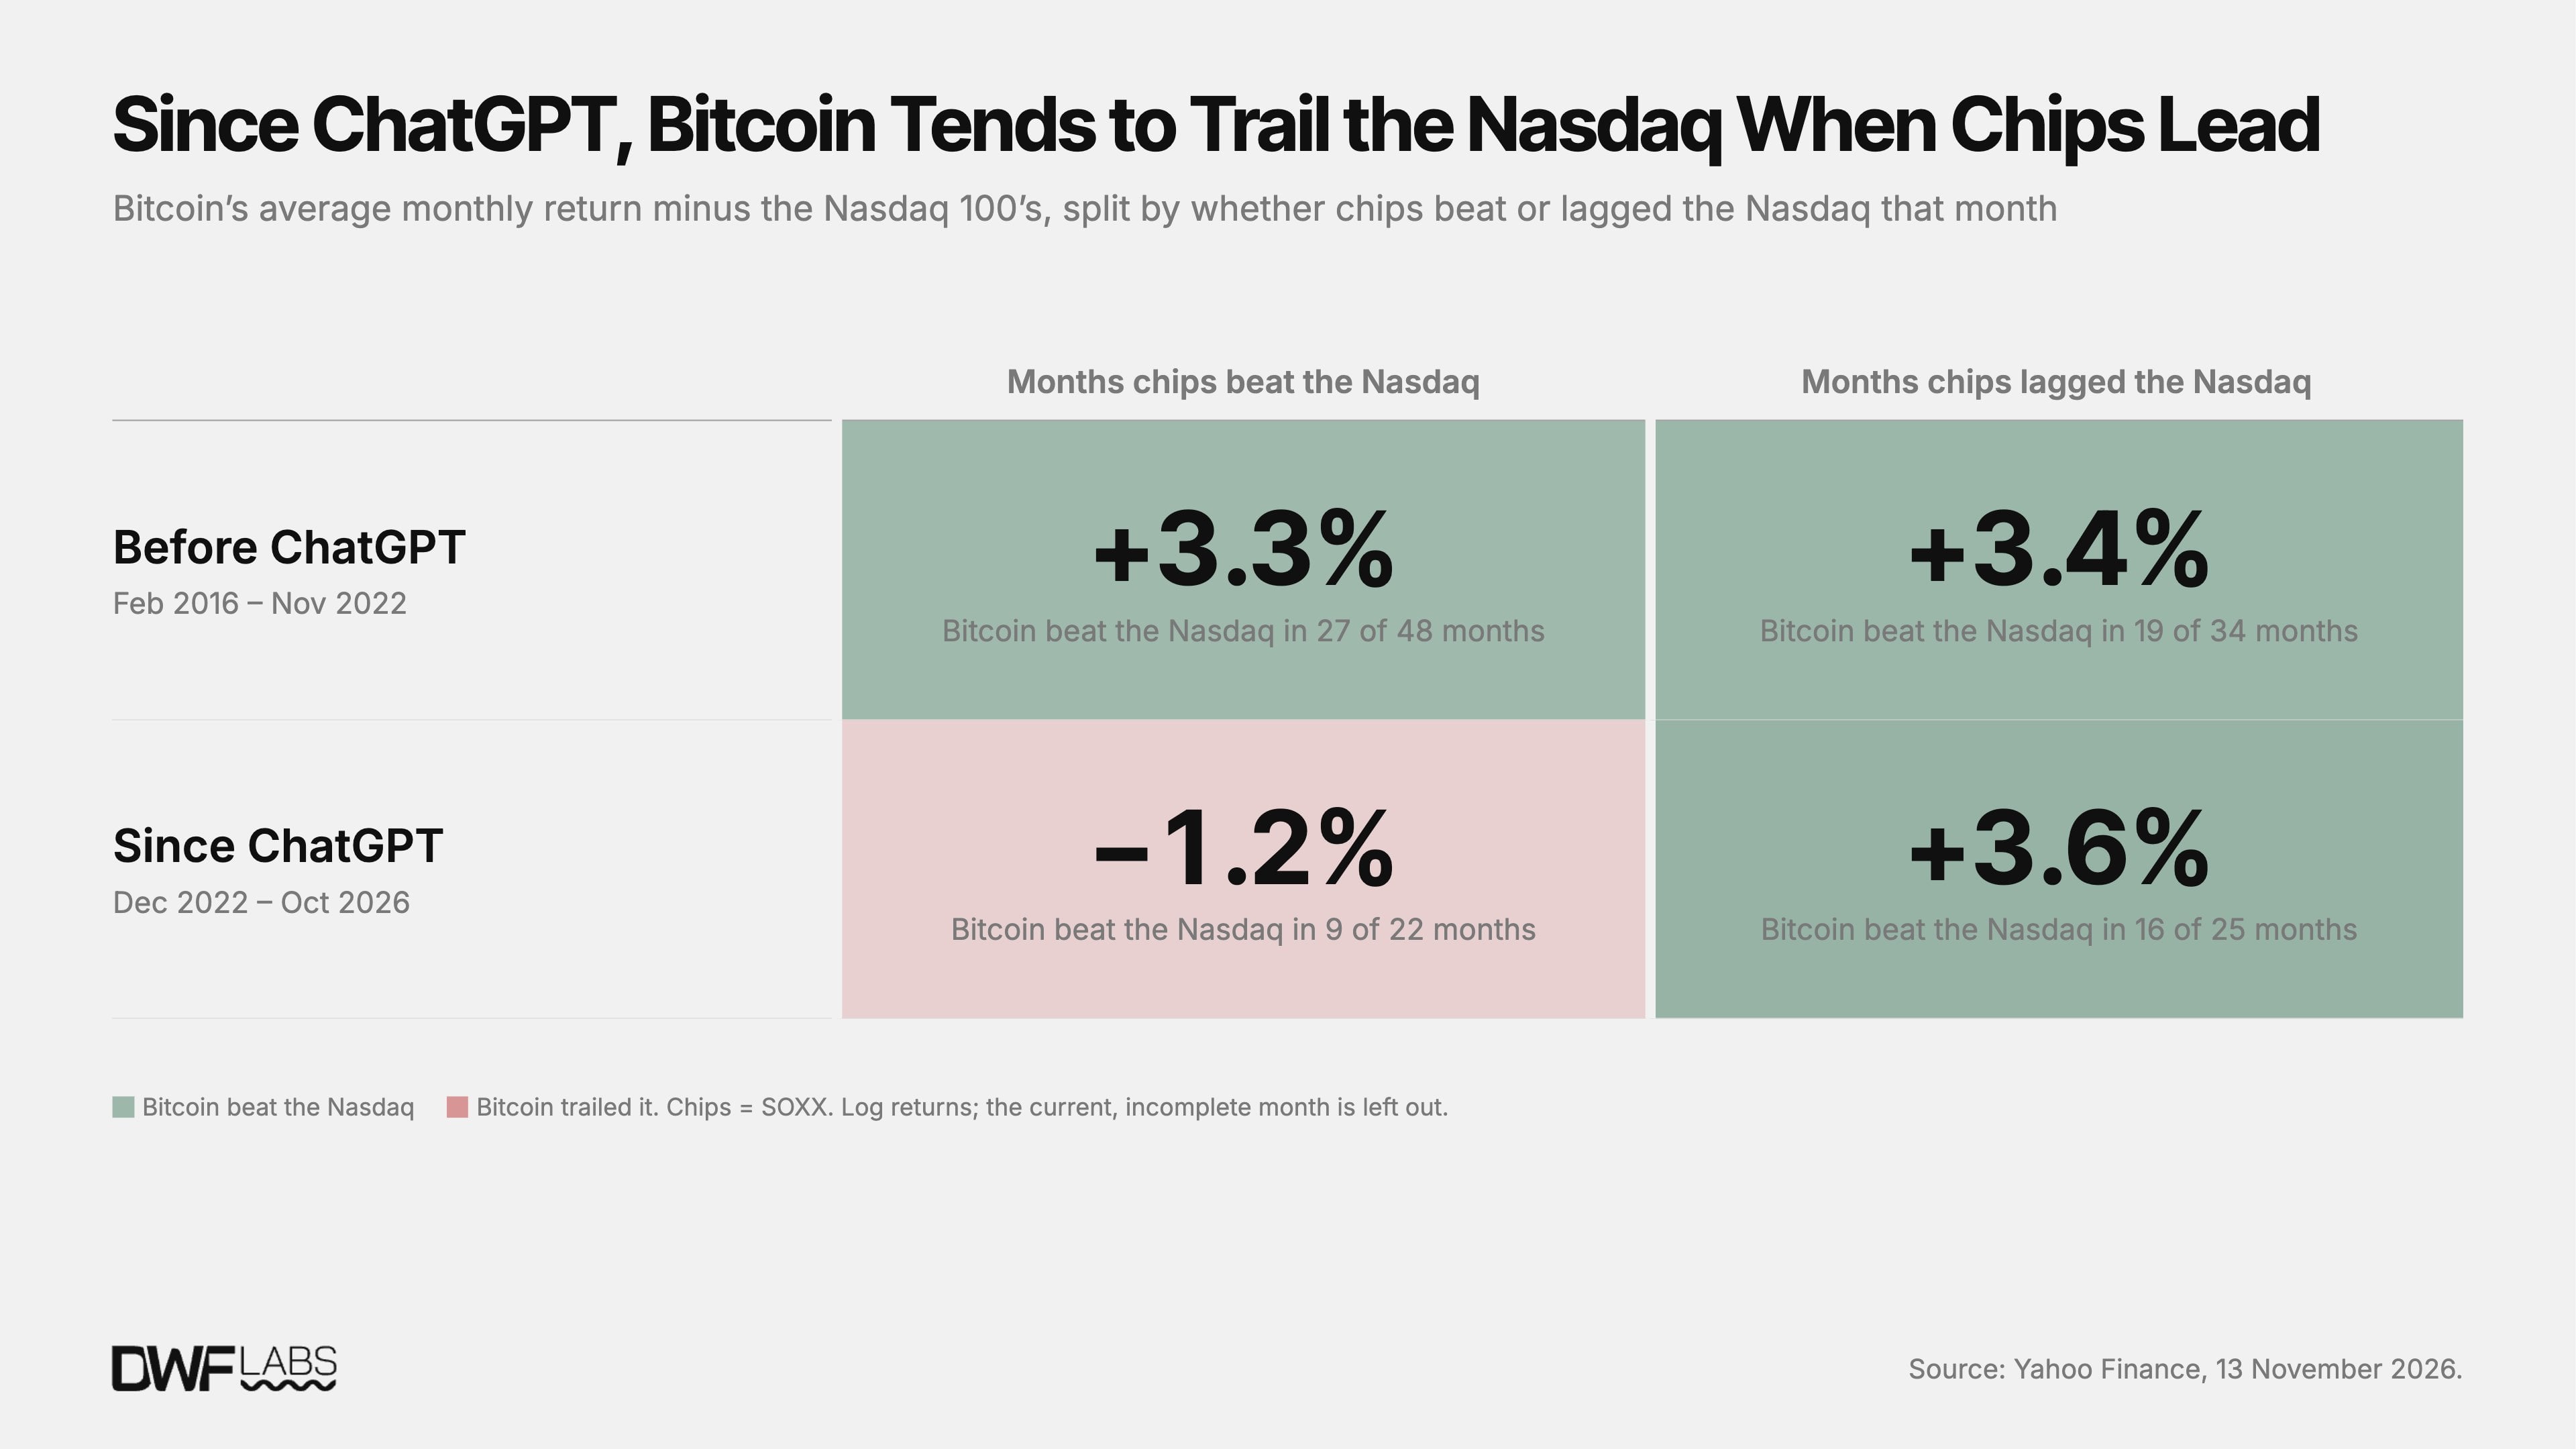
Chart: Monthly Perspective on the Relative Strength Game Between Bitcoin and the Chip Sector
Risk Profile Unchanged, But Slowly Converging Toward Safe-Haven Assets
Historical data clearly demonstrates: fundamentally, Bitcoin remains a risk-on asset, not a safe haven. Since 2020, its rhythm has always tracked most closely with equity markets, not gold.
Yet simultaneously, Bitcoin's intrinsic characteristics are undergoing transformation: its absolute volatility has halved compared to 2017, yielding the volatility crown to chip stocks for the first time this year. Although its current amplitude remains double that of the Nasdaq, the overall asset profile is noticeably cooling and stabilizing.
The past year has added two fascinating new variables to Bitcoin's positioning: first, it was sidelined in this round of core AI-driven risk trades, increasingly correlating with sluggish traditional software sectors rather than capitalizing on hardware compute booms since March 2026; second, its linkage with traditional gold has hit a near-decade high. The 90-day correlation peaked at 0.59 in September and currently hovers around 0.49, matching Nasdaq levels.
If this positive resonance with gold continues to deepen in the future, and Bitcoin's volatility continues to steadily converge, then perhaps that will be the dawn moment when it truly possesses the safe-haven asset qualities long anticipated by the market.
Appendix: Statistical & Quantitative Methodology
· Data Sample: Sourced from adjusted daily closing prices on Yahoo Finance, spanning January 4, 2016, to November 13, 2026 (U.S. stock exchange regular trading days only).
· Underlying Substitution: Each sub-sector index is replaced by its corresponding core ETF, including Nasdaq 100 (QQQ), S&P 500 (SPY), Russell 2000 Small-Cap (IWM), Semiconductor Chips (SOXX), Software Sector (IGV), Gold Trust (GLD), Long-Dated U.S. Treasuries Maturing in 20+ Years (TLT), and Dollar Index (DXY).
· Returns & Volatility: Returns are calculated using logarithmic yields; annualized volatility is derived from the standard deviation of daily returns multiplied by √252; correlations are measured via Pearson correlation coefficients of daily returns. Bitcoin's daily closing price is taken at 00:00 UTC, roughly 3 to 4 hours after U.S. equity market close; weekly return calculations yield slightly lower figures, but overall trends and conclusions remain completely consistent.
· Period Segmentation: History is divided into three major epochs: 2016 to 2019, 2020 to January 10, 2024, and from the spot ETF approval and launch on January 11, 2024, to present. Relative movements are defined as each asset's single-day logarithmic return minus QQQ's logarithmic return.
· Beta Adjustment: After adjusting for beta sensitivity (measuring each asset's slope weight in following Nasdaq gains and losses), the 2026 calculation results remain largely consistent: -0.22 for Bitcoin vs. chip stocks, and +0.25 for software stocks. Monthly statistics exclude incomplete, unclosed data for the current month; ETF return calculations fully account for dividend reinvestment.
Join TechFlow official community to stay tuned
Telegram:https://t.me/TechFlowDaily
X (Twitter):https://x.com/TechFlowPost
X (Twitter) EN:https://x.com/BlockFlow_News
 @DWFLabs