![In-depth Analysis of Trade[XYZ]: How Were 92 Markets and 98% HIP-3 Trading Volume Established?](https://upload.techflowpost.com/upload/images/20260716/20260716061117965147.jpeg)
In-depth Analysis of Trade[XYZ]: How Were 92 Markets and 98% HIP-3 Trading Volume Established?
TechFlow Selected TechFlow Selected
In-depth Analysis of Trade[XYZ]: How Were 92 Markets and 98% HIP-3 Trading Volume Established?
Will Trade[XYZ] kill Hyperliquid? No.
 Navigating Web3 tides with focused insights
Author: Mohit Pandit
Compiled by: TechFlow
Original Link: https://mohitpandit.substack.com/p/is-tradexyz-existential-to-hyperliquid
TechFlow Editor's Note:Trade[XYZ] accounts for 98% of HIP-3 trading volume on Hyperliquid, and many worry it will become the guest who outstays the host. But data shows Trade[XYZ] built an institutional-grade stock perpetual contract market in 8 months, bringing 300,000 users to Hyperliquid, 97% of trading happens on the Hyperliquid frontend, and both sides take half the fees—this is not a threat, but a successful validation of Hyperliquid's strategy of "open infrastructure, let professional teams compete, liquidity decides the winner".
(Data as of June 2026) With every rise in HIP-3 open interest, every basis point jump in trading volume share, every new pre-IPO asset listing, every tweet about Hyperliquid leading price discovery for the world's largest and most watched assets, the voice in everyone's head grows louder.
Is Trade[XYZ] an existential threat to Hyperliquid? Did Hyperliquid hand over the keys to the kingdom? If Trade[XYZ] launches a token, will HYPE be doomed?
I intend to use data and first principles to argue why I believe Trade[XYZ] is additive to Hyperliquid, and consequently to HYPE.
The conventional argument is narrow: Trade[XYZ] locks HYPE, lists and operates new markets, generates trading fees, and funnels fees back into HYPE buybacks. This is indeed correct, but in my view, it underestimates the relationship between Hyperliquid and the deployer, specifically here, @tradexyz. The reality is, Trade[XYZ] built the hardest thing in this category in 8 months: a true liquidity market for stock, index, commodity, and forex perpetual contracts, and proved that HIP-3 can carry non-crypto perpetual contract verticals with institutional-grade liquidity built by professional teams, while Hyperliquid retains users, matching engine activity, fee sharing, auction demand, and ecosystem narrative, without directly bearing listing or regulatory responsibilities.
There Are Two Paths to Building a Large Derivatives Exchange
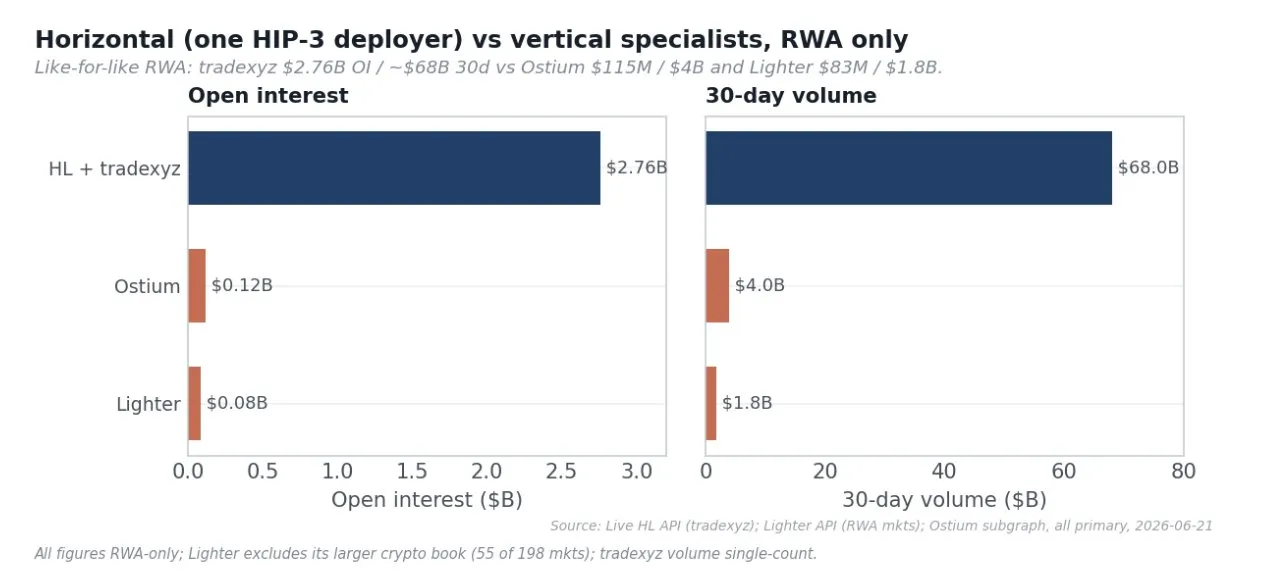
The vertical path is to build all markets yourself, acquire assets, run oracles, recruit market makers, bear risks, and keep all profits; Lighter and Ostium (pure RWA) are vertically integrated products. The horizontal path is to provide the underlying layer, allowing permissionless deployers to build markets on top and share fees; this is Hyperliquid's HIP-3, and @tradexyz is one of the deployers. But if you understand HIP-3 as being horizontal for the sake of being horizontal, that is wrong. The correct way to understand it should be: this is an access application.
Hyperliquid's belief is that the lasting advantage of on-chain finance lies in core infrastructure—L1, clearing house, matching engine—and the core team spends almost all their energy on this. The bet is: the best operators will choose to build on this infrastructure, and to attract the best operators, it needs to constantly evolve towards high performance and neutrality. There is only one CME, one NYSE, one Hong Kong Exchange in the world. Liquidity attracts liquidity; a category without a single deep liquidity winner has actually lost. Hyperliquid's ambition is to become the home for all finance, the neutral substrate upon which winners in various categories build, and HIP-3 is the mechanism to achieve this. It does not designate winners, but opens the track, inviting the best operators to compete to build the deepest markets, letting liquidity itself decide. The ultimate winner will bring huge value back to Hyperliquid: fees, buybacks, users, while also retaining real rewards for themselves. From this perspective, concentration is not a failure of the model; this is the model operating as finance always has.
However, there are many objections to this model, which I think should be heard fairly.
The first is that Hyperliquid is giving up future value, letting the deployer keep about half the fees and own the franchise, giving up the profits it could have captured by building stock perpetual contracts itself. The second is sharper: HIP-3 is vertical integration in disguise. One deployer accounts for about 98% of HIP-3 trading volume, triggering accusations of favoritism (often pointing to the connection between Trade[XYZ] and the Unit ecosystem), while Hyperliquid still takes 50% of the fees.
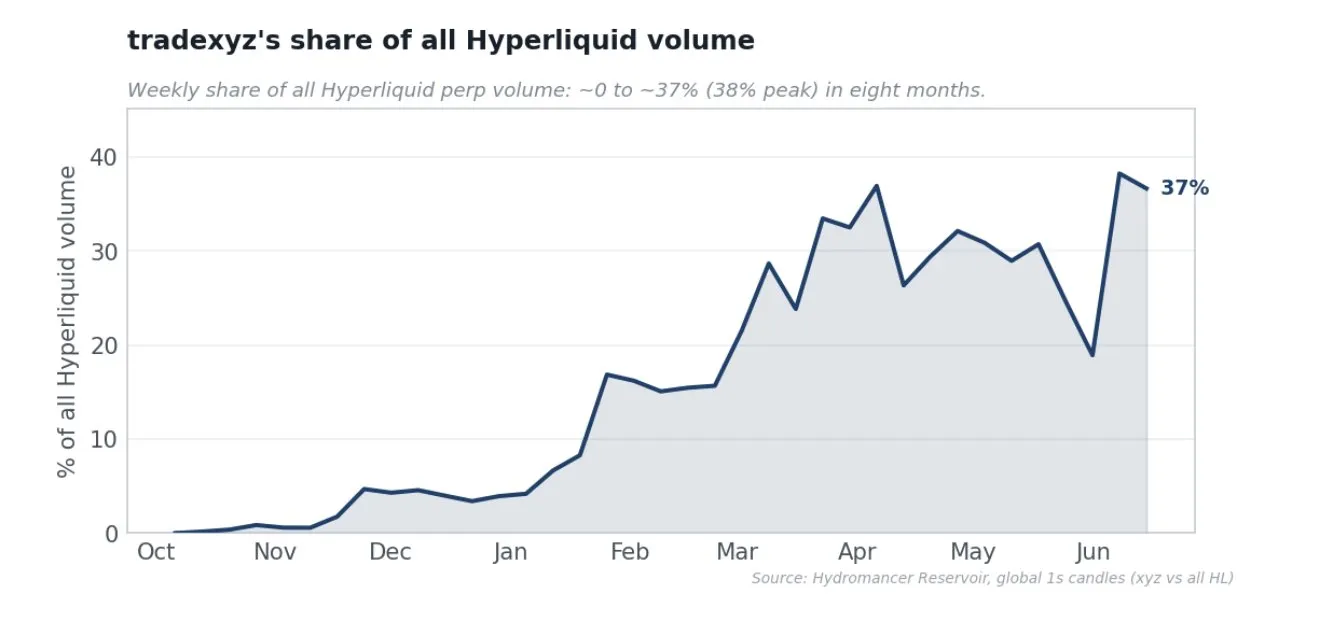
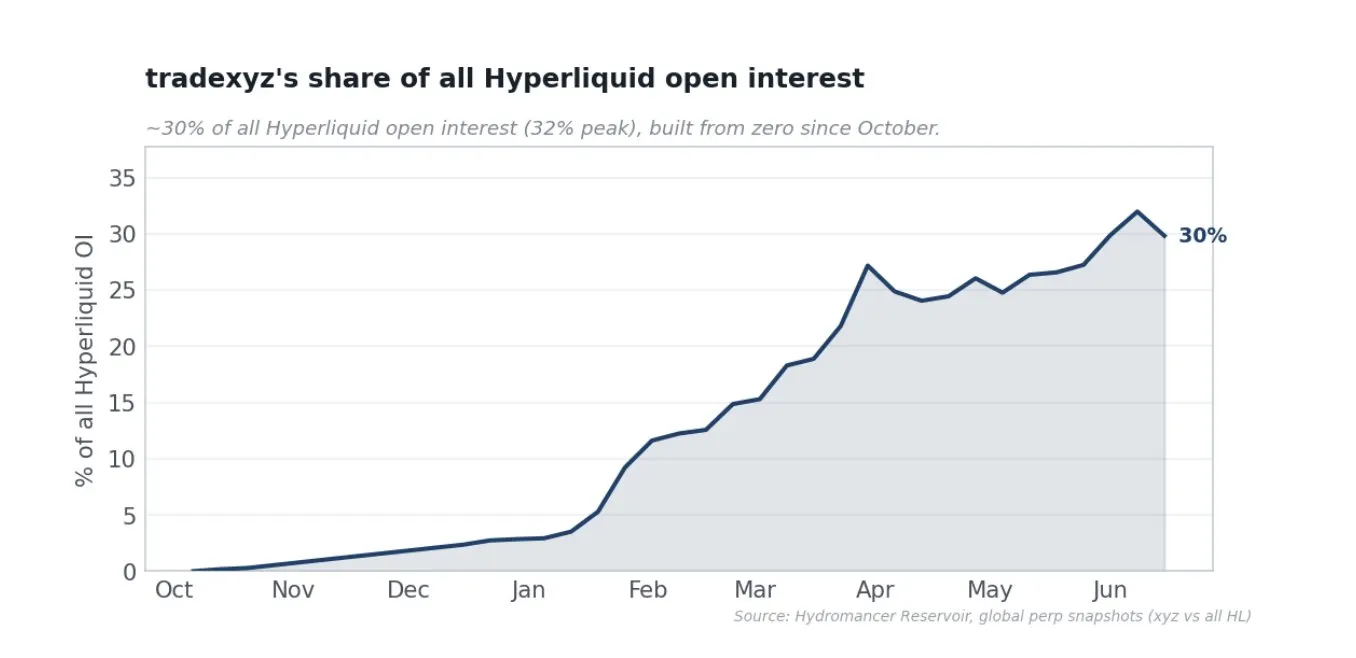
My view is that this greatly underestimates how hard it is to build an institutional-grade real-world asset market. The entire goal of this report is to present a data-supported, first-principles-based analysis: whether this current model is even slightly successful.
What It Really Takes to Build a Stock Perpetual Contract Market
"Just list the assets" is the most common misinterpretation of this business. Listing is the easy part; the difficulty and moat lie in enabling newly listed markets to trade large volumes. Trade[XYZ]'s data points to three clear challenges: 1. List fast enough to capture demand 2. Acquire market makers who create depth 3. Keep liquidity economically real and operate these markets daily
Listing Speed
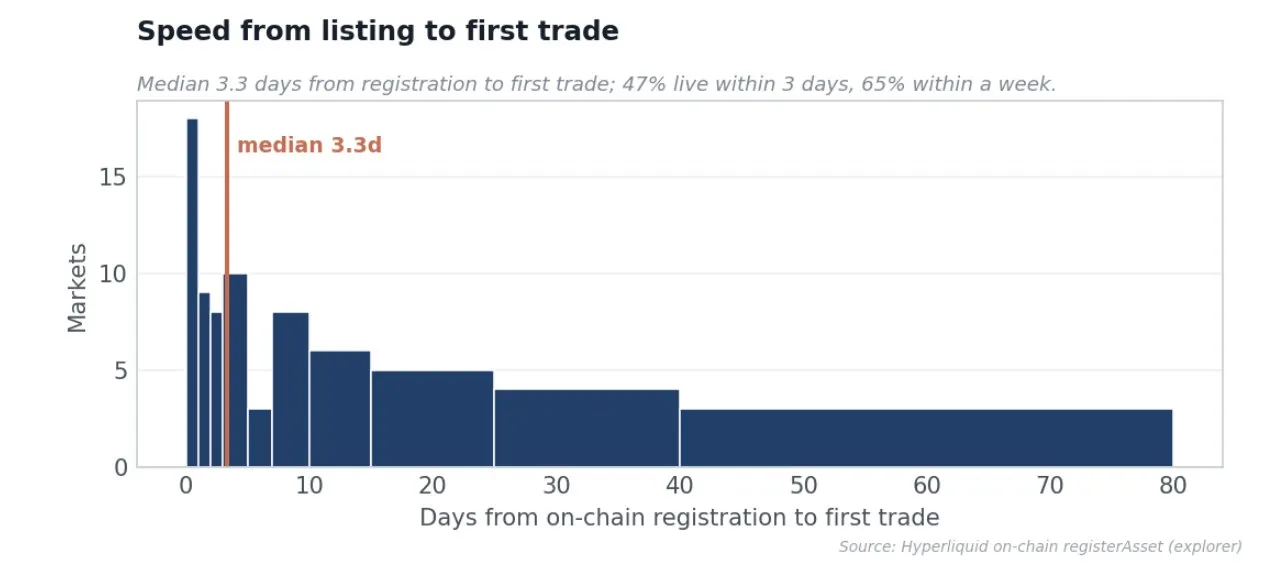
Perpetual contract markets are only valuable if they exist when traders think of them. Measuring precisely from on-chain registration of each asset to the first trade, Trade[XYZ]'s median listing time is only 3.3 days, 65% of markets list within a week, 47% within three days.
Tradable Markets Are the Real Moat
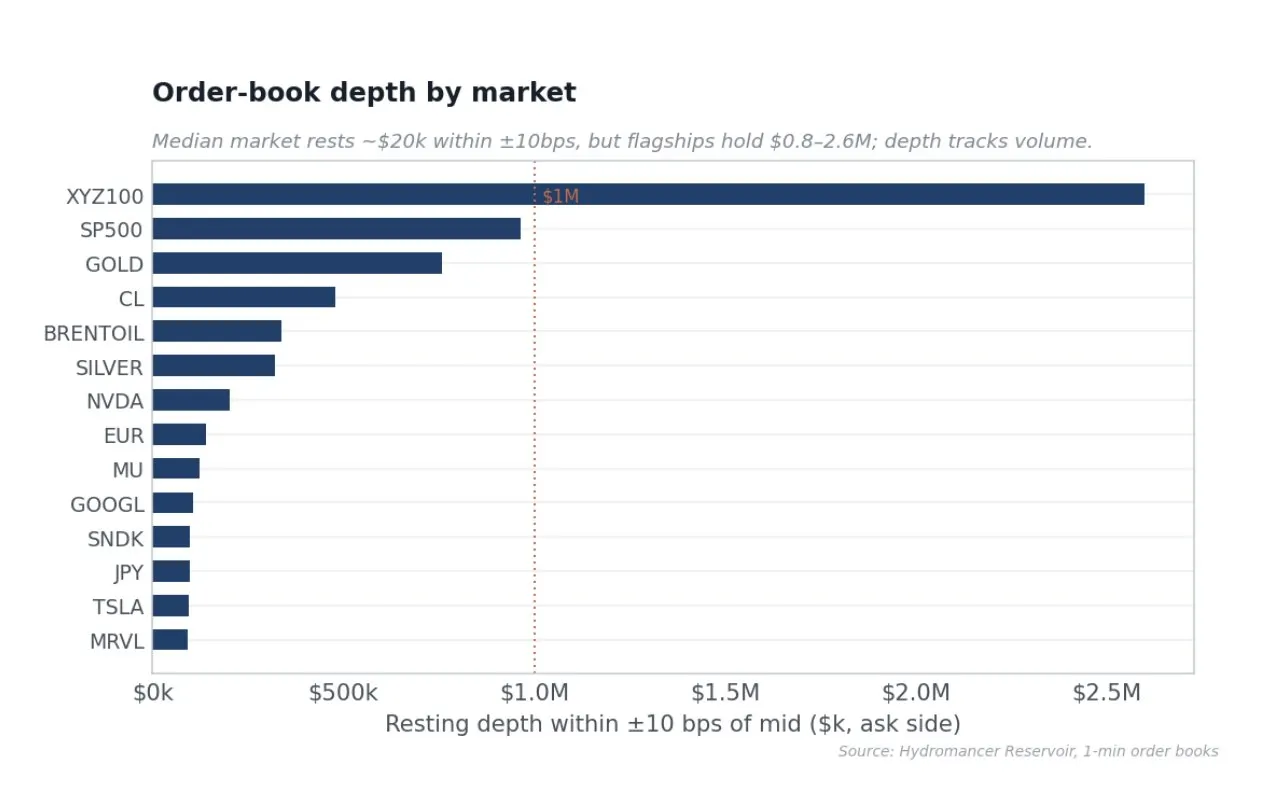
Trade[XYZ]'s depth is both deep and well-distributed. Flagship index and commodity markets have institutional-grade order book depth, XYZ100 has $2.6 million in orders within 10 basis points of the mid-price, S&P 500 market $964,000, Gold $759,000, and single stocks like NVIDIA and Tesla also have sufficient comfortable trading volume. In contrast, the median market has only about $20,000 in orders within 10 basis points. This is how rational market makers allocate capital.
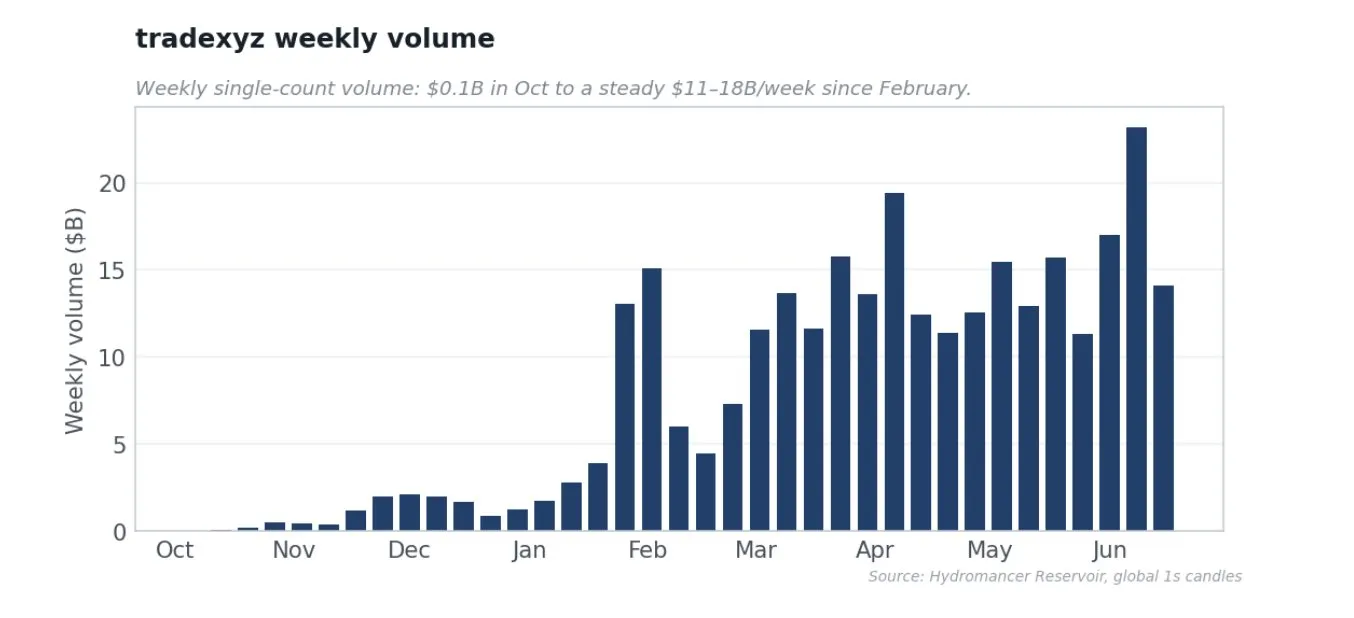
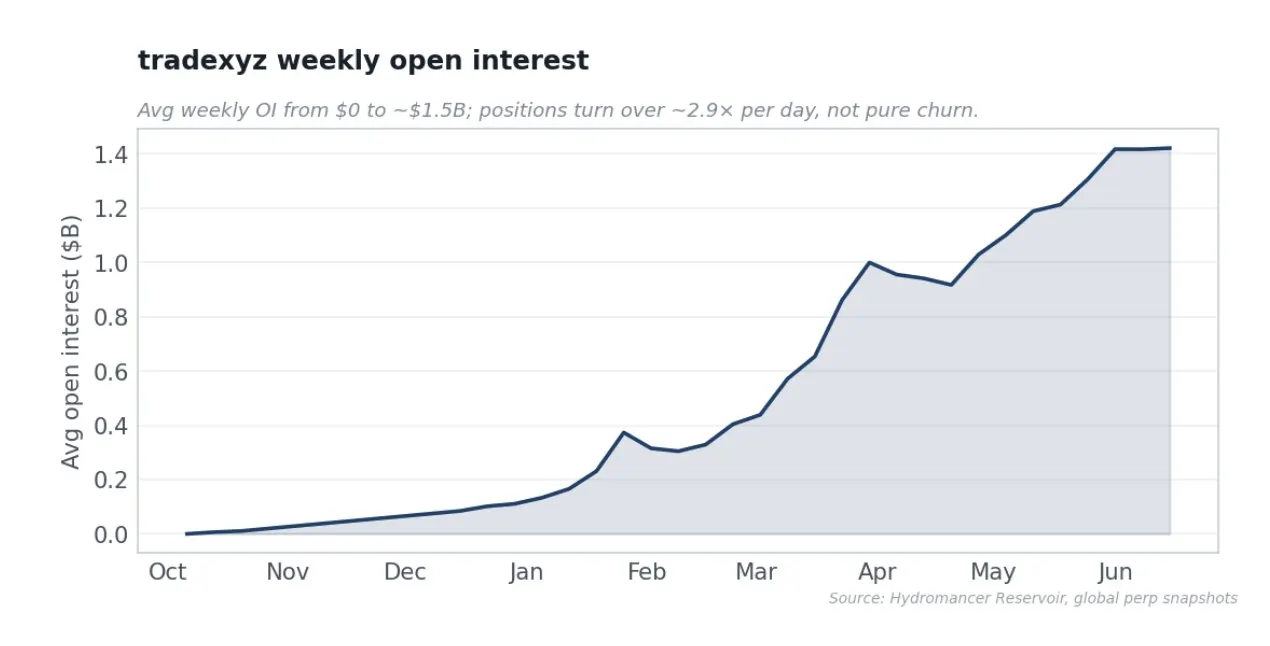
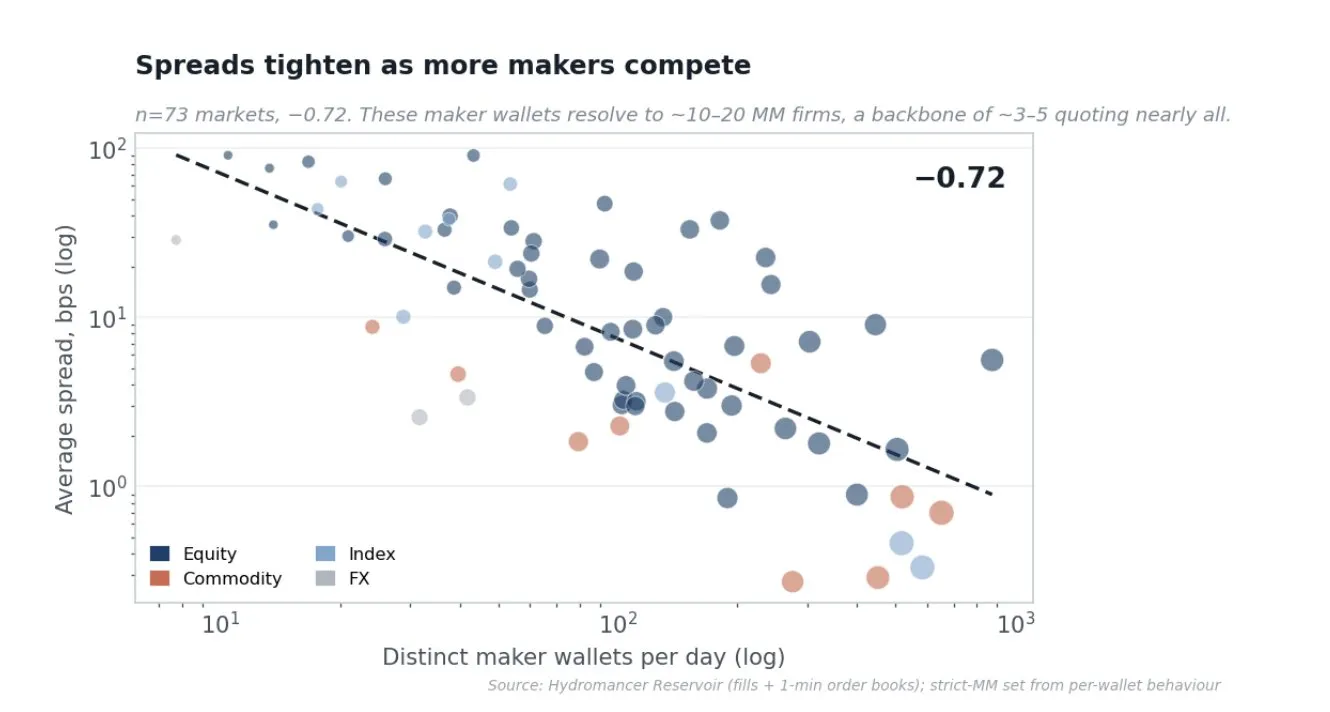
Acquiring market makers is the real skill, and the presence of market makers tightens the market. In the 73 markets with sufficient data, the correlation between the number of daily unique market maker wallets and spread is -0.72, trading volume and spread is -0.82, trading volume and open interest is +0.96. The volume-weighted average spread across the full order book is 2.33 basis points, daily turnover rate is about 2.9 times the open interest. Trade[XYZ]'s advantage lies in the BD work and capital work of acquiring market makers, and this work produces tight, deep markets.
It is worth asking from first principles why acquiring this liquidity is difficult, and why only one deployer has successfully scaled these markets. Market makers earn the spread, but can only survive by managing what remains on the book after each trade. Simply put, market makers need a way to hedge. The main risk is pure inventory risk: each trade turns the trading desk long or short, and an unhedged position is a big red flag. For stocks, the key is hedging. Crypto perpetual contracts can be hedged around the clock on another crypto exchange, but the only true hedge for stock perpetual contracts is the underlying stock, ETF, or futures, and they only trade when the spot market is open. During regular hours, the trading desk can hedge its TSLA perpetual contract inventory with TSLA stock, capturing the spread with almost no risk, so it can quote tight and deep prices. But once the market closes, it is holding naked inventory, and the rational reaction is to widen the spread, reduce depth, or stop quoting. There is no hedge before IPO, which is why those books are thin before listing. In addition, there is adverse selection (a larger share of after-hours flow is informed trading), funding rates and holding costs (funding rates must peg the perpetual contract to the index without making hedging uneconomical), and oracle or gap risk (perpetual contracts settle based on oracles, and stale, manipulable, or gapping marks are uncontrollable liquidation risks, preventing the book from market making at volume).
Discovery Bounds keep the mark price within plus or minus one times the maximum leverage of the reference price (about 5% for 20x leverage), re-anchoring in discrete, market-capped steps, becoming a hard cap until external pricing recovers, paired with liquidation protection, preventing positions from being liquidated when the liquidation price is outside the active bounds. Simply put, there is a "known upper limit" to how far the price can move in a single move, and the exchange will not liquidate the trading desk within this limit, so the worst-case scenario for unhedged overnight inventory is bounded and quantifiable, rather than open-ended. Finally, the per-market funding rate multiplier scales the standard funding rate by 0.5 (about 5.5% annualized baseline), but pre-IPO varieties drop to 0.005. Funding rates peg the perpetual contract to fair value without squeezing market makers dry; for pre-IPO varieties with no stock to arbitrage, it is almost completely turned off, so holding the position itself is not unprofitable. Together these are a toolkit for making markets that, by first principles, cannot be market made once hedging disappears.
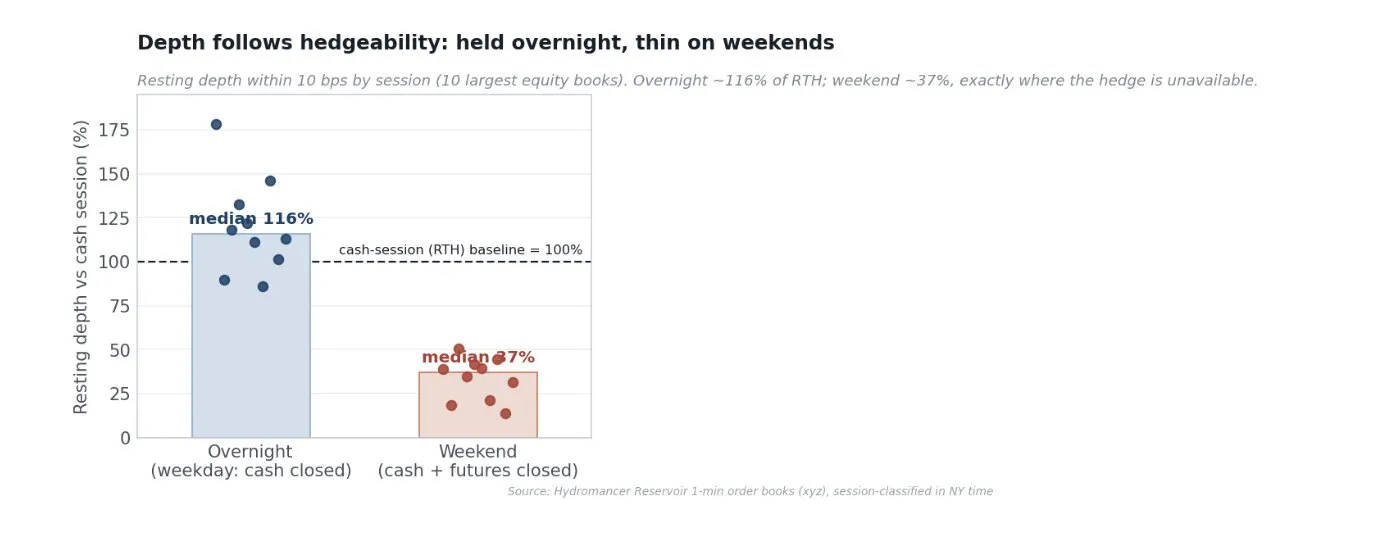
Measuring the order book depth of the top ten stock books across sessions, overnight depth maintains about 116% of the spot session level, and single stocks like NVIDIA and Tesla actually deepen, because after the spot market closes, perpetual contracts are the only active price, and quotes concentrate there. On weekends, even when index futures are closed and hedging disappears for a full two days, depth shrinks to about 37%. It should be honestly stated as a boundary: this makes Trade[XYZ]'s after-hours book resilient, but not magically superior. The lasting differentiating factors remain its daytime depth, order flow, and breadth of markets that are truly hard to market make. What the data supports is that Trade[XYZ]'s risk mechanism allows market makers to retain depth overnight, where first principles predict collapse, which is itself non-trivial engineering to make these markets marketable.
Trade[XYZ] Is Not a One-Time Listing Business
Trade[XYZ] does not leave after listing. In the recent approximately 300 on-chain operation windows, it executed 294 different risk management operations. 54 position limit changes, 35 growth mode switches, 34 funding rate multiplier adjustments, 28 trading halts, and 11 margin mode changes, plus asset labeling. This is continuous, per-market risk management across 92 underlying assets, handling real trading sessions, halts, and funding rates, it is a full-time market operation business.
It is best to understand the difficulty through comparison. Tokenized spot stocks on Solana (xStocks) represent over $25 billion in total trading volume, but actual DEX trading volume is only about $517 million. Ostium is a specialized, funded RWA perpetual contract DEX, with cumulative trading volume of about $59 billion, but open interest is only about $115 million, which is 1/24 of Trade[XYZ]. Newer entrants like Variational do not even attempt to build native depth, but aggregate liquidity via RFQ from Hyperliquid, Lighter, and centralized exchanges, routing to Hyperliquid to get the liquidity being discussed. The leader in the on-chain stock perpetual contract category, leading by a large margin, is Trade[XYZ] on Hyperliquid.
Trade[XYZ] Markets Expand Hyperliquid User Base, Hyperliquid Benefits from Its Network Effects
The natural assumption is that deployers own users through their own frontends. The truth is quite the opposite. Tagging each trade with its frontend (builder) code, measured on the taker side, i.e., the party choosing the frontend, shows about 97% of Trade[XYZ] market trading volume trades through Hyperliquid's own app and API, all third-party frontends combined account for about 3%, and Trade[XYZ]'s own frontend is just a small slice of that. In other words, almost every trade on Trade[XYZ] products happens on Hyperliquid's interface.
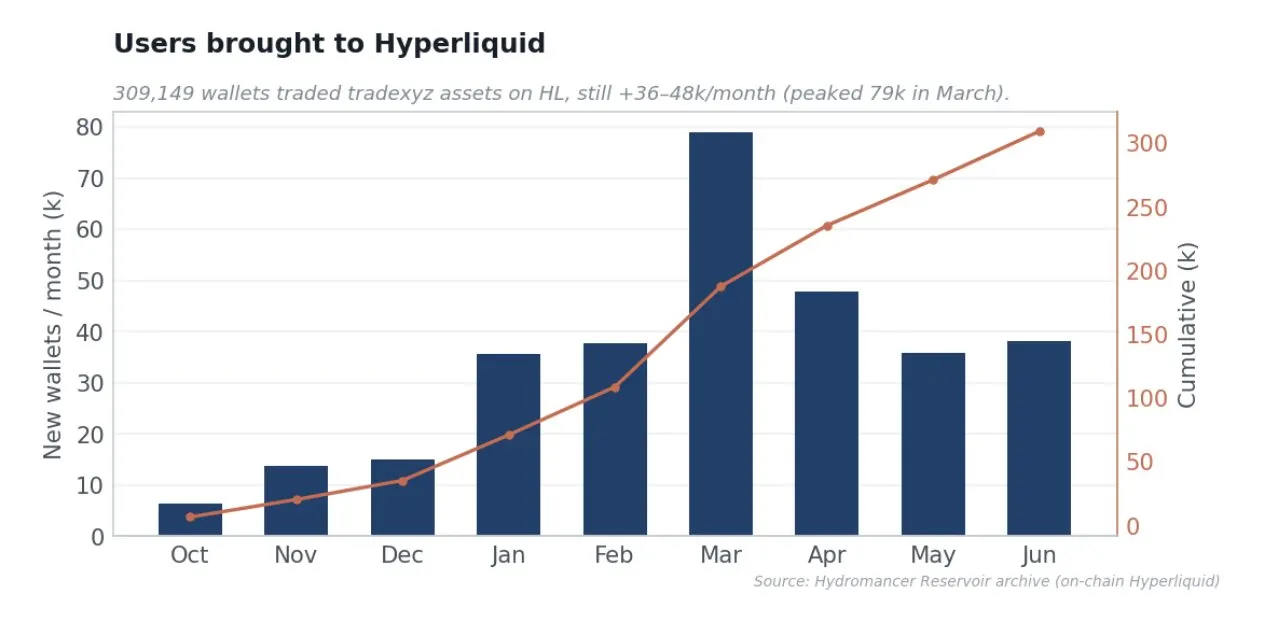
This represents substantial and sustained user acquisition. Trade[XYZ] has cumulatively brought about 300,000+ different wallets to Hyperliquid, now still increasing by 36,000 to 48,000 monthly, peaking close to 79,000 in March during listing and SpaceX surge. Stocks and RWA perpetual contracts serve as top-of-funnel user acquisition channels: assets are the bait, Hyperliquid is the place where users land, trade, and stay from this. This is real attention and user acquisition value, never appearing in the fee table.
Incentives at the Protocol Level Are Correctly Aligned
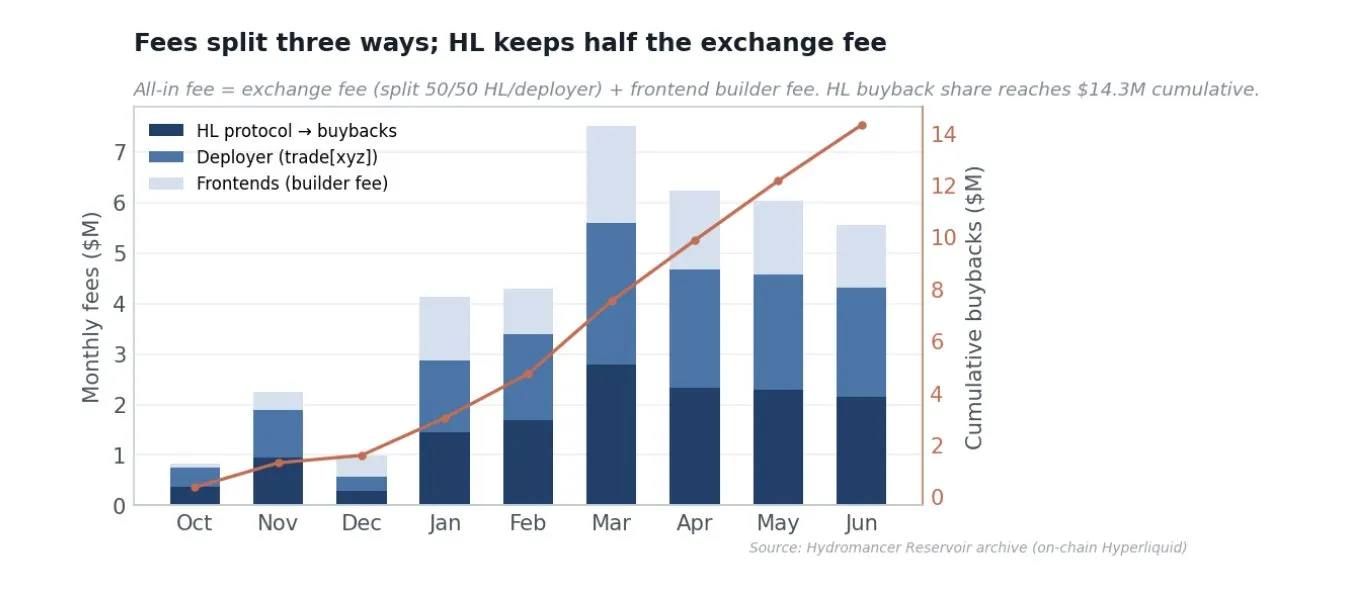
HIP-3 trader total fees are about $37.9 million, split into three parts. About $9.2 million in builder code fees go to third-party frontends, not the deployer's; the remaining exchange fees are split 50/50 between Hyperliquid and the deployer. So Hyperliquid's protocol share, directed to HYPE buybacks, is about $14.3 million, the deployer's share is about $14.3 million accrued. HIP-3 sets a cap on the deployer share, Hyperliquid's protocol fees match any deployer share exceeding 100%, so the deployer never gets more than half. Cheap, deep markets attract the volume itself that generates fees.
My View on the Growth Mode
HIP-3 deployers choose a fee mode for each market: standard mode charges 9 basis points to takers, 3 basis points to makers, while growth mode charges 0.9 basis points and 0.3 basis points, a drop of about 90%. Growth mode is limited to non-crypto real-world assets, explicitly excluding crypto wrappers, such as MSTR, notably also excluding GOLD, because it overlaps with the existing PAXG-USDC market. This exclusion provides us with a clear natural experiment.
Today, order book fees fitting the growth mode are close to 0.86 basis points, while excluded varieties fees are close to 7 basis points, an 8x gap on the same matching engine. RWA perpetual contracts compete with the comprehensive costs of traditional finance. A 9 basis point fee cannot compete with CME index futures or spot stock commissions, while 0.9 basis points is competitive, and can be traded with leverage around the clock. Cheap, deep markets are the way to win market share, depth and market maker base are formed from this. In a category inclined towards a single winner, maximizing trading volume, open interest, user count, and reference price status is valuable.
However, the growth mode is not the reason trading volume exists, three data points prove this. First is the on-chain control: six of the other seven HIP-3 deployers have the same fee tools, but trading volume is basically zero, the second-ranked deployer (dreamcash) even quotes narrower spreads, but scale is still about 30 times smaller; if low fees could bring trading volume, dreamcash should be close. Second is the GOLD experiment: GOLD pays fees about 8 times that of the growth order book, but it is the single largest fee market, ranking top three by trading volume and open interest. Traders are willing to pay full fees for GOLD because the liquidity is there.
This is why closing it will not kill trading volume; it will direct more value to HYPE. Because exchange fees are split 50/50 in both modes, increasing fees will increase HYPE's value by about 9 to 15 times (growth mode about 0.9 basis points to standard mode about 9-12 basis points), so even if trading volume shrinks significantly, Hyperliquid's buyback share will rise, unless trading volume collapses by more than 85%.
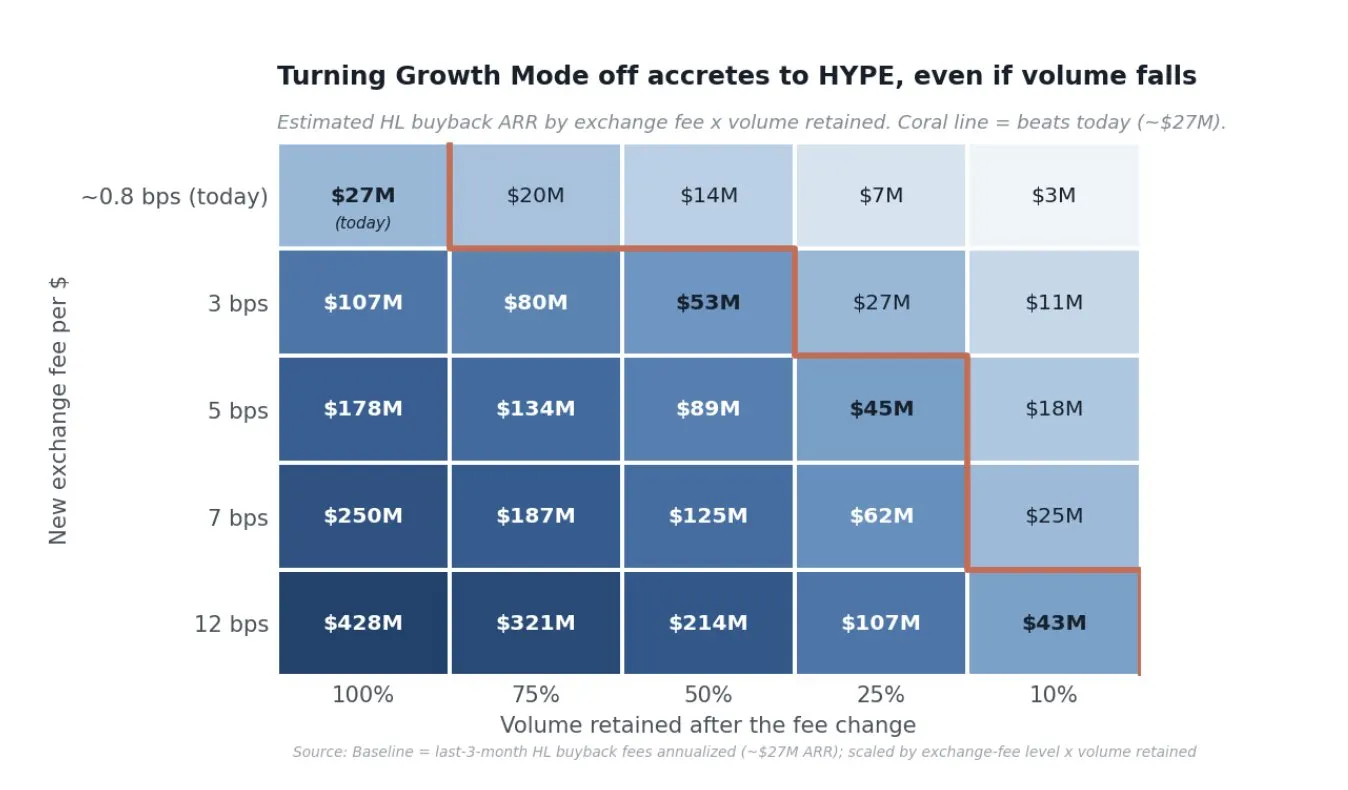
At the 7 basis points observed in GOLD, Trade[XYZ] only needs about 11% of today's trading volume to match today's buyback volume (about 15% at 5 basis points, about 25% at 3 basis points). A realistic monetization plan is to adjust mature markets to 5 to 7 basis points, while given the moat retains half to three-quarters of trading volume, this will deliver about $90 million to $185 million annually to buybacks, 3-5 times current levels. This is not hypothetical: GOLD is already running at standard rates, converting 4.3% of trading volume into 23% of all buybacks. The scenario of closing the growth mode is observed in real-time on a single market, and proves deep real-world asset markets remain trading at standard rates, so a collapse of more than 85% is unlikely. These two phases are a strategy, now expanding the moat at low cost, monetizing later, both directing value to HYPE: first users, trading volume, open interest, and reference price status, then fees.
Market Dynamics
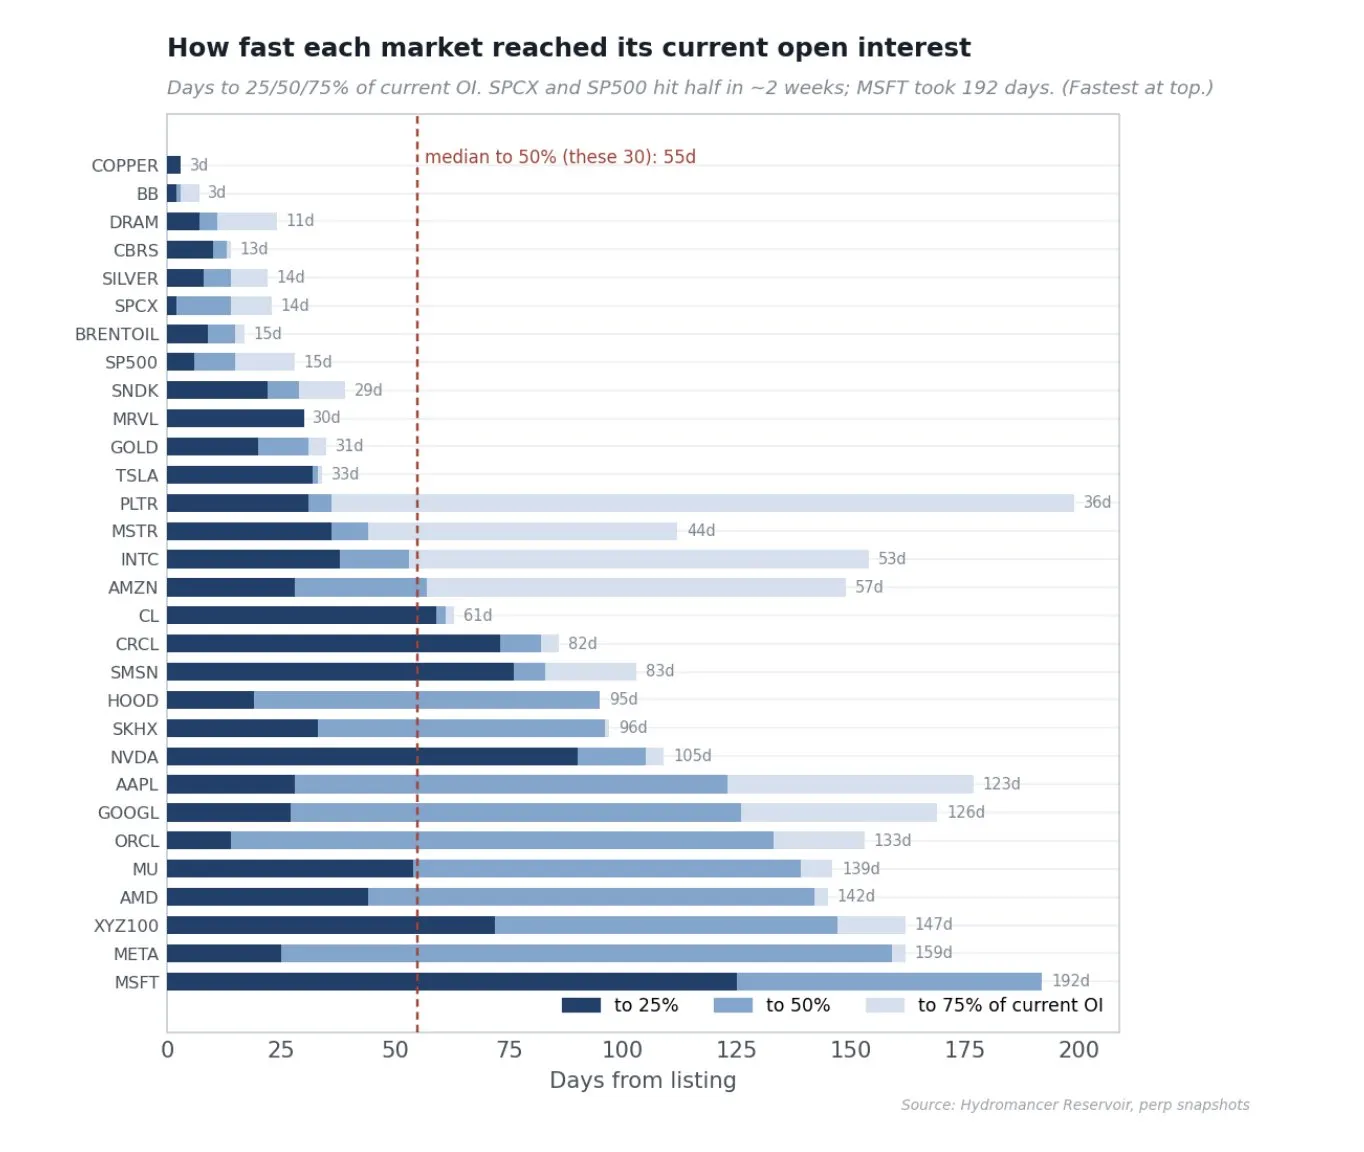
The top 30 markets hold about 95% of open interest, led by S&P 500, XYZ100 index, Brent Crude, and WTI. More interesting than the level is the speed at which each market reaches that level. Measuring the days for each market from listing to reaching 25%, 50%, and 75% of current open interest, the median market reaches one-quarter of its final size in 9 days, half in 15 days, three-quarters in 30 days, but the gap is huge and revealing. The fastest markets reach half of current open interest in about two weeks (SpaceX 14 days, S&P 500 and Silver about 15 days), while the earliest single stocks listed when the venue's liquidity infrastructure was still in its infancy, taking five to six months (Microsoft 192 days, Meta 159 days). This gap is a concrete manifestation of the deployer's learning curve: recently listed markets grow much faster than early batches, because market maker relationships and tools now exist on day one.
Proof of Market Quality
A. Market Maker Concentration Changes Over Time Across Markets
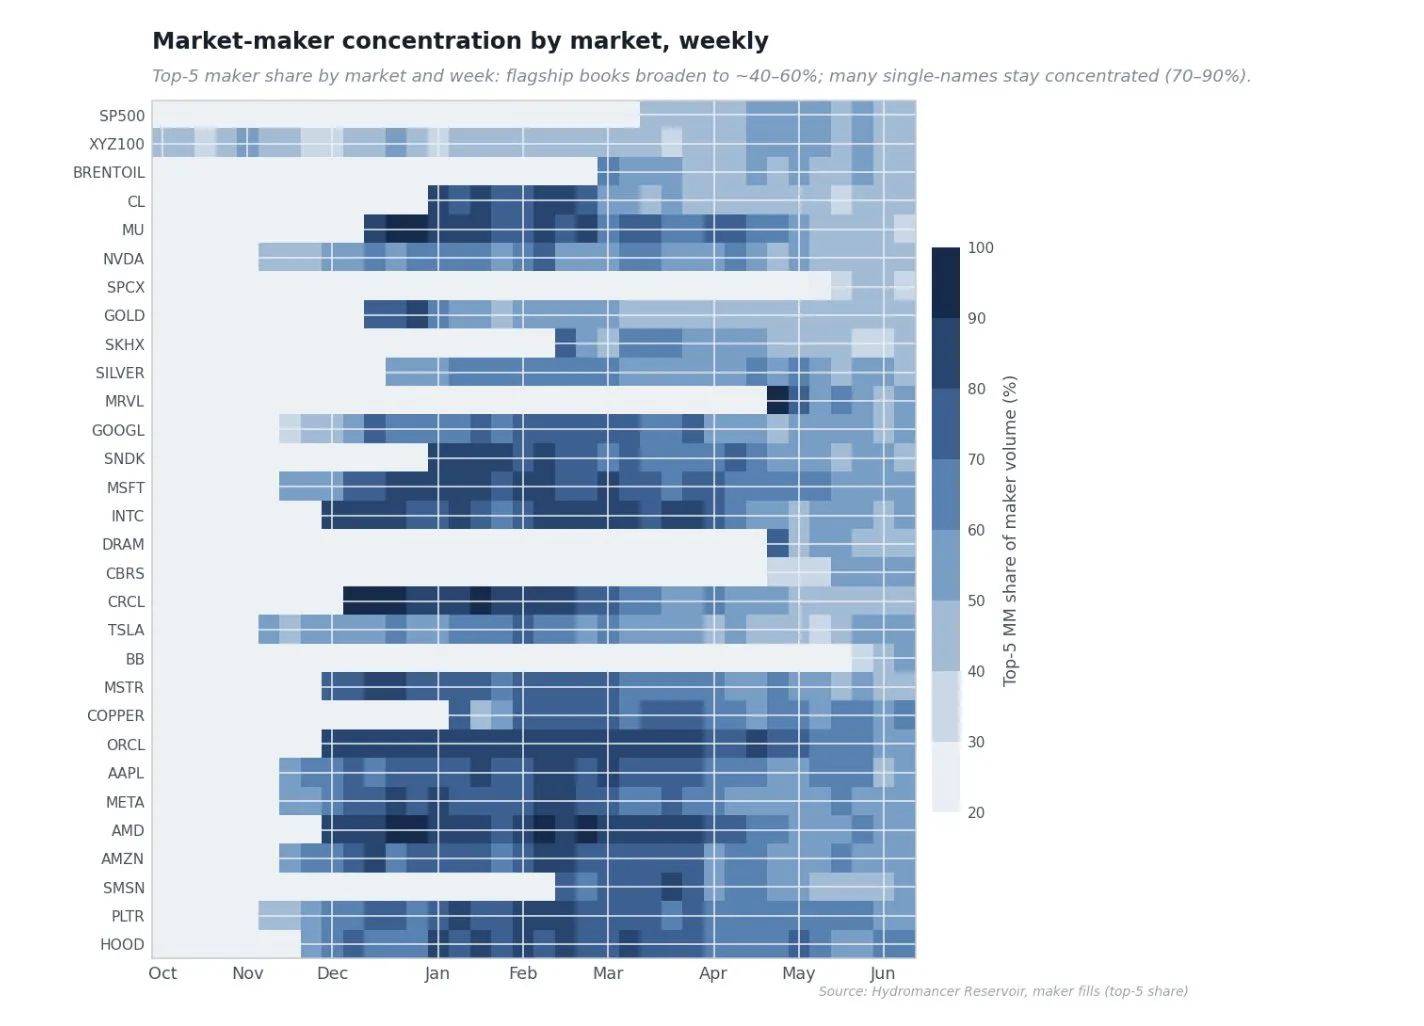
As Trade[XYZ] matures, liquidity provision has expanded. The heatmap below shows, for each market and week, the share of order book volume occupied by its top five market makers. Early markets are dark blue, in the first few months, a few market makers provide almost all passive liquidity (top five share over 90%). Over time, the largest, most liquid markets lighten in color, as more market makers compete to quote, while many single stocks remain concentrated. A more concentrated order book itself is not bad, this is how markets are bootstrapped, but flagship markets becoming competitively contested is a healthy sign, indicating liquidity provision on Trade[XYZ] is now a competitive business at the top of the book, not the favor of one or two market makers.
B. Market Maker Main Force
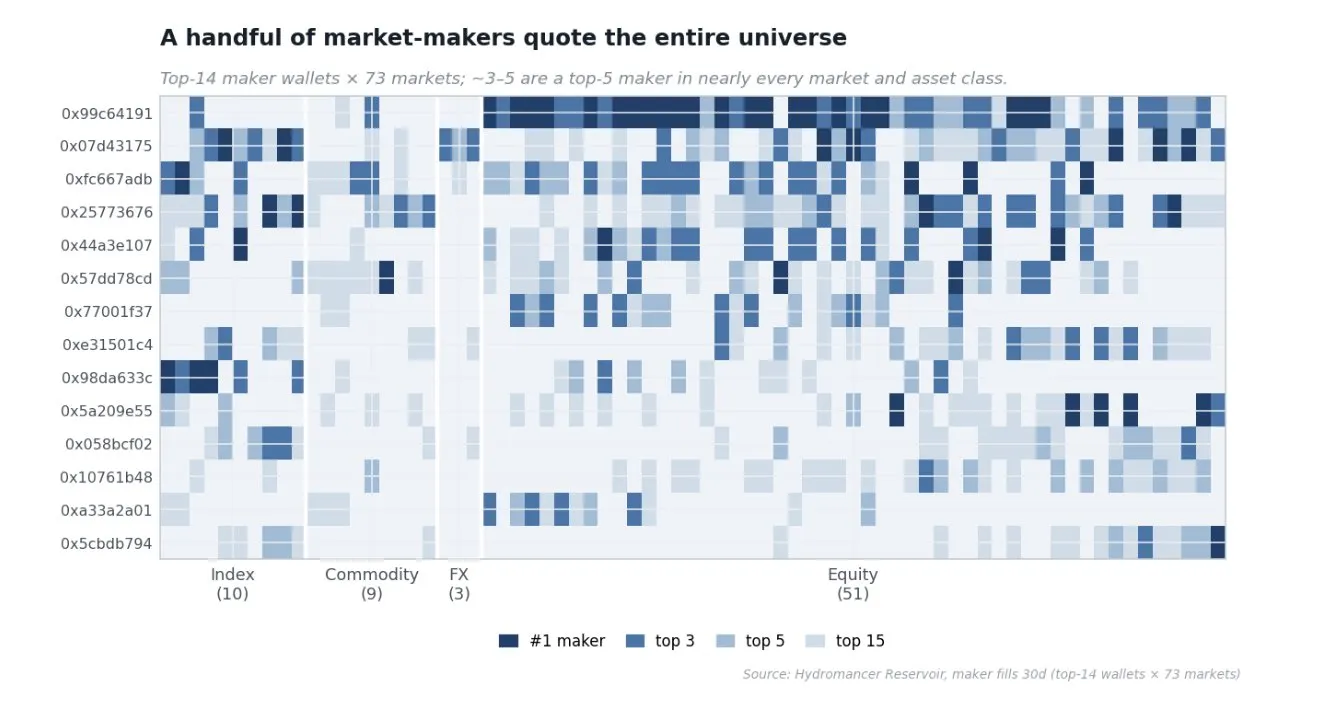
A natural question is, do a few companies quote the entire market, or does each market attract its own experts. Ranking the top makers within 30 days for each market, and asking which wallets repeatedly appear at the top of various markets, reveals a clear main force. The single largest main force wallet is a top five maker in 47 of 73 markets, ranking first in 22 markets; the top three main force wallets combined are top three makers in 57 of 73 markets. Several of these wallets quote all four asset classes simultaneously: stocks, commodities, forex, and indices, all wallets carry textbook market maker characteristics: directionality within one percent, realized PnL within rounding error of zero.
Fee Sources
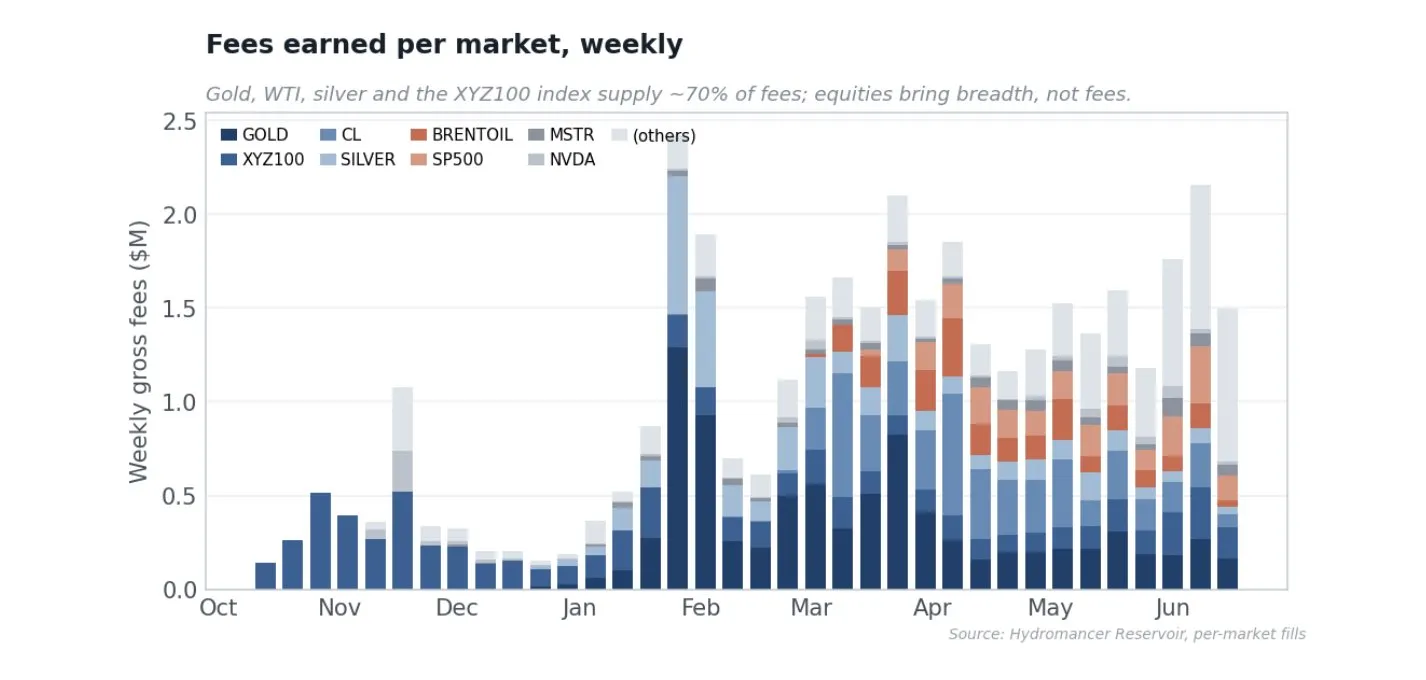
The fee base is driven by commodities and indices. Commodities alone account for 54% of all earned fees, indices 24%, the entire long tail of single stocks and forex 22%, although stocks are the majority of listings. Gold is the single largest contributor, accounting for 23% of fees ($8.7 million), followed by XYZ100 index (18%), WTI Crude (13%), and Silver (10%); the top ten markets generate 84% of all fees.
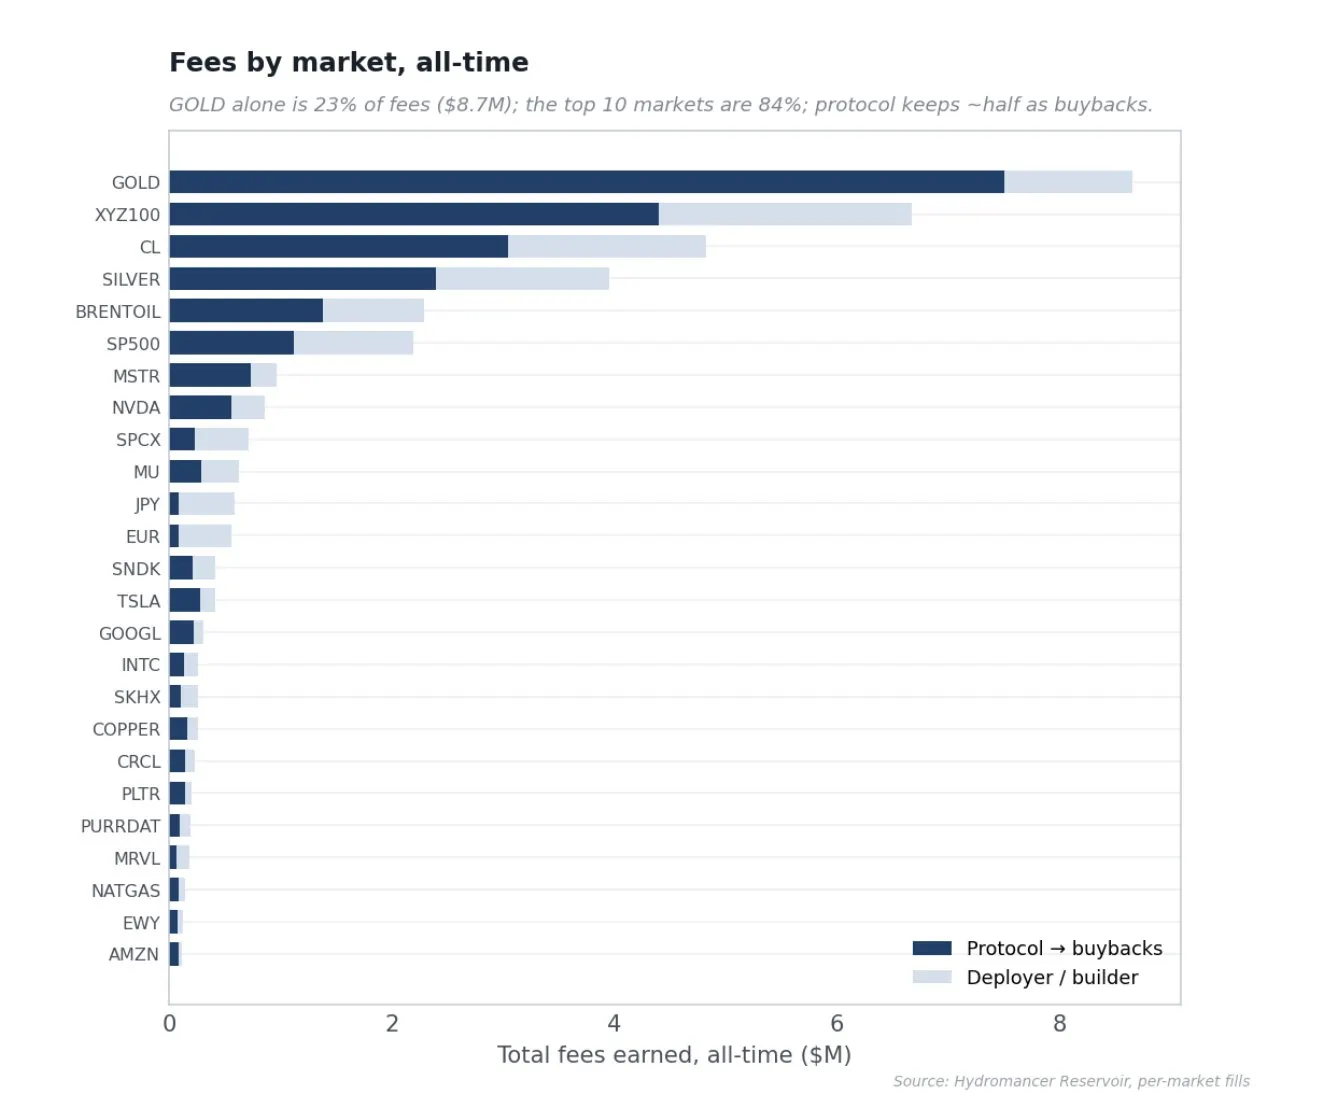
A nuance forced by GOLD is that fee ranking is not trading volume ranking, because fee modes vary by market, which brings us back to the growth mode. GOLD is the only large market excluded from the growth mode, so it pays about 7 basis points, while the rest of the order book pays about 1 basis point, this alone makes it the number one fee market: it accounts for only 4.3% of trading volume, but 23% of all fees. By trading activity, GOLD is a secondary market; by buyback fuel, it is huge.
Could the Core Team Do This Themselves?
My assessment is they cannot, and more importantly, they should not. The strongest reason is regulation. Listing perpetual contracts for NVIDIA, TSLA, and pre-IPO SpaceX falls squarely within the realm of security derivatives, HIP-3 intentionally externalizes this responsibility to deployers. If the core team listed stocks themselves, it would put the protocol, foundation, and HYPE directly in the sights of regulators. Keeping listing at arm's length is not a missed opportunity; this is by design.
The remaining reasons exacerbate this. Hyperliquid's value lies in becoming trusted neutral infrastructure, core team picking assets would undermine the permissionless argument and the deployer auction fee market HIP-3 aims to monetize. Operating 92 stock, forex, and commodity markets, sourcing oracles, handling market hours and halts, cultivating market makers and executing hundreds of risk operations visible on-chain, is a complete operational business orthogonal to building a high-performance exchange, securing top-tier market makers for niche RWA perpetual contracts is relationship and capital work, not protocol engineering, and it is precisely in this aspect that even funded experts progress slowly. The empirical record settles this: if this were easy or could be done internally, one would expect the core team to have already done it, or there to be many powerful deployers. Instead, the second largest deployer is 46 times smaller, focused independent RWA venues are 24 to 33 times shallower, new entrants route liquidity back to Hyperliquid. Scarcity is proof of difficulty.
I want to end this article with an analogy that affected me the most. What Tether did for getting USD globally, is being done for getting global stocks globally. All data in the article is provided by the elites at @hydromancerxyz.
Join TechFlow official community to stay tuned
Telegram:https://t.me/TechFlowDaily
X (Twitter):https://x.com/TechFlowPost
X (Twitter) EN:https://x.com/BlockFlow_News