Gold Bottom-Fishing Guide: Focus on Interest Rates, Not Just Wars
TechFlow Selected TechFlow Selected
Gold Bottom-Fishing Guide: Focus on Interest Rates, Not Just Wars
Plunged into a bear market in 90 days—why has this war反而 become a reason to sell gold?
Author: David, TechFlow Research
Those who rushed to buy gold four months ago likely never imagined they’d be sitting atop a peak that even war couldn’t rescue.
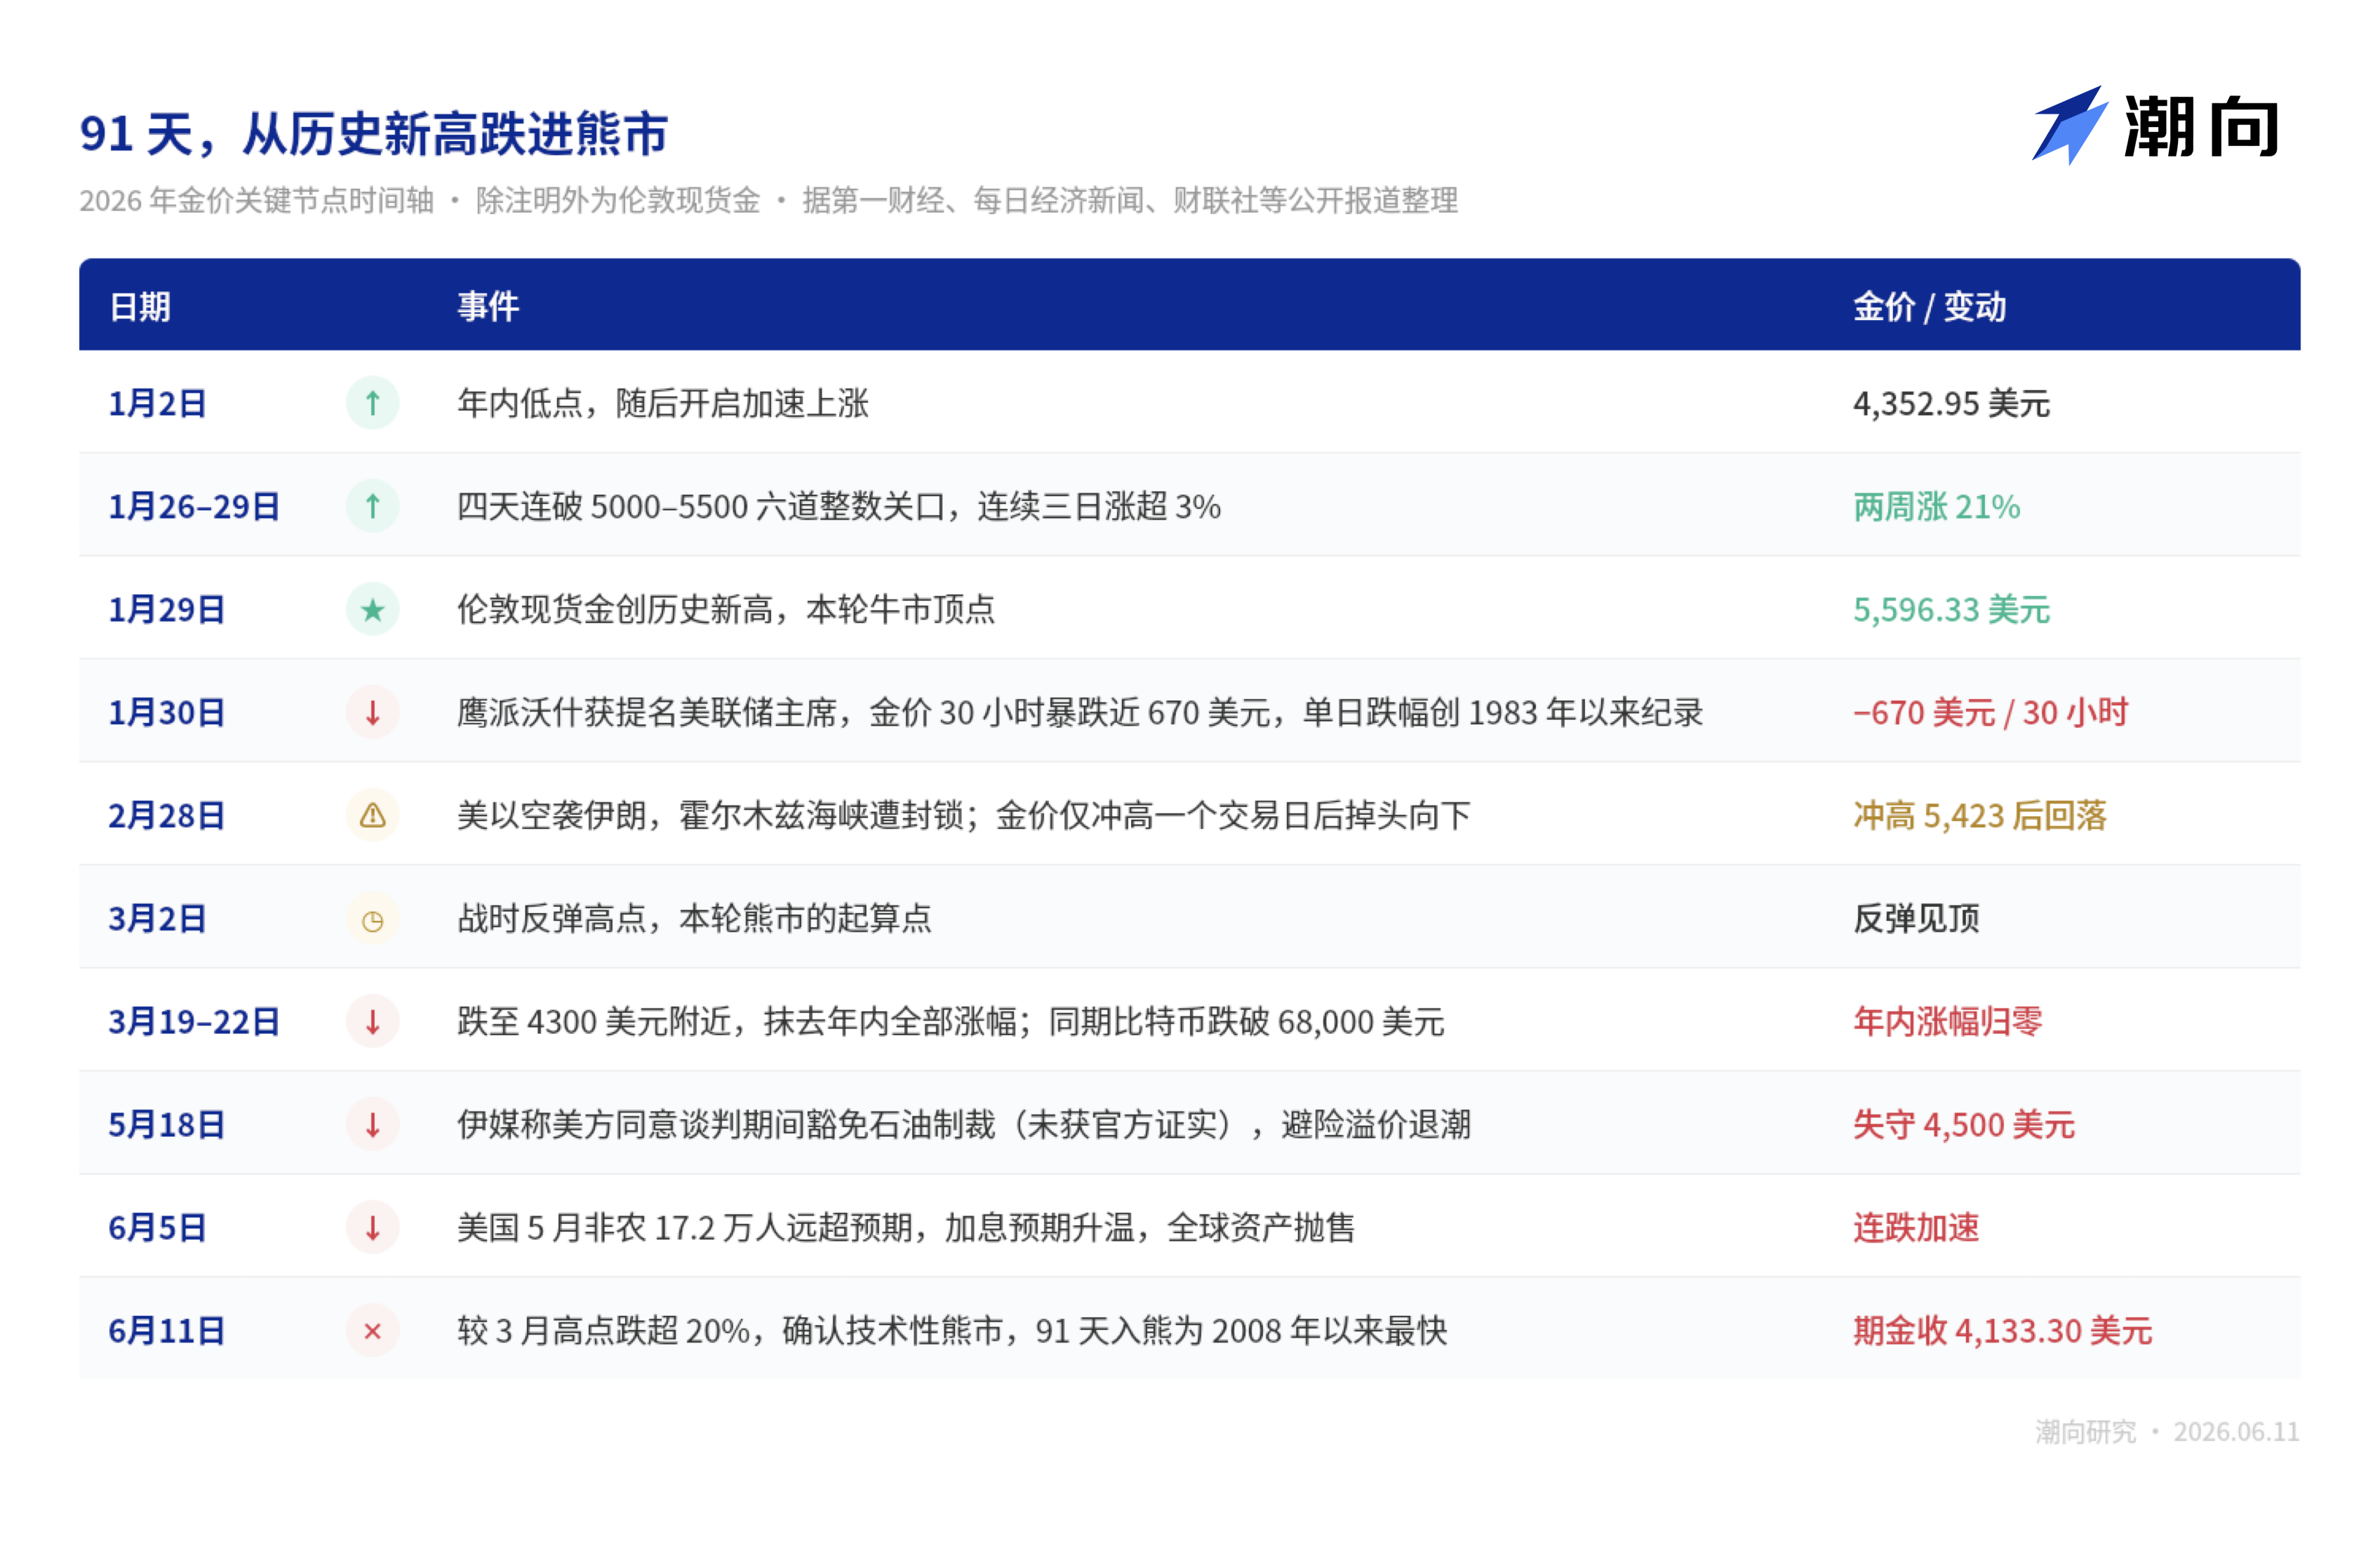
In the final week of January this year, gold was at the most frenzied stage of this bull run. From January 26 to 29, spot gold surged past six round-number thresholds—$5,000 to $5,500—in just four days, with three consecutive trading days posting gains exceeding 3%. Such a pattern is extremely rare in gold’s trading history.
On January 29, London spot gold reached $5,596.33—the all-time high.
The top appeared the next day. On January 30, Trump nominated Kevin Warsh—a hawkish figure—to serve as the next Federal Reserve Chair. Within 30 hours, gold plummeted nearly $670; its single-day drop set a record since 1983. Silver plunged as much as 36% intraday.
Note the timing: this occurred a full month before the U.S.-Iran conflict erupted.
The first force pushing gold off its peak was monetary policy—and this dynamic has repeated itself over the past four months. The subsequent storyline is familiar: war, sanctions, rebound, then gradual decline… By June 11, NYMEX August gold futures closed at $4,133.30—down more than 20% from the March high—officially confirming a technical bear market. Just 91 days after the peak, this marks the fastest entry into bear territory since 2008.
These days, opening any market sentiment group chat reveals near-identical questions from retail investors: “With the war escalating so sharply, why isn’t gold rising—but falling instead?”
The author believes this question is framed backward. What truly merits asking is: Why did markets still rush to buy gold on Day One of the war—following the old script—yet, 100 days later, treat that same war as a reason to sell?
War Is Merely a Messenger in Gold’s Love-Hate Affair With Interest Rates
“Buy gold in turbulent times”—this script was indeed followed initially.
On February 28—the day the U.S. and Israel launched airstrikes against Iran—spot gold surged from $5,296 to $5,423. Yet this rally lasted only one trading day. With no swift victory and the conflict stalling into a stalemate, gold’s pricing mechanism shifted.
The new chain, per the author’s view, runs like this:
Hormuz Strait blockades pushed oil and gas prices higher → energy price hikes lifted inflation expectations → inflation forced central banks to tighten again → and because gold yields no income, the higher interest rates go, the greater the opportunity cost of holding it.
Naeem Aslam, Chief Investment Officer at London-based independent financial research and investment advisory firm Zaye Capital Markets, argues that geopolitical tensions supporting oil prices imply persistently high inflation, making Fed rate cuts unlikely—and keeping investor preference firmly on U.S. Treasuries.
Does this analysis hold water? Consider the following data points.
First, the CME FedWatch Tool shows a 98.2% probability that the FOMC will hold rates steady next week; traders now price in a rate hike as the next move—in December.
Second, prior to the outbreak of hostilities, markets expected the Fed to pivot dovish later this year. The European Central Bank moved faster: according to Refinitiv data, a 25-basis-point rate hike on Thursday has become the market consensus.
Before the war, everyone waited for rate cuts; afterward, they began pricing in hikes. Over these four months, the very foundation of gold bulls has been entirely removed.
The clearest counterexample came in May. On May 18, Iranian media reported that the U.S. had agreed to temporarily lift oil sanctions during negotiations—crude prices immediately fell. Under conventional safe-haven logic, rising peace prospects should have triggered at most a minor dip in gold.
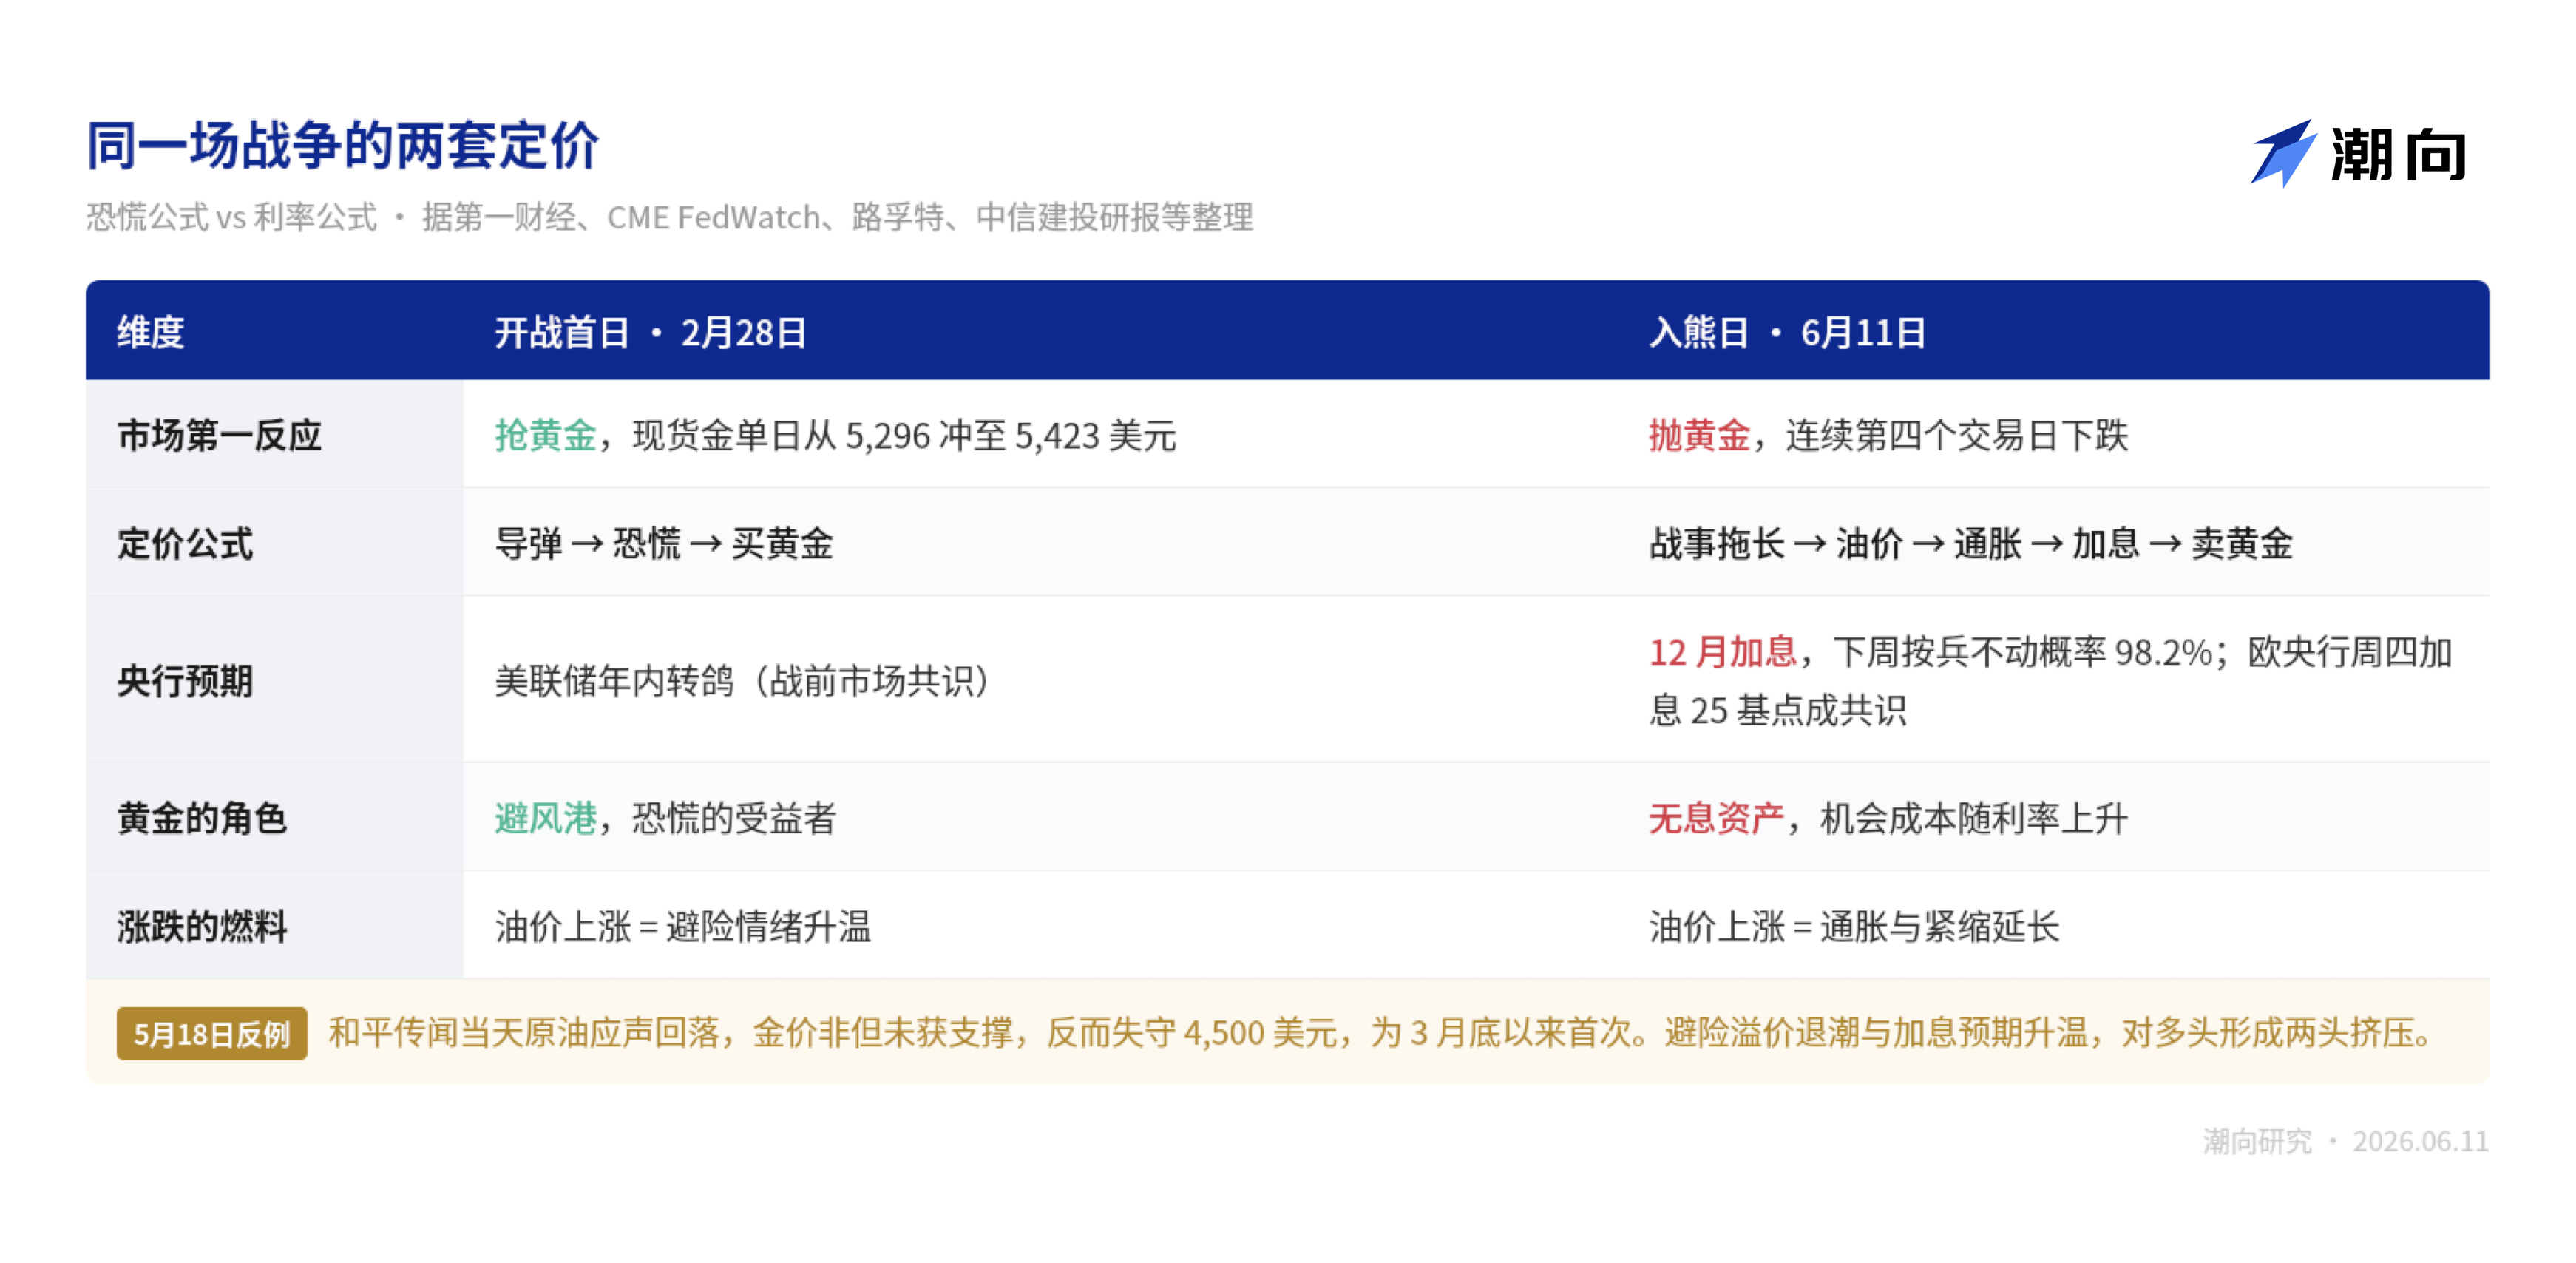
In reality, gold breached $4,500 outright that day—the first time since late March.
Peace brought a drop—as risk premiums receded; war also brought a drop—as rate-hike expectations intensified. Bulls were squeezed from both sides. That’s the true nature of this gold bear market.
China Securities Co., Ltd. issued an even sharper assessment in its research report:
The essence of gold’s sharp rally in 2025 was liquidity pricing. Once the U.S.-Iran standoff rekindled inflation expectations, liquidity-driven pricing faded—and gold must revert to its fundamentals.
In other words: last year’s buyers profited from monetary easing; this year’s sellers are losing money from tightening. Missiles fired in wartime served only as messengers—nothing more.
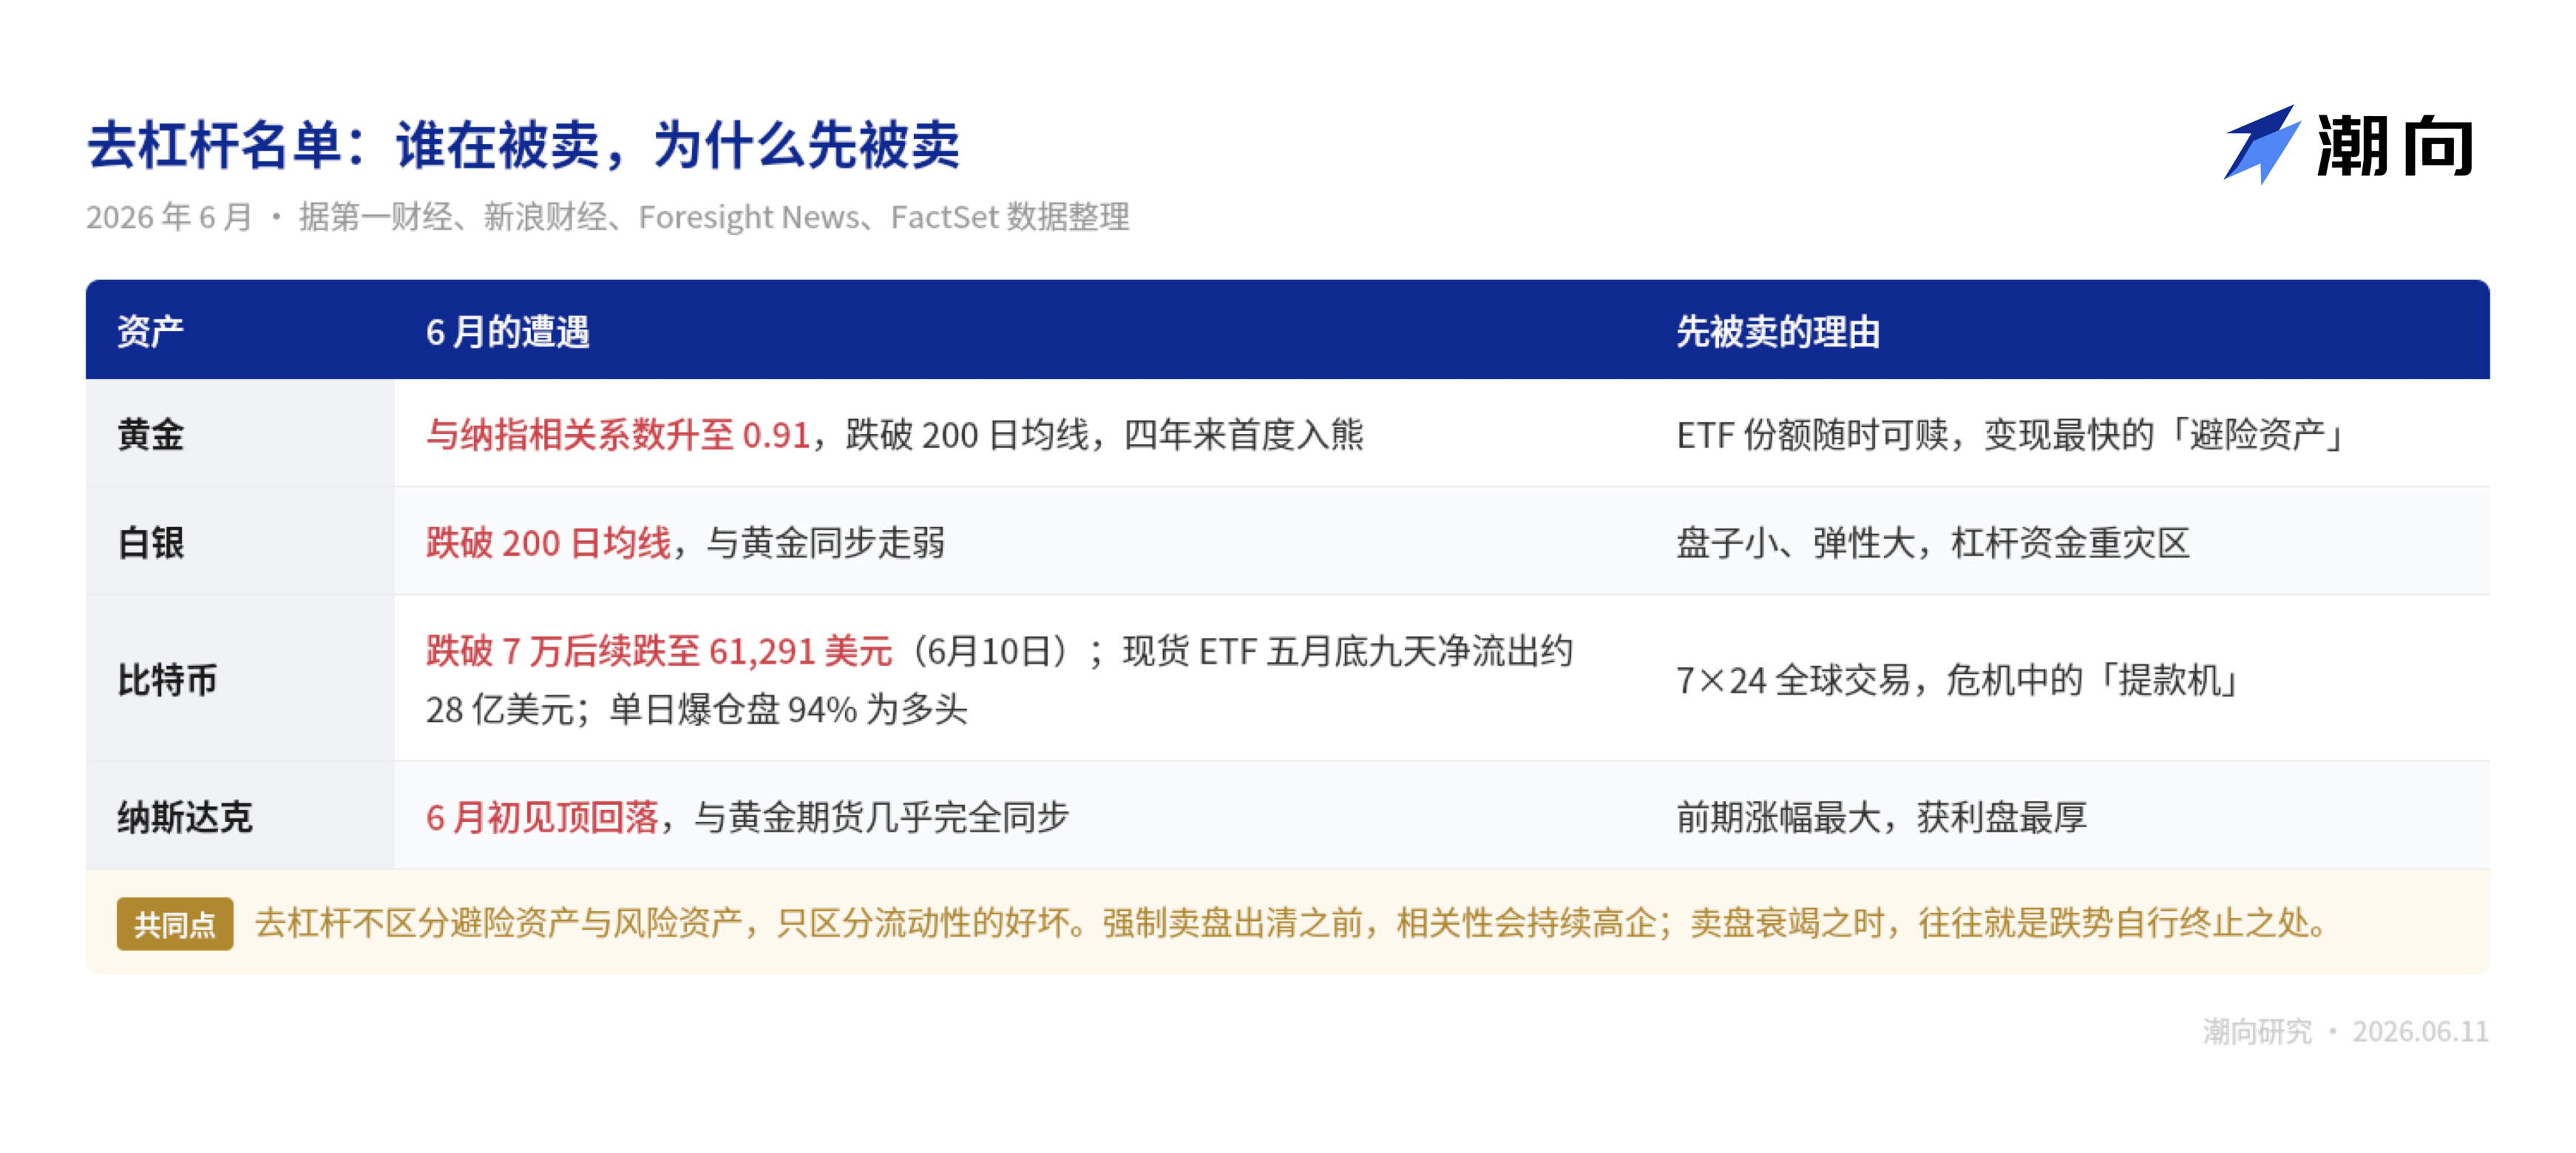
Yet if this were merely about gold and interest rates, June’s list of falling assets shouldn’t be this long. Silver, Bitcoin—and even the Nasdaq… all declined in unison, increasingly resembling a single coordinated trade.
Correlation With Nasdaq at 0.9: No One Is Immune in a Deleveraging Market
First, consider a puzzling anomaly.
Over the past three-plus months since gold peaked, the Nasdaq-100 Index kept rising—only topping out in early June. One asset sat halfway down a bear-market slope; the other stood atop a bull-market summit—seemingly on divergent paths.
Yet according to Caixin Global, Altavest Managing Partner—using FactSet data—calculated that since early June, around the time the Nasdaq topped out, the correlation coefficient between gold futures and the Nasdaq Index reached 0.91—nearly perfect synchronicity. His explanation: when investors seek liquidity, gold temporarily moves in lockstep with other risk assets.
What does this signify?
This is classic broad-market deleveraging. Excessive prior positioning and elevated leverage forced investors to liquidate quality assets to meet margin calls on losing positions. Put plainly: when cash is tight, you don’t sell what you *want* to sell—you sell what you can sell *fastest*.
The same story unfolded—even in “digital gold,” Bitcoin.
Early June saw Bitcoin break below $70,000, shedding 12% in a single week. Spot ETFs recorded nine consecutive days of net outflows totaling ~$2.8 billion by late May; among that week’s liquidations, 94% were long positions.
Bitcoin dropped 12% in one week; gold ETFs posted sustained net outflows—not due to illiquidity, but precisely because they’re *too* liquid. When leveraged positions face margin calls, the first assets sold are those that convert to cash fastest.
Here’s another intriguing detail. According to Yicai Global, the three biggest buyers driving gold’s January peak were the National Bank of Poland, Tether, and SPDR—the world’s largest gold ETF. Collectively, they amassed nearly 1,780 tonnes over the past year.
A stablecoin issuer converted profits into gold bars—only to stand alongside retail investors who chased the January peak, four months later. Crypto and traditional finance copied each other’s homework—and this time, got called to the principal’s office together.
Deleveraging has one defining trait: it doesn’t discriminate between good or bad assets—it distinguishes only between liquid and illiquid ones. Its end, therefore, bears no relation to fundamentals; forced selling stops only once all such positions are cleared—and the downtrend halts on its own.
The question remains: how do we tell when forced selling is truly exhausted? Historically, two nearly identical scripts offer guidance.
The 2022 Script: This Round Has Just Completed Its Fourth Month
Gold bear markets are rare—but their openings look strikingly similar.
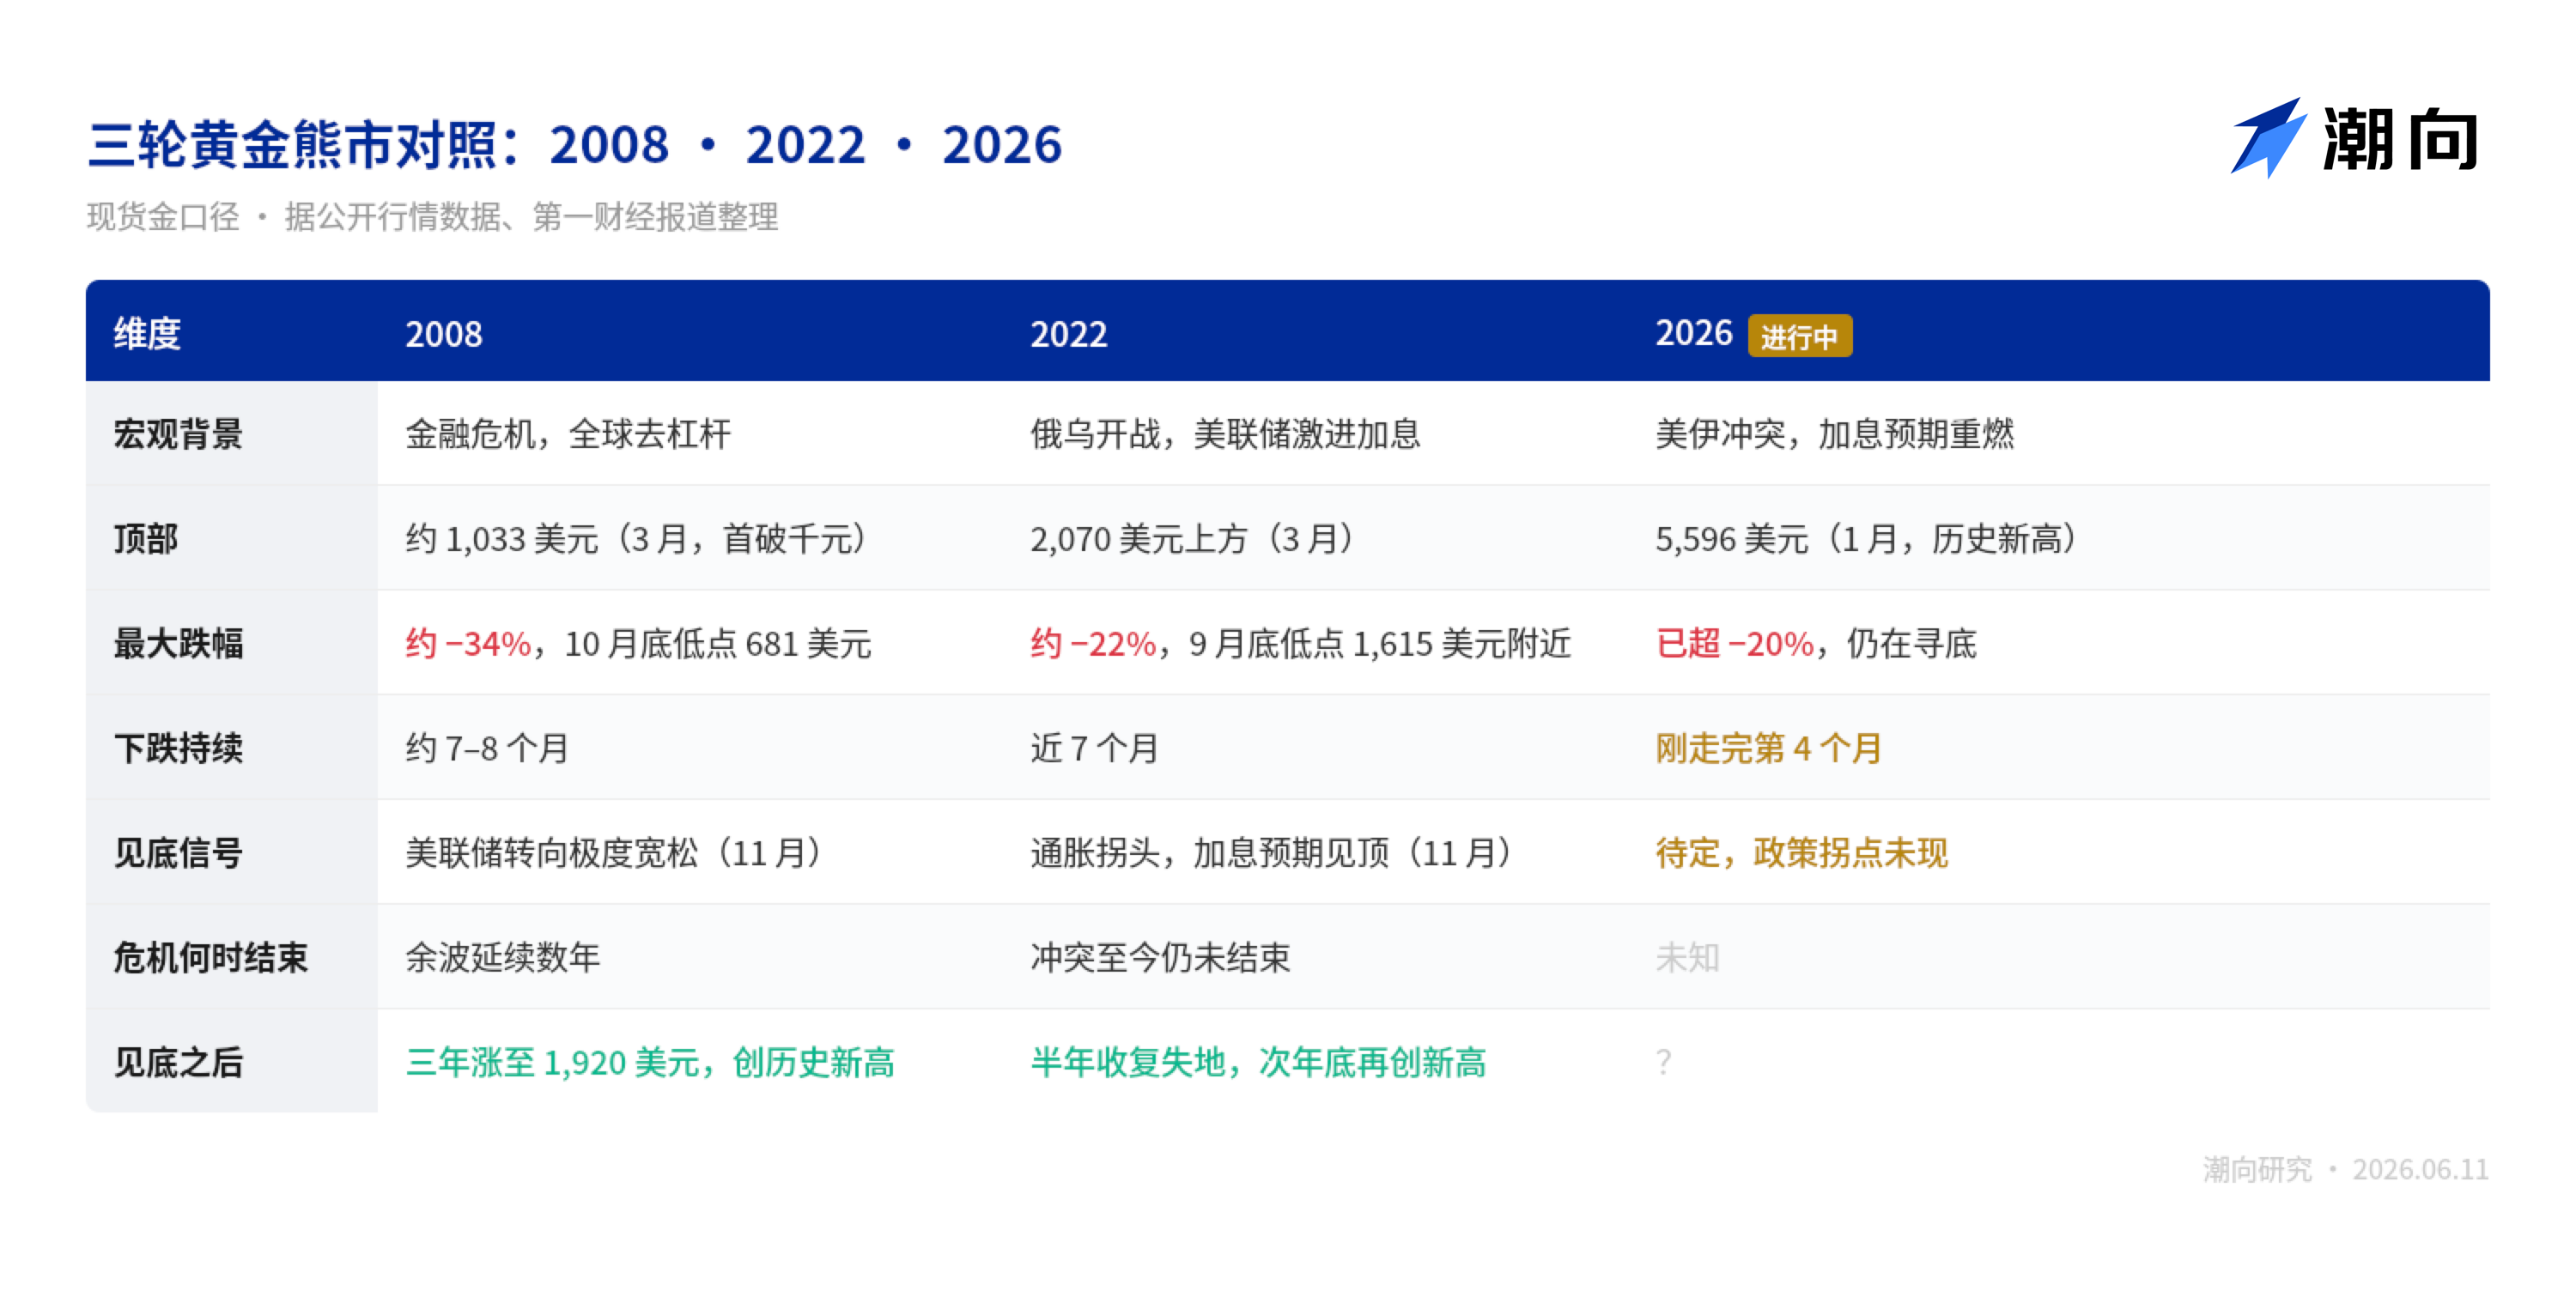
The first script is 2022. Public market data shows spot gold rose from ~$1,800 pre-Russia-Ukraine war, peaking above $2,070 post-invasion. The Fed then launched aggressive rate hikes in March—gold reversed course and fell nearly seven straight months, bottoming near $1,615 by late September, fully erasing its war-driven gains.
Gold found its floor in early November; six months later, it reclaimed all losses—and went on to rally through January 2025.
War—plus tightening. The structure mirrors today’s almost exactly.
The second script is 2008. During the Lehman crisis, gold initially fell alongside equities—from a March high above $1,000 down to $681 by late October, a drop exceeding 30%. The Fed then pivoted aggressively dovish; gold bottomed in November—and three years later soared to a record $1,920.
Both scripts share one critical feature: gold’s bottom signal has never aligned with ceasefire announcements—it responds solely to policy turning points.
The 2008 bottom emerged when the Fed pivoted toward massive easing; the 2022 bottom formed when inflation data peaked and rate-hike expectations topped out. The most compelling counterexample? The Russia-Ukraine conflict continues to this day—yet gold hit an all-time high back in late 2023.
Waiting for a ceasefire before buying is likely to result in missed opportunities.
Chronologically, counting from the late-January peak, this gold downturn has just completed its fourth month. In 2022, the bear market lasted nearly seven months.
However, note one key variable absent in 2022: central bank gold reserves.
Central banks’ foreign exchange reserve reallocations are pivotal. Gold’s market size pales beside U.S. Treasuries—so even modest position adjustments by major Treasury holders exert relatively large impacts on gold prices. This round’s central bank buying support forms a thicker floor than last time.
Bottom-Fishing Requires Watching Several Signals
Given gold’s steep fall, voices calling for bottom-fishing have already emerged. But let’s first clarify two things:
First, how much further could it fall? Second, what shape should the turning point take?
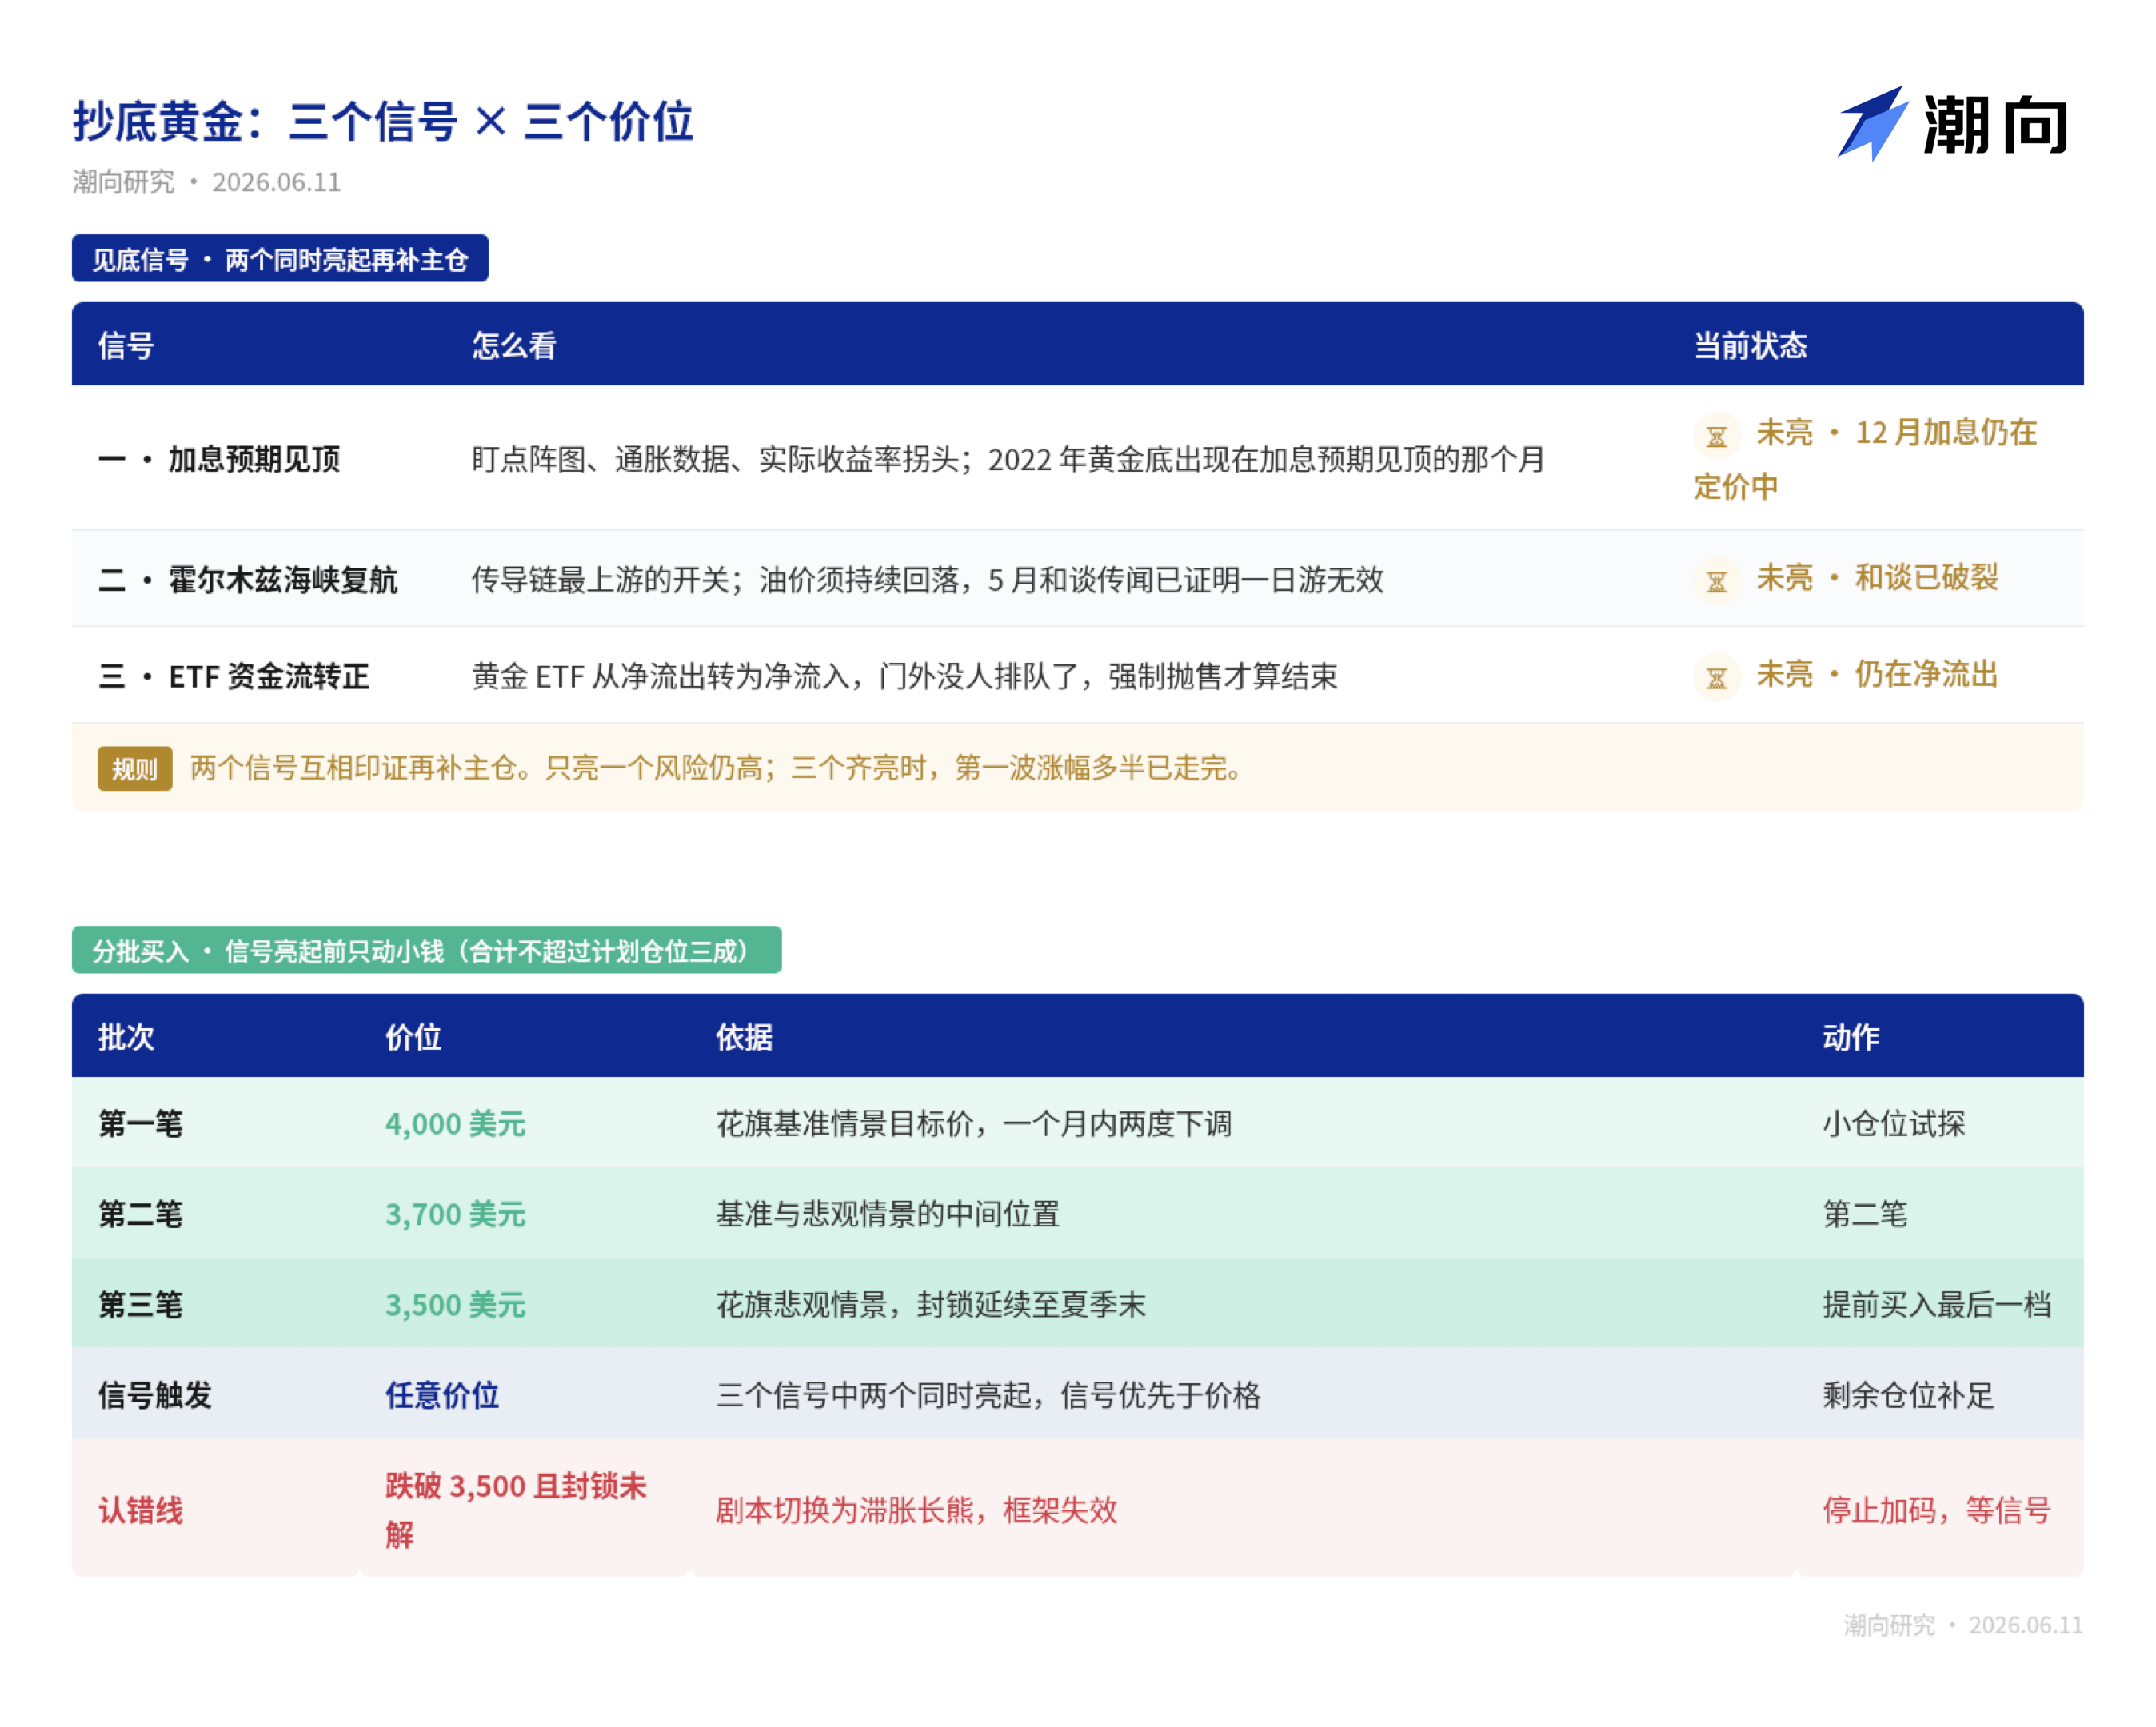
Start with depth. Per Caixin Global, Citigroup this week slashed its 3-month gold target from $4,300 to $4,000—and warned that if Hormuz Strait blockades persist through late summer, gold could plunge to $3,500. This marks Citigroup’s second revision within a month.
Investment banks’ targets aren’t infallible—but they define institutional views on this downturn’s floor. From current levels, the pessimistic scenario leaves roughly 15% downside room.
Now consider the turning point. Three signals deserve close monitoring:
- Signal 1: Peak in Rate-Hike Expectations.
As previously explained, interest rates power this bear market. Gold’s 2022 bottom formed precisely in the month rate-hike expectations peaked. If the December hike materializes, its execution may itself mark the reversal point.
Next week’s Fed meeting offers virtually zero chance of a rate change—but the dot plot and press conference tone will determine whether December’s hike signals an endpoint—or a new beginning.
- Signal 2: Resumption of Shipping Through the Hormuz Strait.
This is the upstream trigger for the entire transmission chain. Once the strait reopens, oil prices ease—lower energy costs ease inflation—easing inflation cools rate-hike expectations. Note the May peace rumor already proved: ceasefire talk alone isn’t enough—oil prices must sustainably fall, or the chain stalls.
- Signal 3: Gold ETF Flows Shift From Net Outflows to Net Inflows.
As noted earlier, leveraged positions and ETF redemptions drove this decline—gold ETFs being the fastest exit ramp. When queues outside that exit door vanish, forced selling ends.
Signals covered—now comes the author’s personal perspective (not necessarily correct, offered for reference only).
No one can pinpoint the exact bottom. The logic laid out earlier holds: this bear market’s engine is rate-hike expectations—and markets currently price in one 25-basis-point hike by year-end.
From $5,596 down to today’s $4,130, gold has shed nearly 26%—digesting most of the shift from “no hikes” to “one hike.” If rate-hike expectations don’t worsen further, remaining downside narrows.
Several public benchmarks help anchor the range:
Citigroup’s base and bear-case scenarios point to $4,000 and $3,500 respectively; the 2008 bear market saw a 34% drop—mapping to ~$3,700; the 2022 downturn fell 22%, corresponding to $4,365—this level sits
The author’s personal approach divides allocation across three tranches: $4,000 (first tranche), $3,700 (second), $3,500 (third)—totaling no more than 30% of planned exposure, with each tranche sized assuming it may be trapped (not investment advice—solely personal opinion).
Three tranches aren’t based on calculating the bottom—but precisely because it *can’t* be calculated. Diversifying entries hedges against misjudgment.
Whenever two of the above three signals simultaneously activate, deploy the remainder of planned capital immediately. By then, price may have already left the absolute low—but paying for a small portion of the upside buys certainty—the most cost-effective element of this entire strategy. However, if $3,500 breaks *and* Hormuz Strait blockades remain, pause further buying—wait for clearer signals.
Finally, “buy gold in turbulent times” isn’t wrong—but watching interest rates matters more than watching wars.
Disclosure: The author holds gold.

This article reflects the author’s personal views and does not constitute investment advice. All referenced price levels, signal frameworks, and position-sizing ideas represent personal analytical records—not buy/sell recommendations.
Markets carry risks; decisions require independent judgment.
Data Sources: Caixin Global · Yicai Global · Lanqiao Finance · Cailian Press · Sina Finance · CME FedWatch · Refinitiv (LSEG) · FactSet · Citigroup Research · China Securities Co., Ltd. Research · Yahoo Finance Market Data
TechFlow Research · June 2026
Join TechFlow official community to stay tuned
Telegram:https://t.me/TechFlowDaily
X (Twitter):https://x.com/TechFlowPost
X (Twitter) EN:https://x.com/BlockFlow_News