

Macroeconomic Research Report on the Crypto Market: A Geopolitical “Temporary Truce” and the Macroeconomic Liquidity “Contraction Trap”
TechFlow Selected TechFlow Selected
Macroeconomic Research Report on the Crypto Market: A Geopolitical “Temporary Truce” and the Macroeconomic Liquidity “Contraction Trap”
The cryptocurrency market in March 2026 stands at the intersection of geopolitical developments and macro liquidity.
Executive Summary
In March 2026, the global crypto market experienced sharp divergence amid dual pressures from macroeconomic and geopolitical forces. The month’s focal point was the dramatic turn in U.S.-Iran tensions: after issuing a 48-hour ultimatum, the Trump administration abruptly announced a “five-day delay” in military action against Iran, citing “productive dialogue” with Tehran—only for Iran to immediately deny any direct or indirect contact. Widely interpreted by analysts as a “stalling tactic,” this move essentially reflected the U.S. government’s forced compromise amid surging oil prices hitting $110 per barrel and mounting pressure ahead of the midterm elections. Meanwhile, the Federal Reserve held rates steady at its March FOMC meeting; the dot plot indicated that 14 officials expect zero or just one rate cut in 2026. Powell acknowledged that Middle East hostilities had heightened upside risks to inflation and explicitly stated, “We will not cut rates until we see progress on inflation.” The macro environment thus settled into a classic “stagflation” narrative—slowing growth coexisting with stubborn inflation. Against this backdrop, crypto assets exhibited pronounced internal structural divergence: Bitcoin demonstrated remarkable resilience, buoyed by sustained institutional inflows.
I. Geopolitical “Stalling Tactic”: Trump’s Reversal and the Strait of Hormuz Gambit
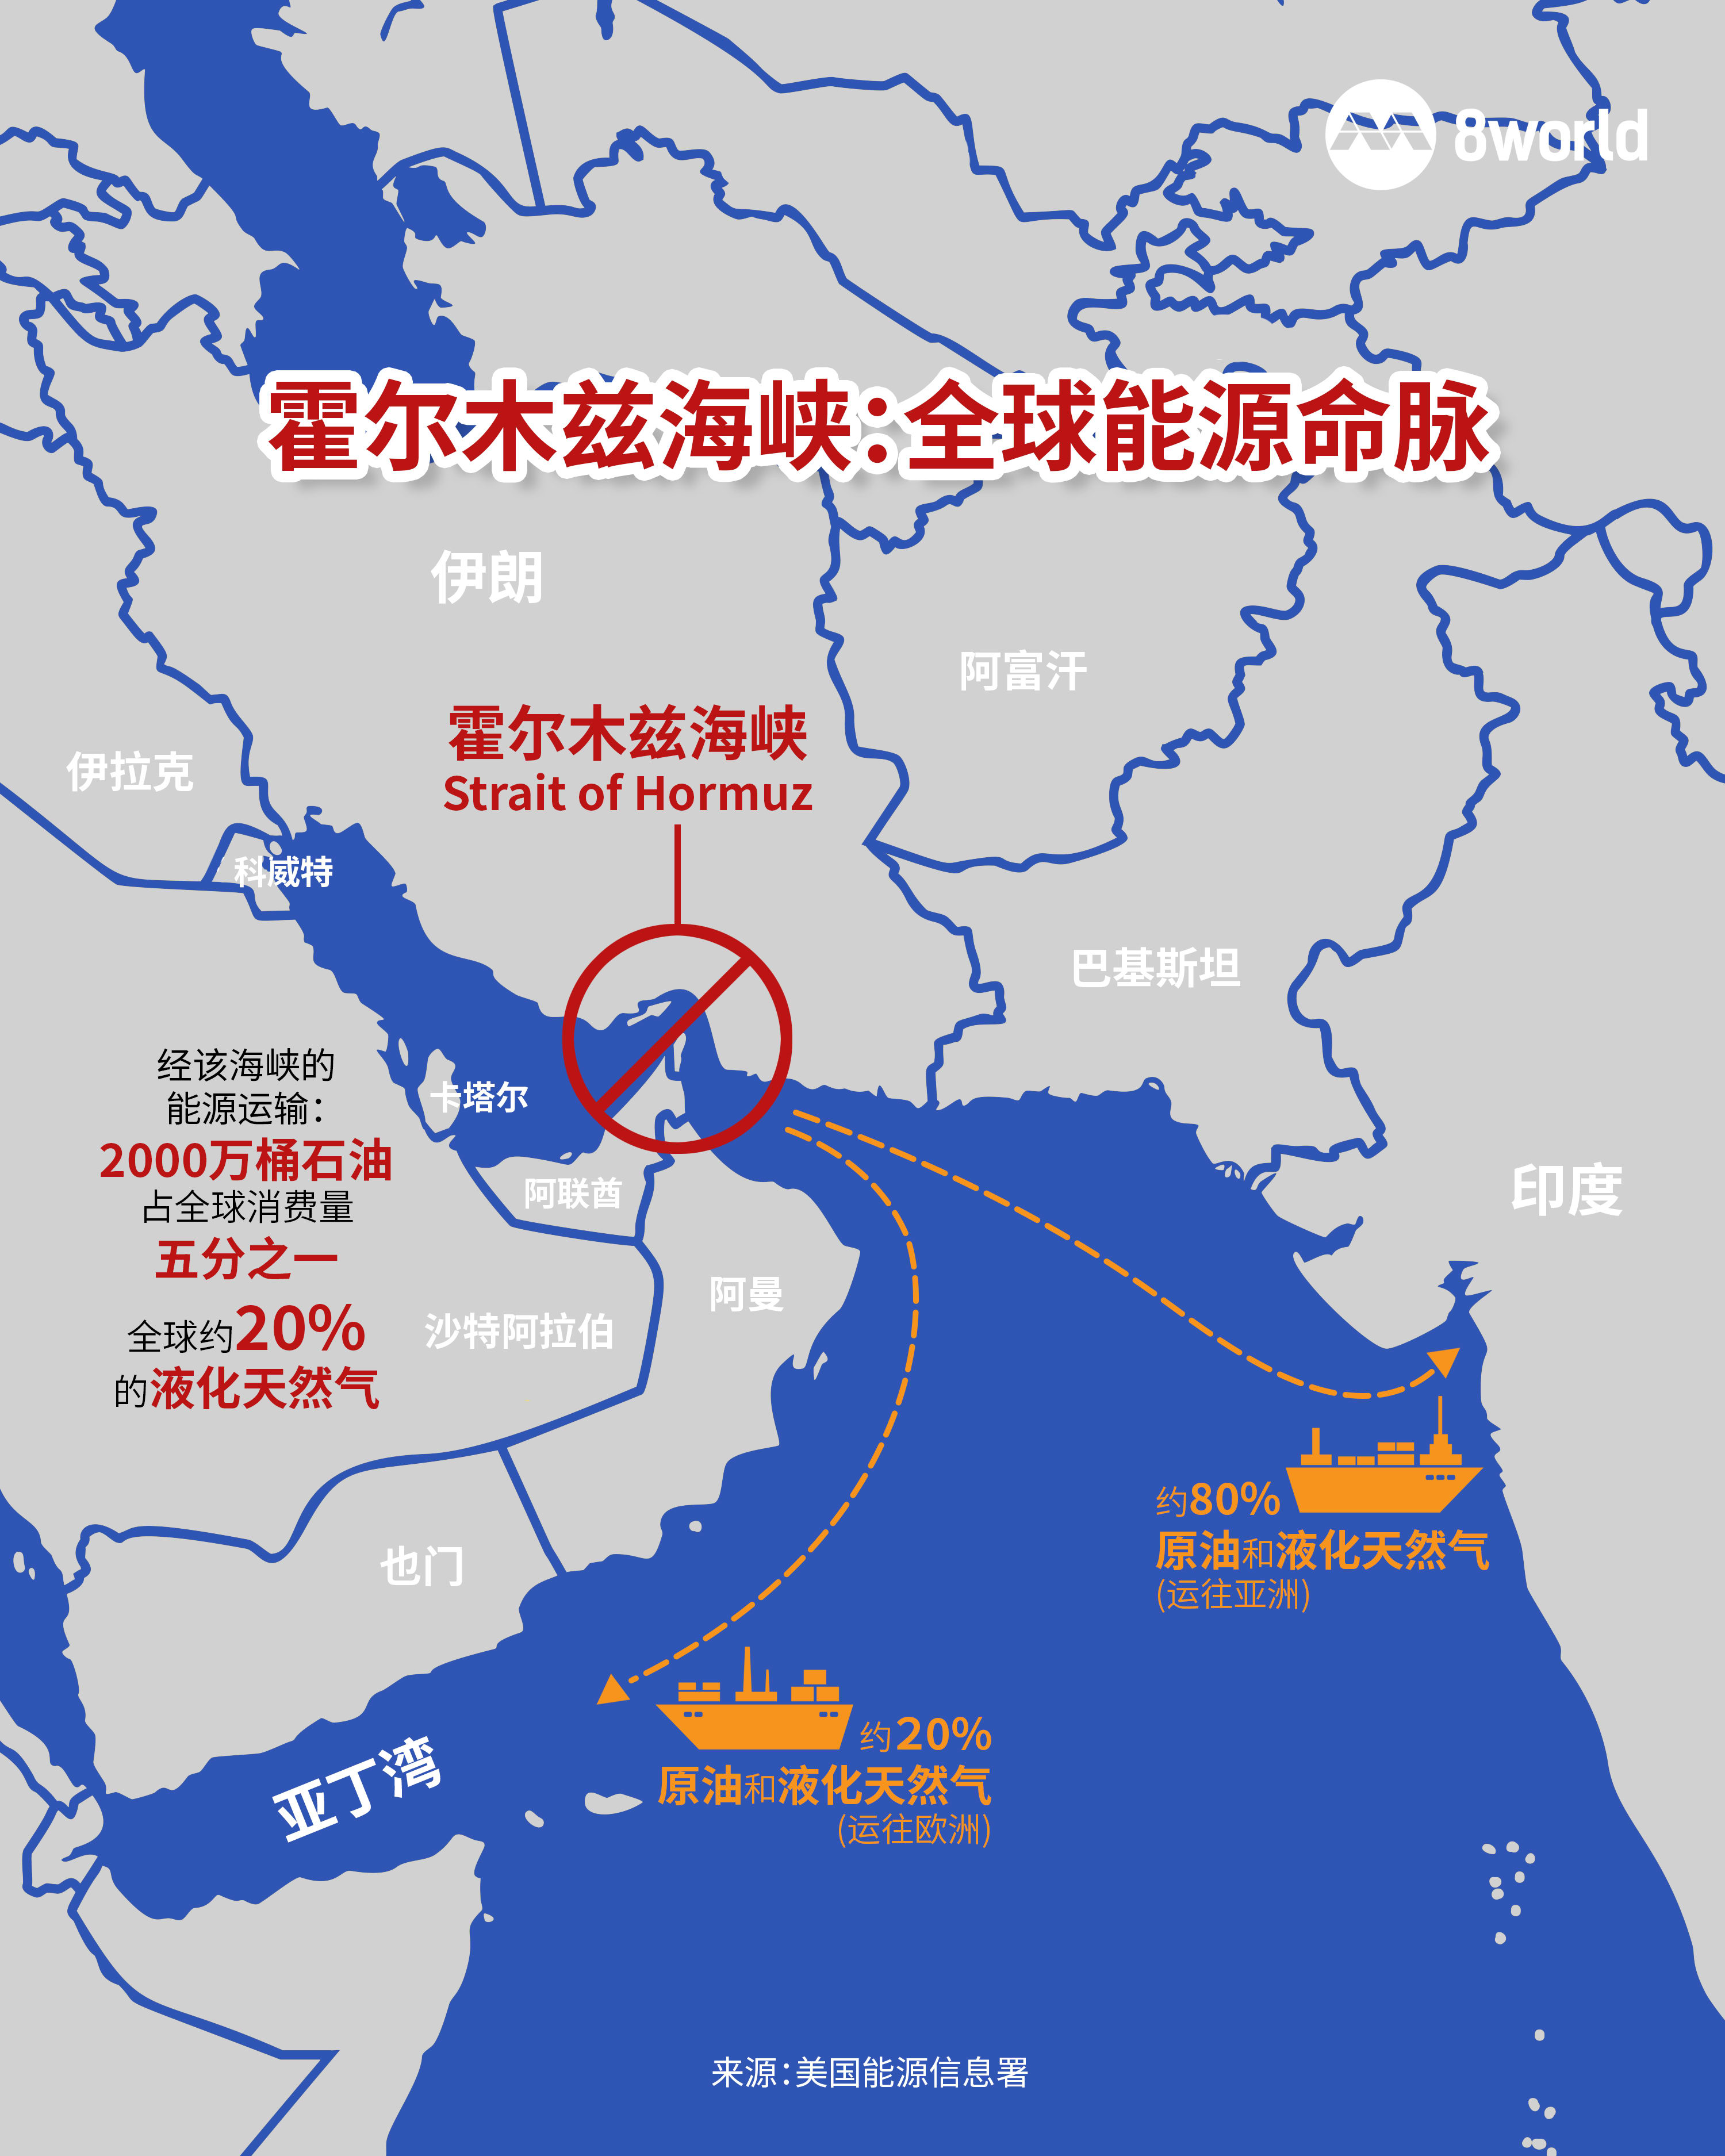
The Middle East crisis in March 2026 emerged as the central variable disrupting global risk assets. On March 21, U.S. President Trump issued an ultimatum to Iran, demanding it reopen the Strait of Hormuz within 48 hours—or face destruction of “all power plants” in Iran. Iran responded defiantly, warning that if the U.S. followed through, all energy and oil infrastructure across the Middle East would become legitimate targets. Yet, as the deadline neared, Trump dramatically announced on March 23 that the U.S. would “delay strikes on Iranian power plants by five days,” claiming the U.S. and Iran had engaged in “very good and productive” talks over the past two days and reached agreement on key points.
This last-minute reversal exposed multiple pressures confronting the U.S. government. First, ongoing hostilities pushed global oil prices above $110 per barrel, pushing U.S. average gasoline retail prices near $4 per gallon—up more than $1 since late February—and directly exacerbating domestic inflation. Second, high fuel costs threatened midterm election prospects; the conservative Heritage Foundation warned that escalating conflict could enable Democrats to “seize control of Congress.” Third, U.S. Gulf allies privately cautioned Trump that bombing Iranian power plants could trigger “catastrophic escalation.” These factors collectively prompted Trump’s shift in stance.
Yet official narratives from the two sides diverged fundamentally. Iranian Foreign Ministry Spokesperson Bahram Baghaei explicitly stated that Iran had held no negotiations with the U.S., and had only received U.S. messages relayed via friendly countries over the past few days. Iranian Parliament Speaker Ali Larijani likewise denied any negotiations with the U.S. This contradiction triggered acute market vigilance—Central Party School Professor Liang Yabin noted that Trump’s maneuver is likely a “stalling tactic”: first, after over 20 days of airstrikes, U.S. missile inventories may be depleted, requiring replenishment time; second, the U.S. Marine Corps’ 31st Marine Expeditionary Unit is scheduled to arrive in the Middle East on March 27—the very date Trump reset as the new deadline.
For energy and crypto markets alike, the fate of the Strait of Hormuz became the core pricing variable. This global oil transport “chokepoint” handles roughly 20% of the world’s energy flows. Iranian officials made clear the Strait would not revert to its pre-war status, ensuring long-term energy market instability. Markets reacted swiftly: Brent crude remained anchored near $110, while WTI held above $100. Wintermute’s market analysis observed that news of the U.S. pausing attacks on Iranian energy infrastructure for five days temporarily lowered the geopolitical risk premium, causing Brent to retreat and Bitcoin to rebound above $70,000. Yet whether this “calm” represents a fleeting window—or a trap preceding escalation—remains highly uncertain.
II. The Fed’s “Hawkish Claws” and the Stagflation Shadow: Sharp Retreat in Rate-Cut Expectations
Amid intensifying geopolitical turbulence, the Federal Reserve further tightened macro liquidity expectations. At 2:00 a.m. Beijing time on March 19, the Fed announced its March monetary policy decision, holding the target federal funds rate steady at 3.5%–3.75%, in line with market expectations. However, the dot plot delivered a decisively hawkish signal: of the 19 FOMC members, seven now project no rate cuts in 2026—up one from December 2025—while the number supporting more than one cut declined markedly. The median projection indicates just one cut in 2026 and another in 2027, settling the long-run neutral rate near 3.1%.
More significantly, the Fed substantially revised upward its inflation forecasts, lifting its Q4 2026 PCE inflation projection from 2.4% to 2.7%, with core PCE rising by 0.2 percentage points. This adjustment directly reflects the impact of Middle East conflict-driven oil price spikes. In his press conference, Powell acknowledged, “Rising energy prices are directly affecting the central bank’s outlook,” emphasizing, “We cannot casually dismiss energy-driven inflation.” He explicitly stated the Fed would not consider rate cuts “until we see tangible progress on inflation.” Internal committee discussions have even begun exploring the possibility of the next hike—though this remains outside the baseline scenario for most officials.
Immediately following the FOMC meeting, U.S. March PMI data released on March 24 deepened market stagflation concerns. The report showed slowing business activity alongside accelerating price pressures—confirming a simultaneous deterioration in growth and persistence in inflation. Markets reacted negatively: the 5-year Treasury yield surged to a nine-month high of 4.10%; the Nasdaq Composite fell 1.5%; and Bitcoin briefly dipped to $70,900. More alarmingly, bond futures implied a 7-month rate hike probability that soared from nearly 0% a week earlier to 20.5%.
This macro environment imposes a dual constraint on crypto assets. On one hand, elevated interest rates suppress valuation expansion for risk assets; on the other, persistent inflation leaves the Fed no room for easing. Powell specifically noted that Middle East conflict poses downside risks to both economic growth and employment, while simultaneously exerting upward pressure on inflation—a “two-way tension” trapping monetary policy in a dilemma. For crypto markets, this implies little expectation of near-term liquidity support from monetary policy, forcing the sector to rely instead on endogenous strength and structural narratives to sustain prices.
III. Institutional Capital’s Divergent Paths: Bitcoin ETF Resilience vs. Ethereum’s Struggles
Against persistent macro headwinds, institutional capital flows displayed stark divergence. Data for the week ending March 22 showed U.S. spot Bitcoin ETFs recorded net inflows of $93.1 million—marking their second consecutive week of positive flows—with total assets under management reaching $90.3 billion. This contrasts sharply with earlier market fears: just mid-March, Bitcoin ETFs suffered a single-day outflow of $708 million—the largest in two months. Yet institutions did not exit; instead, they increased allocations during market panic. BlackRock’s IBIT led inflows with $190 million for the week.
In stark contrast, spot Ethereum ETFs posted net outflows of $60 million that same week, with BlackRock’s ETHA alone shedding $69.6 million. This flow divergence translated directly into price performance: Bitcoin rebounded to ~$74,500 in late March, while Ethereum slid to $2,180—down 6% weekly. More concerning is Ethereum’s leveraged structure: CryptoQuant data shows 75% of Ethereum held on Binance is leveraged, rendering the asset exceptionally vulnerable to negative fund flows.
This institutional preference split reflects two distinct investment logics. Bitcoin is increasingly viewed by institutions as a “digital gold” and macro hedge alternative—its scarcity and post-halving supply-demand dynamics align closely with traditional asset-allocation frameworks. Morgan Stanley’s Global Investment Committee even recommends capping crypto exposure in model portfolios at no more than 4%, while Bank of America supports a 1%–4% allocation range. Ethereum, by contrast, is treated more as a “tech asset” or “beta asset,” typically bearing the brunt in environments of economic uncertainty and elevated rates.
Another telling signal: despite sustained Bitcoin ETF inflows, market sentiment has plunged into “extreme fear.” Coinglass data shows 25 of the past 30 days registered “extreme fear” levels. This coexistence of institutional buying and retail fear forms a classic “wall of worry.” Pratik Kala, Research Head at Apollo Crypto, noted, “Historically, these zones have proven excellent entry points for accumulating Bitcoin.” Institutions appear to be systematically accumulating amid market panic.
IV. Bitcoin’s Macro Identity: Risk Asset or Safe Haven?
This round of geopolitical shock provided a fresh test of Bitcoin’s asset classification. Conventional wisdom holds that geopolitical conflict should drive capital toward “safe-haven” assets like gold and Bitcoin. Yet market behavior following the March Middle East escalation upended that narrative: gold suffered its worst weekly drop since 1983—down over 10%—nearly erasing its entire year-to-date gains. Bitcoin also hit a two-week low of $67,371 during Asian trading hours on March 23 before rebounding on news of the delayed strike.
This synchronized decline reveals Bitcoin’s current core identity: it remains a risk asset—not yet a mature safe haven. Haider Rafique, Global Managing Partner at OKX, observed, “Weeks of such extreme volatility tend to test Bitcoin’s emerging ‘new safe-haven’ narrative—especially given its recent price trend moving more in tandem with risk assets than inversely.” Throughout March’s turmoil, Bitcoin correlated positively with U.S. equities and Asian stocks—contradicting its idealized “digital gold” positioning.
Still, Bitcoin displayed relative resilience versus equities. Month-to-date, Bitcoin rose ~4%, while the Nasdaq fell over 5%. This differential likely stems from two factors: first, sustained institutional inflows providing price support; second, Bitcoin’s unique micro-foundation—its supply-side structure (post-halving scarcity) combined with demand-side dynamics (institutional allocation via ETF channels). In short, Bitcoin’s pricing is shifting from purely macro-driven to a dual-engine model: “macro + institutional supply-demand.”
Another critical variable is oil’s relationship with Bitcoin. Wintermute’s analytical framework identifies the Strait of Hormuz’s navigability as a transmission channel linking oil prices to Bitcoin. Its logic chain runs: Strait obstruction → oil price surge → higher inflation expectations → Fed maintaining tight policy → risk assets pressured → Bitcoin falls. Thus, Trump’s “delay” announcement triggered falling oil prices and Bitcoin’s subsequent rebound—validating this mechanism. If oil stabilizes near $100 rather than spiking further, Bitcoin may actually benefit from “containable” geopolitical risk.
V. Outlook: Three Scenarios and Key Observables
Integrating geopolitical and macro liquidity variables, the crypto market over the next 1–2 months may evolve along three plausible scenarios—each corresponding to distinct price ranges and portfolio strategies.
Scenario One: Sustained De-escalation & Oil Stabilization. If Trump’s “delay” genuinely initiates durable diplomatic engagement and Strait of Hormuz navigation gradually normalizes, Brent crude could stabilize near $100. Under this scenario, geopolitical risk premiums recede, easing inflation pressure on the Fed and granting risk assets breathing room. Wintermute projects Bitcoin could test resistance between $74,000–$76,000. Should institutional accumulation continue, Bitcoin might even rise to $80,000. Key observables include: U.S. military actions following the March 27 arrival of reinforcements in the Middle East; whether U.S.-Iran indirect talks resume; and whether U.S. gasoline retail prices retreat from the $4-per-gallon peak.
Scenario Two: Renewed Escalation & Conflict Intensification. Trump’s “stalling tactic” may simply buy time for military preparations. If, upon the March 27 deadline, U.S. reinforcements enable a harder line—and Iran follows through on its threat to “close the Strait of Hormuz”—oil could breach $120 or even approach $140. Global inflation expectations would spike, forcing the Fed to tighten further. Bitcoin could fall to the $65,000 zone—or test the psychological $60,000 level. This scenario would replay a “Black Monday”-style broad selloff, reinforcing Bitcoin’s positive correlation with risk assets.
Scenario Three: Deepening Stagflation & Macro Dominance. Regardless of Middle East developments, the U.S. economy’s emerging stagflation traits may dominate. March PMI data confirmed slowing growth alongside rising prices, while the Fed’s dot plot signals only one 2026 cut. If this “stagflation” dynamic persists, the Fed could hold rates steady throughout 2026—or even revisit hiking. Under this macro regime, Bitcoin faces dual pressure—valuation compression and liquidity tightening—but structural tailwinds (halving effects, ETF access, institutional adoption) may provide partial offset. Markets would enter a tug-of-war between “macro pressure” and “institutional floor,” sustaining elevated volatility.
Key observables investors must monitor include: First, the evolution of Middle East tensions after U.S. reinforcements arrive on March 27—the initial litmus test of Trump’s “stalling tactic”; second, weekly U.S. inflation (CPI/PCE) and labor data to gauge stagflation progression; third, the sustainability of Bitcoin ETF flows—particularly inflow intensity into flagship products like BlackRock’s IBIT; fourth, real-time metrics on Strait of Hormuz navigation and tanker insurance premiums—more reliable indicators of true risk than official statements.
In sum, the crypto market in March 2026 stands at the intersection of geopolitics and macro liquidity. The Trump administration’s “stalling tactic” granted markets a brief respite—but the fundamental gulf between U.S. and Iranian positions means conflict remains far from resolved. Meanwhile, the Fed’s hawkish posture and stagflation shadow constitute persistent macro-level pressure. In this environment, Bitcoin exhibits distinctive resilience: sustained institutional inflows are reshaping its supply-demand fundamentals, enabling it to outperform other risk assets. Yet declaring Bitcoin a mature safe haven remains premature—its positive correlation with risk assets remains the dominant short-term feature. For investors, the coming weeks hinge on distinguishing “genuine de-escalation” from “false preparation,” balancing geopolitical risk premiums against macro liquidity constraints. As Wintermute’s analysis suggests, the fate of the Strait of Hormuz may well serve as Bitcoin’s short-term price “compass.”
Join TechFlow official community to stay tuned
Telegram:https://t.me/TechFlowDaily
X (Twitter):https://x.com/TechFlowPost
X (Twitter) EN:https://x.com/BlockFlow_News


