

The Most Underrated Chapter in Ray Dalio’s *Principles*: On the Big Cycle, He Explained It All Three Years Ago
TechFlow Selected TechFlow Selected
The Most Underrated Chapter in Ray Dalio’s *Principles*: On the Big Cycle, He Explained It All Three Years Ago
Why Can’t I Ignore the Pattern That Has Repeated for 500 Years in Macro Cycles?
Author: Ray Dalio
Translated and edited by TechFlow
TechFlow Introduction: This article has garnered 75 million views. It is Chapter 2 of Ray Dalio’s Principles for Navigating Big Debt Crises, specifically addressing portfolio allocation within the framework of the “Big Cycle.”
Dalio uses real historical data to reveal a disturbing fact: over the past century, seven of the ten major countries experienced near-total wealth destruction at least once—yet most investors have never studied this history. At a time when global order tensions are intensifying, this analytical framework holds far greater relevance than typical macro commentary.
Full text below:
Last week, I shared a chapter from my 2021 book Principles for Navigating Big Debt Crises, detailing the classic warning signs and evolutionary processes that occur when the geopolitical world order collapses during what I call the “Big Cycle.” The article was extremely popular, attracting over 75 million views, and many readers asked what this implies for investing.
Given the volume of such inquiries, I am now sharing the next chapter from the book—“Investing Within the Big Cycle”—with you. I believe it offers valuable perspective for today’s investment environment. You can read the full chapter below.
In addition, because many readers have expressed interest in my investment principles, I will share more of them over the coming weeks. If you’d like to receive notifications when new content is published, please subscribe to my newsletter, Principled Perspectives, or sign up for email alerts.
My strategy for navigating life and my professional career is to figure out how the world works, formulate corresponding principles for dealing with it, and then position myself accordingly. The research I present in this book was conducted precisely for this purpose.
Naturally, as I reflect on everything covered so far, I consider how to apply these insights to investing. To be confident that I’m doing well, I need to know how my approach would have performed historically. If I cannot confidently explain what happened in the past—or at least lack a strategy for handling what I don’t know—I consider that a dangerous oversight.
As my study of the past 500 years reveals, history exhibits large cycles of wealth and power accumulation and destruction, driven primarily by debt and capital market cycles. From an investor’s perspective, this can be termed the “Big Investment Cycle.” I believe it is essential to thoroughly understand these cycles in order to tactically shift or diversify portfolios—to guard against them or profit from them. By understanding these cycles—and ideally assessing where countries stand within them—I can do just that.
Over my roughly 50-year career as a global macro investor, I’ve uncovered numerous timeless and universal truths that form the basis of my investment principles. While I won’t delve into all of them here—most will appear in my forthcoming book, Principles for Navigating Economic and Investment Cycles—I want to convey one key principle.
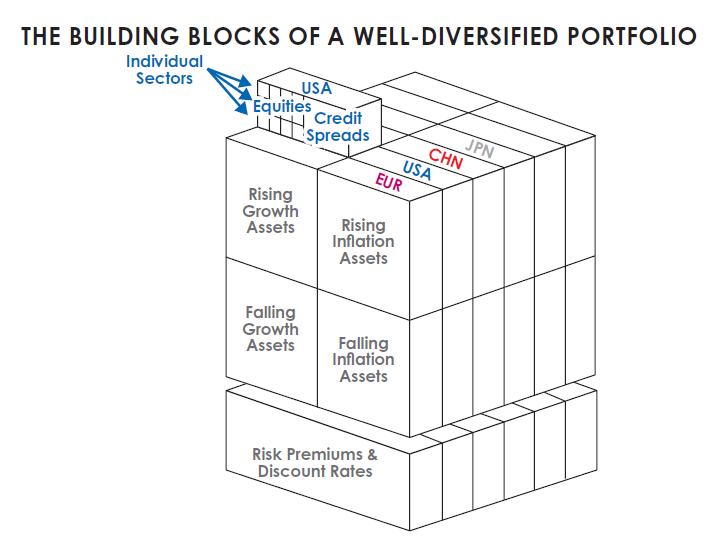
All markets are driven primarily by four factors: growth, inflation, risk premium, and discount rate.
This is because all investments are essentially exchanges between a single upfront payment and future payments. Future cash flows are determined by growth and inflation; the risk premium reflects how much risk investors are willing to bear relative to holding cash; and the present value—the worth of those future payments today—is determined by the discount rate.
Changes in these four determinants drive changes in investment returns. Tell me how each of these four factors will evolve, and I’ll tell you how investments will perform. Understanding this allows me to connect what’s happening in the world with what’s happening in markets—and vice versa. It also shows me how to balance my portfolio so that it isn’t biased toward any particular environment—precisely what constitutes effective diversification.
Governments influence these factors through fiscal and monetary policy. Thus, the interaction between what governments expect to happen and what actually occurs is precisely what drives cycles. For example, when growth and inflation run too low, central banks create more money and credit growth, generating purchasing power—first spurring faster economic growth, then—in lagged fashion—higher inflation. When central banks restrict money and credit growth, the opposite happens: both growth and inflation slow.
Central governments and central banks differ in how they drive market returns and economic conditions. Central governments decide where their funds come from and where they go, since they can tax and spend—but cannot create money and credit. Central banks, by contrast, can create money and credit, but cannot determine where that money and credit flow into the real economy. The actions of central governments and central banks affect the buying and selling of goods, services, and investment assets, pushing their prices up or down.
To me, every investment asset reflects these drivers in its own way, logically aligned with its sensitivity to future cash flows. Each investment asset serves as a building block in a portfolio—the challenge lies in assembling these blocks appropriately while accounting for these factors.
For instance, when growth exceeds expectations, stock prices may rise, all else equal; when both growth and inflation exceed expectations, bond prices may fall.
My goal is to combine these building blocks into a balanced, diversified portfolio that is tactically tilted based on world events currently unfolding—or about to unfold—that impact these four drivers. These blocks can be segmented by country, by environment preference, and even down to sectors and individual companies. When applied to a balanced portfolio, this concept yields the result shown in the diagram below. It is through this lens that I examine historical events, market history, and portfolio behavior.
I recognize my approach differs from most investors’ for two reasons. First, most investors do not seek historical analogues, believing history—and past investment returns—are largely irrelevant to them. Second, they do not view investment returns through the lens I just described. I believe these perspectives give me—and Bridgewater—a competitive edge, but whether or not you adopt them is up to you.
Most investors set expectations based on their own lifetime experiences; a few more diligent ones look back to see how their decision rules would have performed in the 1950s or 1960s. Among the investors I know—and the senior economic policymakers I know (and I know many of the best)—none possesses an outstanding understanding of what happened in the past and why. Most investors who examine longer-term returns treat U.S. and U.K. returns—as nations that won both World Wars—as representative data.
That’s because few stock and bond markets survived World War II. Yet these countries and periods are unrepresentative due to survivorship bias. Examining U.S. and U.K. returns means examining uniquely fortunate nations during the most favorable period of the Big Cycle. Failing to examine what occurred elsewhere and earlier produces a distorted perspective.
Applying logical reasoning from known facts about the Big Cycle—and extending our view forward several decades to examine what happened across different places—we arrive at a startlingly different perspective. I’ll demonstrate this, because I believe you should understand it.
During the 35 years before 1945, nearly all wealth was destroyed or confiscated in most countries. In some, capitalists were killed or imprisoned amid fury directed at them, as capital markets and capitalism collapsed alongside other facets of the old order.
If we look back over several centuries, we see such extreme boom/bust cycles recurring regularly—periods of capitalist and market prosperity (e.g., the Second Industrial Revolution and Gilded Age at the turn of the 20th century), followed by transitional periods (e.g., escalating internal conflict and intensified international competition for wealth and power during the 1900–1910 decade), culminating in major conflicts and economic depressions (like those occurring between 1910 and 1945).
We also see that the causal relationships underlying those booms and busts resemble today’s late-cycle depression-and-restructuring phase more closely than the early-cycle prosperity-and-construction phase.
My aim is simply to see and understand what happened in the past—and then do my best to show it to you. That’s what I’m attempting now. I’ll begin around 1350, though the story began long before then.
The Big Cycle of Capitalism and Markets
Prior to approximately 1350, lending at interest was prohibited by Christianity and Islam—and within Jewish communities under Judaism—as it created serious problems: human nature led people to borrow beyond their repayment capacity, causing tension between borrowers and lenders, often erupting into violence. Without lending, money remained “hard money” (gold and silver). Roughly a century later, during the Age of Exploration, explorers traveled the globe, collecting gold, silver, and other hard assets to accumulate wealth. This was the dominant method of wealth accumulation at the time. Profits were split between explorers and their financiers—a highly effective, incentive-based system for wealth creation.
The alchemy of lending, as we know it today, was first invented in Italy around 1350. Lending rules changed, and new forms of money emerged: bank deposits, bonds, and stocks—very similar to those we know today. Wealth became promises to pay money—what I call “financial wealth.”
Consider the immense impact of inventing and developing bond and stock markets. Before then, all wealth was tangible. Think of how much more “financial wealth” these markets created. To imagine the difference, consider how much “wealth” you’d have if your bank deposits and the future payments promised by your stocks and bonds didn’t exist. You’d have almost nothing—you’d feel bankrupt and behave differently—for example, accumulating more savings in tangible assets. That’s roughly what life was like before bank deposits, bonds, and stocks existed.
With the invention and growth of financial wealth, money was no longer constrained by gold and silver. With money and credit—and purchasing power—less constrained, entrepreneurs routinely founded companies, borrowed money, and/or sold company shares to fund good ideas. They could do so because promises to pay became entries in ledgers.
Around 1350, those who could do this—most famously the Medici family of Florence—could create money. If you can create credit—say, five times actual money (as banks can)—you generate enormous purchasing power, reducing reliance on other forms of money (gold and silver). Creating new money was—and remains—a kind of alchemy. Those who could create and wield it—bankers, entrepreneurs, and capitalists—grew extremely wealthy and powerful.
This process of expanding financial wealth continues to this day. Financial wealth has grown so vast that hard money (gold and silver) and other tangible assets (e.g., real estate) have become relatively unimportant. But naturally, the more promises held as financial wealth, the greater the risk those promises won’t be fulfilled. This is the root cause of the classic big debt/money/economic cycle. Consider how much financial wealth exists relative to real wealth—and imagine you and others holding financial wealth actually tried converting it into real wealth—i.e., selling it to buy things. It would be like a bank run. It couldn’t happen. Bond and stock values are far too high relative to what they can buy. But remember: under fiat currency systems, central banks can print money to meet demand. This is a timeless, universal truth.
Also remember: paper money and financial assets (e.g., stocks and bonds)—essentially promises to pay—have little intrinsic use; only what they can buy matters.
As detailed in Chapter 3, when credit is created, purchasing power is created alongside the promise to repay—stimulating the economy in the short term but suppressing it in the long term. This creates cycles. Historically, the desire to obtain money (via borrowing or selling stocks) has coexisted symbiotically with the desire to store money (via lending or buying stocks as investments). This has driven growth in forms of purchasing power, ultimately generating far more payment promises than deliverable goods—and crises of unfulfilled promises, manifesting as debt-default depressions and stock-market crashes.
Then bankers and capitalists were literally—and figuratively—hanged; massive wealth and lives were destroyed; and huge quantities of fiat money (money that can be printed and has no intrinsic value) were issued to try to alleviate the crisis.
The Full Picture of the Big Cycle from an Investor’s Perspective
While reviewing all relevant history from 1350 to today would be overwhelming, I’ll show you what investing would have looked like starting from 1900. But first, I want to explain how I view risk—because I’ll emphasize these risks throughout what follows.
To me, investment risk is failing to earn enough to meet your needs—not volatility measured by standard deviation—though the latter is almost exclusively used as a risk metric.
To me, the three greatest risks most investors face are: (1) portfolios failing to generate sufficient returns to meet spending needs; (2) portfolio destruction; and (3) large-scale wealth confiscation (e.g., via high taxation).
Though the first two risks sound similar, they’re actually distinct—because average returns might exceed requirements while still suffering one or more devastating losses.
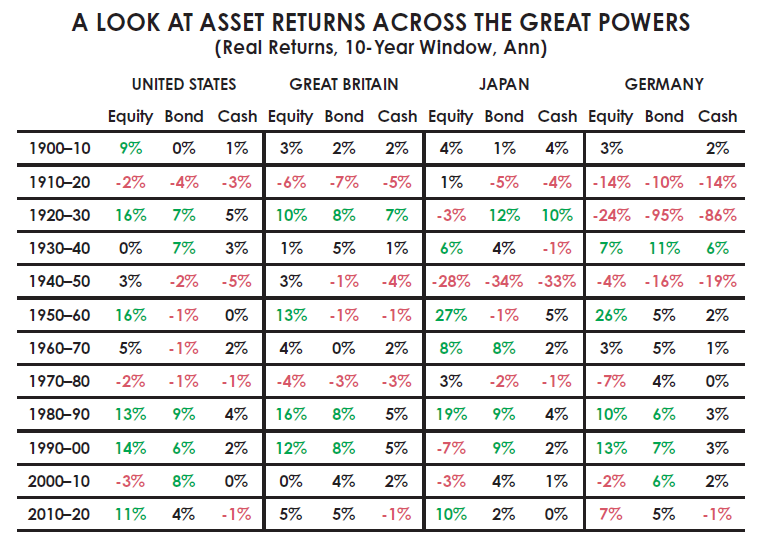
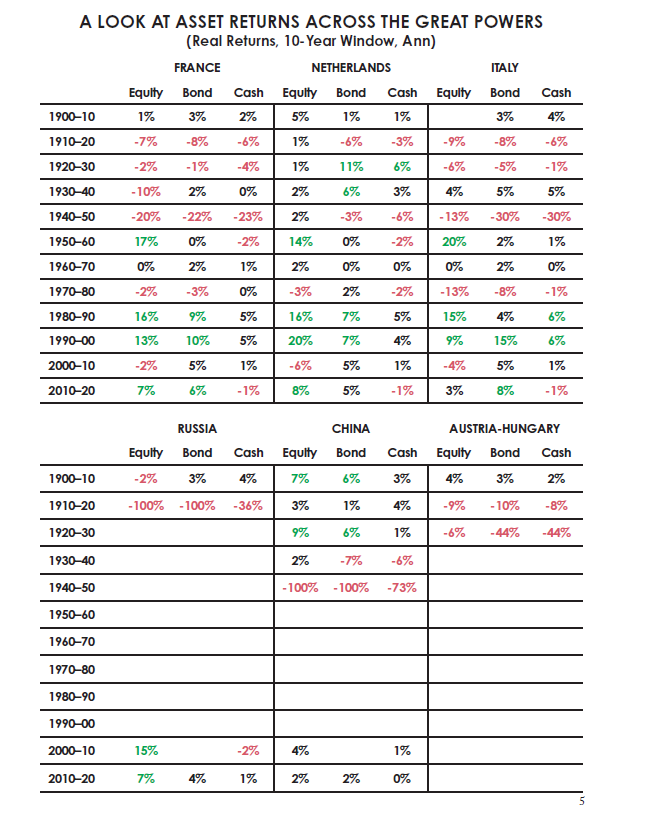
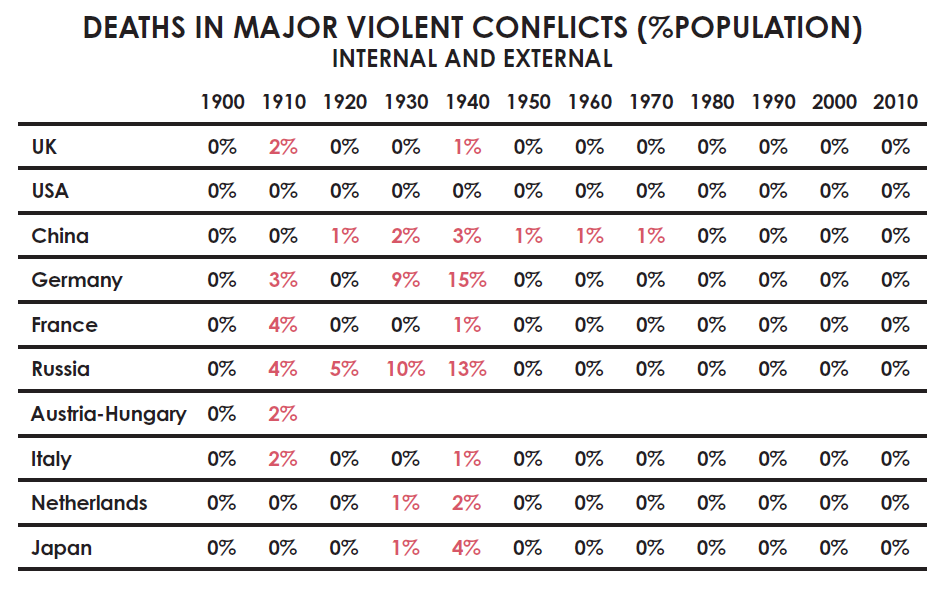
To gain perspective, I imagine being dropped into 1900 and observing my investment outcomes each decade thereafter. I chose to examine the 10 strongest countries in 1900, skipping poorer nations prone to worse outcomes. Any of these countries could have—or might have become—a great, wealthy empire; all were reasonable investment destinations, especially for those seeking diversified portfolios.
Seven of these 10 countries suffered near-total wealth destruction at least once. Even the three countries that avoided such destruction endured decades of terrible asset returns—nearly destroying them financially. Two great developed nations—Germany and Japan—countries many might easily bet on as winners—had nearly all their wealth destroyed in both world wars, along with countless lives. I observed similar outcomes in many other countries. The U.S. and U.K. (and a few others) were exceptional success stories—but even they endured periods of massive wealth destruction.
If I hadn’t examined returns prior to the new world order beginning in 1945, I wouldn’t have seen these destruction periods. If I hadn’t reviewed 500 years of global history, I wouldn’t have seen this recurring almost everywhere.
The numbers shown in the table below represent annualized real returns per decade—meaning total decade losses are roughly eight times the shown number, and gains roughly 15 times.
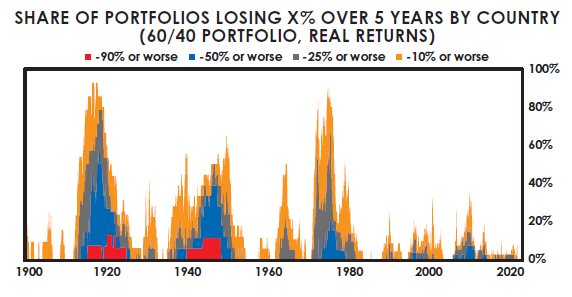
Perhaps the chart below provides clearer insight—it shows the proportion of major countries where holding a 60/40 stock/bond portfolio resulted in losses over five-year periods.
The table below details the worst-case investment outcomes across major countries. You’ll notice the U.S. doesn’t appear—because it wasn’t among the worst cases. The U.S., Canada, and Australia were the only countries that never experienced sustained loss periods.
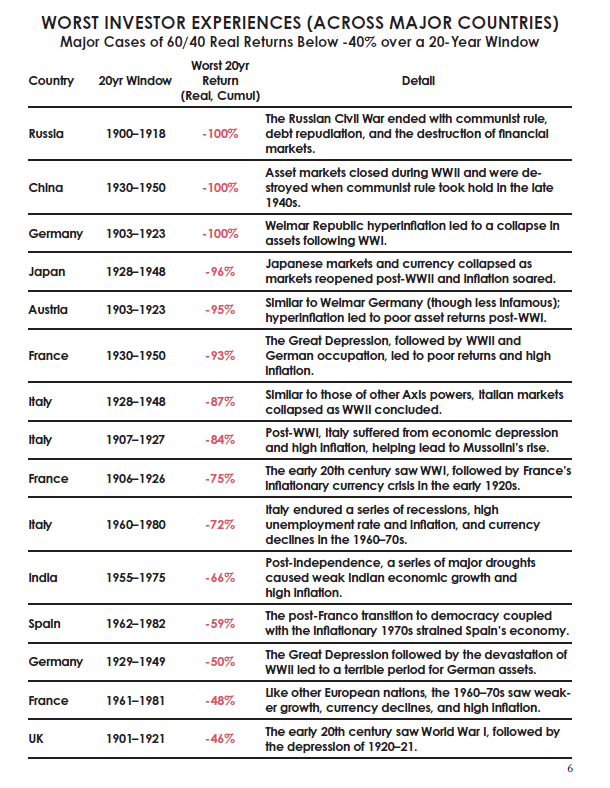
Naturally, I considered how I’d respond if living through those periods. I can say with certainty that—even if I’d spotted the warning signs I’m conveying in this book—I’d never have been confident predicting such catastrophic outcomes: as noted, seven of ten countries saw wealth wiped out. Even those looking back at the prior decades in the early 20th century couldn’t foresee this, given ample grounds for optimism based on the second half of the 19th century.
Today, people often assume World War I should have been easily predictable in the years preceding it—but it wasn’t. Before the war, the world’s major powers had experienced nearly 50 years of minimal conflict. During those 50 years, the world witnessed unprecedented innovation and productivity growth, yielding immense wealth and prosperity.
Globalization reached new heights: global exports multiplied several times in the 50 years before WWI. Nations were more interconnected than ever. The U.S., France, Germany, Japan, and Austria-Hungary were rapidly rising empires undergoing dizzying technological progress. Britain remained the dominant global power. Russia was industrializing rapidly.
Among the countries shown in the “worst investor experience” table, only China was clearly in decline. Strong alliances among European powers were then viewed as tools to maintain peace and balance power. Entering 1900, everything appeared rosy—except widening inequality and resentment, and mounting debt. Between 1900 and 1914, these conditions deteriorated, and international tensions escalated—leading to the horrific return periods I just described.
But the situation was worse than horrific returns.
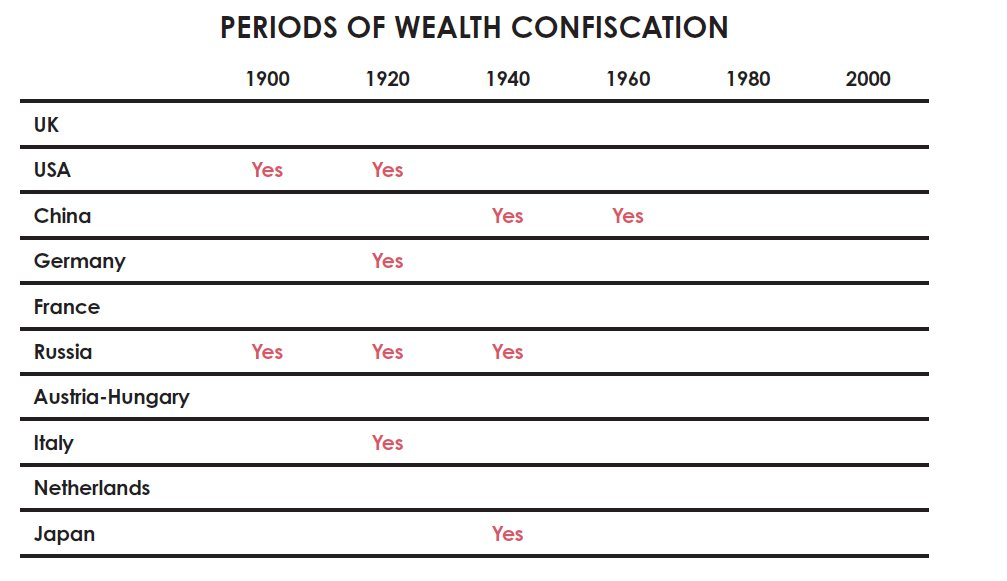
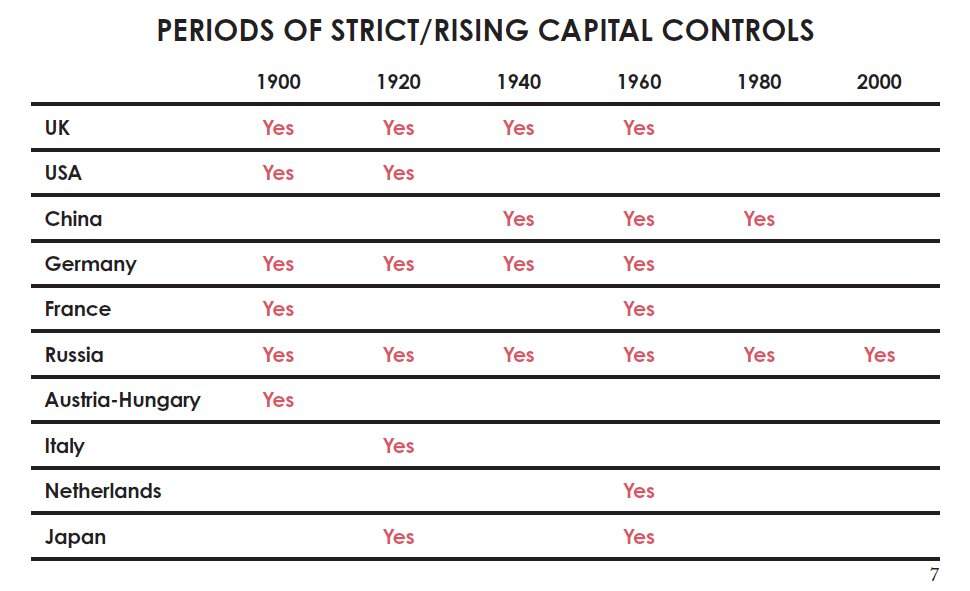
Moreover, wealth confiscation, confiscatory taxation, capital controls, and market closures profoundly impacted wealth. Most investors today know little about such events—and assume they’re impossible—because they don’t see them in recent decades. The table below shows which decades featured these events. Naturally, the most severe wealth confiscations occurred during periods of large inequality and worsening economic conditions—when domestic wealth struggles erupted—or during wartime.
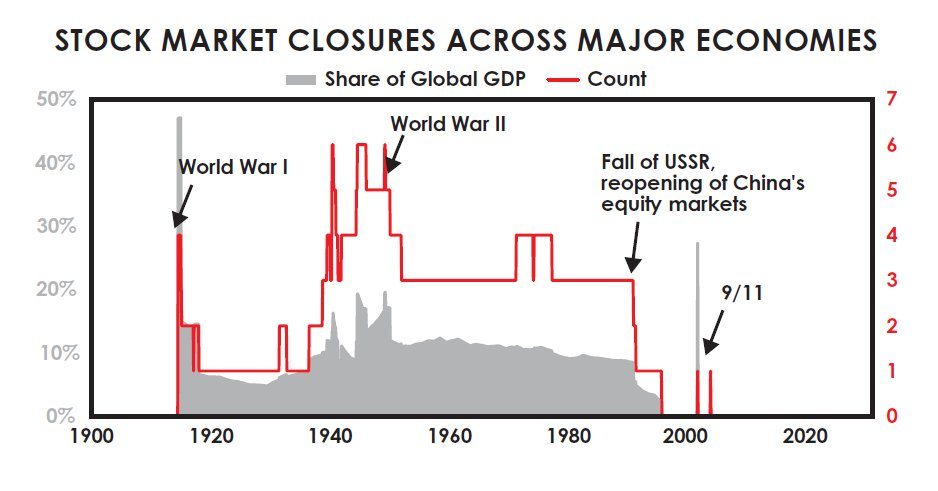
The next chart shows the proportion of major countries whose stock markets were closed over time. Stock market closures during wartime were common; communist countries, of course, closed their stock markets for over a generation.
The bad phases of all pre-1900 cycles were equally awful. Worse still, these internal and external struggles over wealth and power caused massive loss of life.
Even for investors lucky enough to reside in winning-war nations (e.g., the U.S., the biggest winner in both wars), two further headwinds existed: market timing and taxation.
Most investors sell near lows when conditions worsen—because they need money and panic—and buy near highs—because they have ample funds and get swept up in euphoria. This means their actual returns were worse than the market returns I’ve shown. A recent study found U.S. investors underperformed U.S. stocks by about 1.5 percentage points annually between 2000 and 2020.
Regarding taxation, the table below estimates the average tax impact on S&P 500 investors over all 20-year periods (using today’s top quintile income earners’ average tax rate across the analysis period). Different columns represent different U.S. stock market investment approaches—including tax-deferred retirement accounts (taxed only upon withdrawal) and holding physical stocks in regular brokerage accounts with annual dividend reinvestment.
Though these implementation methods carry different tax implications (retirement accounts having the smallest impact), all show significant effects—especially on real returns, where taxes can erode a substantial portion of returns. Over any given 20-year period, U.S. investors lost roughly one-quarter of their real stock returns to taxes, on average.
Reviewing the Big Capital Market Cycle
Earlier, I explained how the classic big debt and capital market cycle operates. To reiterate: during the upswing, debt increases, and financial wealth and obligations rise relative to tangible wealth—until those future payment promises (i.e., cash, bonds, and stocks’ values) become unsustainable.
This triggers “bank-run”-style debt problems, leading to money printing to ease debt defaults and stock-market declines—causing currency depreciation, declining financial wealth relative to real wealth—until financial assets’ real (inflation-adjusted) value becomes cheap relative to tangible wealth again. Then the cycle restarts.
This is a highly simplified description—but you get the idea: during the cycle’s downswing, financial assets deliver negative real returns relative to real assets, making times difficult. This is the anti-capital, anti-capitalist phase of the cycle—lasting until the opposite extreme is reached.
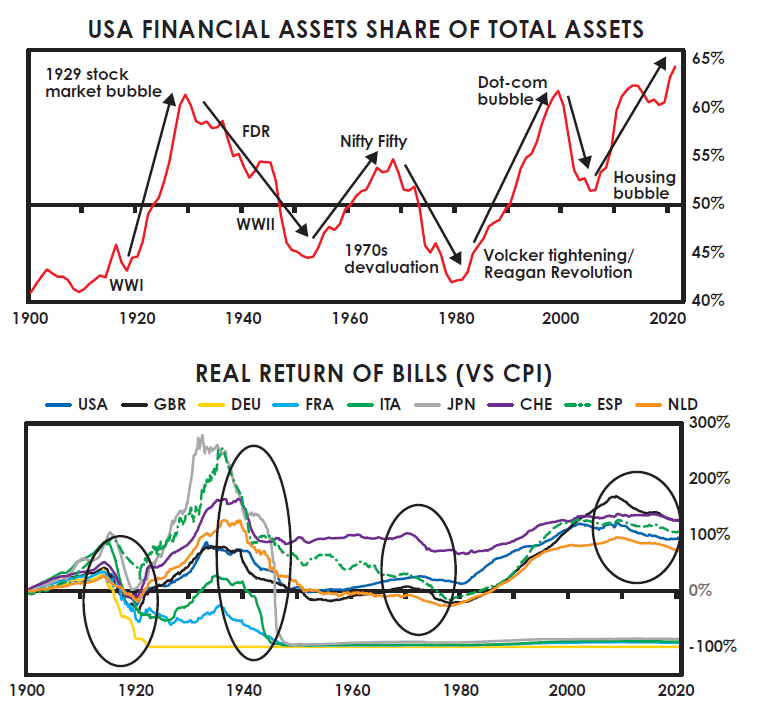
This cycle appears in the two charts below. The first shows total financial asset value relative to total real asset value. The second shows real (i.e., inflation-adjusted) returns on cash. I use U.S. data rather than global data because it’s the most continuous series since 1900. As you can see, when financial wealth is abundant relative to real wealth, it reverses—and real returns on financial wealth (especially cash and debt assets like bonds) suffer.
This occurs because debt holders’ interest rates and returns must remain low and poor to relieve over-indebted debtors—and to stimulate more debt growth to boost the economy. This is the classic late stage of the long-term debt cycle.
It occurs when more money is printed to ease debt burdens—and new debt is created to increase purchasing power. This devalues currency relative to other stores of wealth and goods/services.
Eventually, as financial asset values decline until cheap relative to real assets—reaching the opposite extreme and reversing—the cycle enters its upswing again, bringing peace and prosperity, and delivering excellent real returns on financial assets.
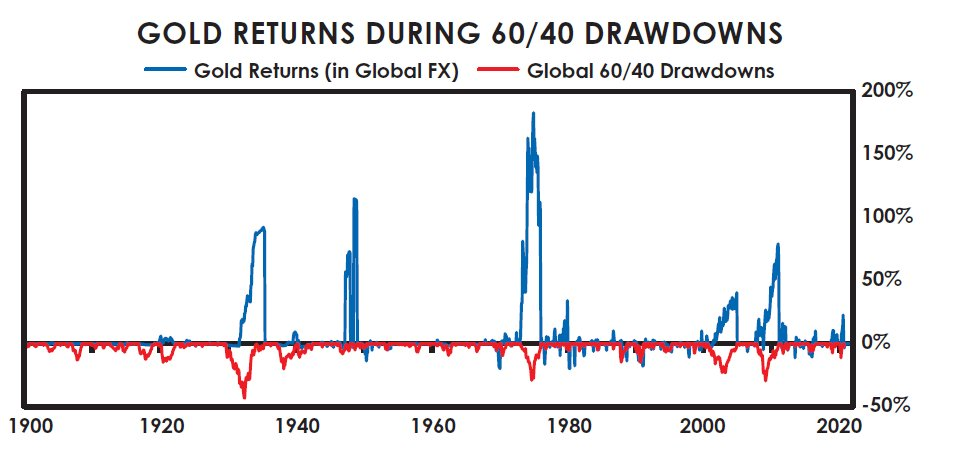
As noted earlier, during currency depreciation periods, hard money and hard assets appreciate relative to cash. For example, the next chart shows that periods when the classic 60/40 stock/bond portfolio declined coincided with rising gold prices. I’m not saying gold is a good or bad investment—I’m merely describing economic and market mechanics and how they manifested in past market moves and investment returns, aiming to share my perspective on what happened, what might happen, and why.
One of the most important questions investors must ask themselves regularly is: does the interest earned sufficiently compensate for the risk of depreciation?
The classic big debt/money/capital market cycle has repeated across history and geography, as shown in the charts I just presented, reflecting:
1) Physical/tangible money and physical/tangible wealth
versus 2) Financial money and financial wealth. Financial money and financial wealth are only valuable if they can be exchanged for real money and real wealth possessing actual (i.e., intrinsic) value.
These cycles always operate the same way: during the upswing, the quantity of financial money and financial wealth (i.e., created debt and equity assets) rises relative to the physical money and tangible wealth they represent.
This increase occurs because:
a) Capitalists engaged in creating and selling financial assets profit handsomely;
b) Increasing money, credit, and other capital market assets is an effective way for policymakers to generate prosperity, as it funds demand;
c) When financial investments’ book values rise due to falling money and debt-asset values, it creates an illusion of greater wealth. Thus, central governments and central banks have historically created far more financial claims than can be redeemed for real wealth and real money.
During the cycle’s upswing, as interest rates fall, stocks, bonds, and other investment assets rise—since lower rates push up asset prices, all else equal. Simultaneously, injecting more money into the system boosts demand for financial assets and lowers risk premiums.
When these investments rise due to falling rates and more money in the system, they appear more attractive simultaneously—while their interest rates and future expected returns decline.
The greater the outstanding claims relative to what’s claimed, the greater the risk. This should be compensated by higher interest rates—but usually isn’t, because conditions appear favorable and memories of debt and capital market crises have faded.
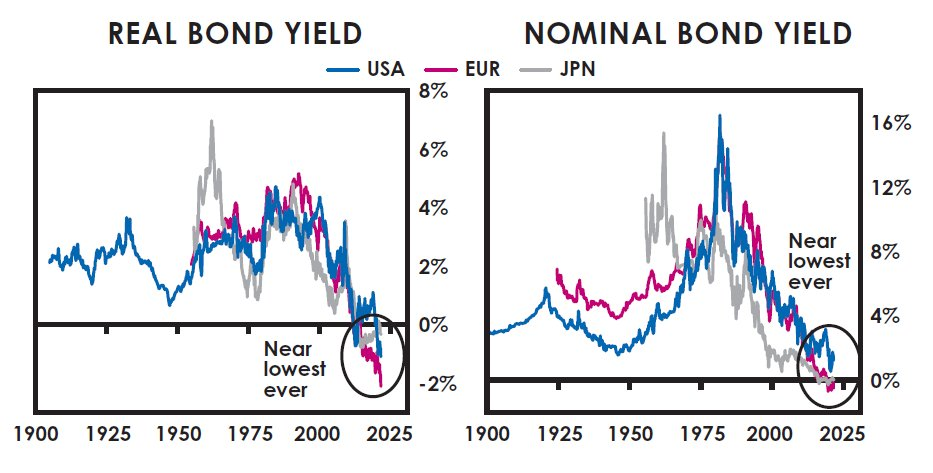
The charts I previously showed to illustrate the cycle aren’t complete without adding some interest-rate charts. These appear in the next four charts, tracing back to 1900. (Note: This chapter was originally published in 2021, and the following charts contain data only up to that year.)
They show U.S., European, and Japanese real (i.e., inflation-adjusted) bond yields, nominal (i.e., non-inflation-adjusted) bond yields, and nominal and real cash rates as of my writing. As you can see, they were once much higher—and are now very low.
At the time of writing, reserve-currency sovereign bonds’ real yields were near all-time lows, and nominal bond yields hovered around 0%—also near all-time lows. As shown, real cash yields were even lower—though not yet as negative as during the heavy money-printing periods of 1930–45 and 1915–20. Nominal cash yields were also near all-time lows.
What does this mean for investing? Investing aims to place money in a store of wealth that can later be converted into purchasing power. When people invest, they exchange an upfront payment for future payments.
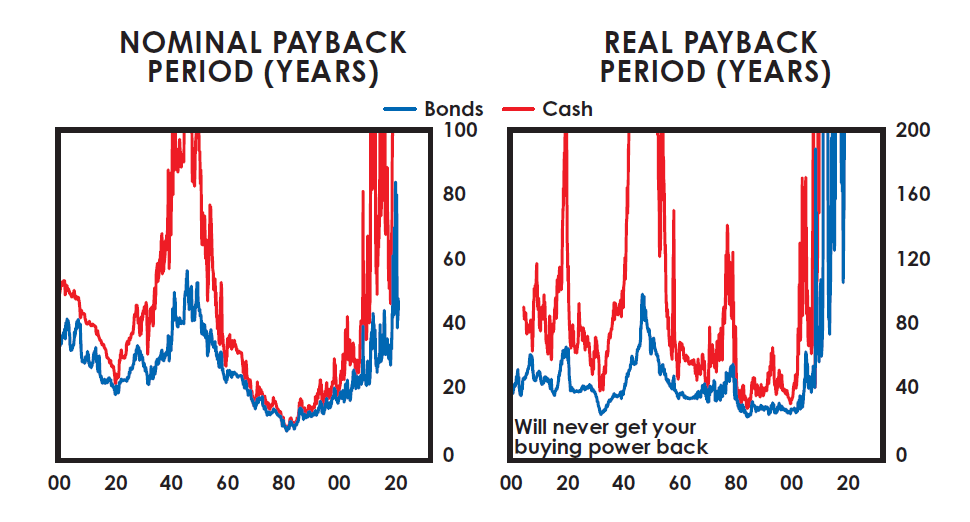
Let’s examine what that trade looks like as of this writing. If you give $100 today, how many years must you wait to get your $100 back—before earning any return on your initial capital? For bonds in the U.S., Japan, China, and Europe, you might wait roughly 45, 150, and 30 years respectively—just to recoup your principal (likely with low or zero nominal returns), and in Europe, you’ll likely never recoup it, given negative nominal rates.
Yet since you’re trying to preserve purchasing power, you must account for inflation. At the time of writing, in the U.S. and Europe, you’ll likely never recover your purchasing power (in Japan, it would take over 250 years). In fact, in countries with negative real interest rates, you’ll almost certainly hold far less purchasing power in the future.
Why accept returns below inflation—when you could buy something—anything—whose value equals or exceeds inflation? I see many investments I expect to significantly outperform inflation. The chart below shows the recovery periods for holding cash and bonds in the U.S., in nominal and real terms. As shown, this is the longest such period on record—clearly an absurd duration.
Conclusion
What I’ve shown you here is the Big Cycle from an investor’s perspective since 1900. Reviewing 500 years of global history—and 1,400 years of Chinese history—I see essentially the same cycle recurring for essentially the same reasons.
As discussed earlier in the book, the horrific periods before the new world order established in 1945 are typical late-stage features of the Big Cycle’s transitional phase—when revolutionary change and restructuring are underway. Though terrifying, they’re far worse than the astonishing upswings that emerge after the painful transition from old to new order. Because these events have occurred many times before—and because I cannot predict what will happen next—I cannot invest without protective measures guarding against their occurrence and my own judgment errors.
Footnotes
[1] The discount rate is the interest rate used to assess the present value of a future sum. It is calculated by comparing how much money invested today at that rate (i.e., the discount rate) would grow to equal a specific amount at a future point in time.
[2] If a government and its system collapse, non-governmental forces take over—an additional story I won’t explore here.
[3] You can observe this alchemy operating today in the form of cryptocurrencies.
[4] When compounded over a decade, gains exceed losses because you continuously compound on gains; whereas when losses bring you close to zero, subsequent percentage losses diminish in dollar impact. The comparison of annualized gains versus losses represents compounding from an average 10% annualized gain and -5% annualized loss. Multipliers change further with more extreme variations.
[5] For China and Russia, pre-1950 bond data are modeled using hard-currency bond returns, assumed hedged back to local currency by domestic investors; stocks and bonds are modeled as fully defaulted at revolution. Annualized returns assume full 10-year periods—even if markets closed during that decade.
[6] Poor asset-return cases for smaller countries (e.g., Belgium, Greece, New Zealand, Norway, Sweden, Switzerland) and emerging markets are excluded from this table. Note: For brevity, only the worst 20-year window per country/period is shown (e.g., Germany 1903–23 excludes Germany 1915–35). For our 60/40 portfolio, monthly rebalancing is assumed within each 20-year window.
[7] Though this chart isn’t exhaustive, I list instances where clear evidence exists for each event occurring within a 20-year period. In this analysis, wealth confiscation is defined as large-scale seizure of private assets—including non-economic forced sales conducted on a large scale by governments (or revolutionaries in revolutionary contexts). Related capital controls are defined as meaningful restrictions on investors moving funds into or out of other countries and assets (though this excludes targeted measures against a single country, such as sanctions).
[8] Tax impacts for 401(k)-style accounts are calculated at a 26% income tax rate (the Congressional Budget Office’s 2017 average effective rate for the top quintile of federal taxpayers) at the end of each 20-year investment period (i.e., tax-free investment growth). Brokerage-account treatment separately taxes dividends (at the same 26% income tax rate) and capital gains, taxing all capital gains on principal and reinvested dividends at a 20% rate at the end of each 20-year investment period—and offsets gains with losses.
[9] Based on the August 2021 30-year nominal bond yield level (treated as a perpetuity).
Join TechFlow official community to stay tuned
Telegram:https://t.me/TechFlowDaily
X (Twitter):https://x.com/TechFlowPost
X (Twitter) EN:https://x.com/BlockFlow_News


