Reviewing the Fed's 10-Year Interest Rate Cycle: Where Is Bitcoin Headed Under Three Scenarios?
TechFlow Selected TechFlow Selected
Reviewing the Fed's 10-Year Interest Rate Cycle: Where Is Bitcoin Headed Under Three Scenarios?
While reducing your position, you might as well keep a glimmer of hope.
 Navigating Web3 tides with focused insights
Author: Biteye
Over the past decade, Bitcoin's bull peaks and bear bottoms have mirrored Federal Reserve interest rate policy.
-
Peaks often occur when expectations for rate hikes are strongest
-
Bottoms typically coincide with a shift toward anticipated rate cuts
The market now stands at a crossroads of three possible paths:
-
Rate hikes resume → Double bottom formation?
-
Rate cuts in second half → Volatile rebound followed by peak?
-
Mid-year rate cuts → Bull market acceleration?
These scenarios will determine Bitcoin’s next move.
This article breaks down BTC price movements under each scenario, offering a clear view of the interplay between macroeconomics and price dynamics.
1. A 10-Year Review: How Has Bitcoin’s “Top” and “Bottom” Responded to Fed Rate Policy?
Over the past decade (approximately 2015–2025), the Federal Reserve has gone through full cycles of tightening, easing, re-tightening, and pausing. Analyzing this history reveals intriguing correlations between Bitcoin price turning points and key Fed policy moments—especially the market’s tendency to "front-run" policy shifts.
Key conclusions:
1. Bitcoin bull market tops tend to precede the start or acceleration of rate hikes, as markets price in tightening expectations early.
2. Bear market bottoms usually form during the later stages of hiking cycles, during pauses, or just before rate cuts begin—when sentiment is most pessimistic or hopes for looser policy emerge.
3. Quantitative easing (QE) or aggressive rate cuts (“flooding the system”) act as major catalysts for bull markets.
Below is a comparative timeline of major Fed rate moves over the last decade alongside key Bitcoin price movements:
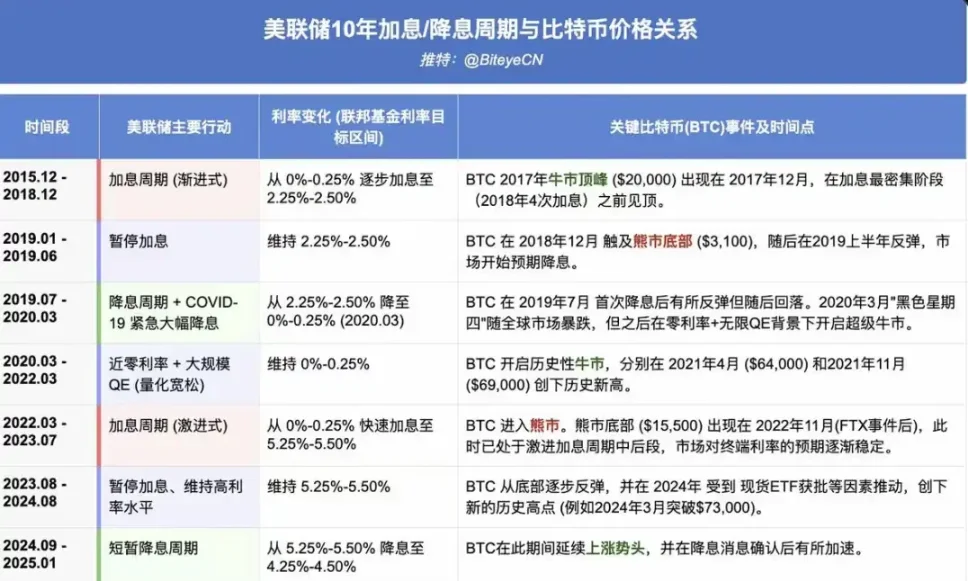
This chart clearly illustrates the timing relationship—or lag—between Bitcoin’s key inflection points and the Fed’s policy cycle. Whether in 2017 or 2021, bull market peaks occurred before rate hikes were fully underway or at their most aggressive phase. Bear market bottoms, meanwhile, consistently coincided with growing expectations of rate cuts.
The current environment features a paused hiking cycle and brief rate cuts—a plateau period where the market awaits a clear directional signal: whether further cuts will materialize, potentially ushering in another round of QE-style liquidity expansion.
2. Interest Rate Scenarios: Three Possible Paths Based on Institutional Forecasts
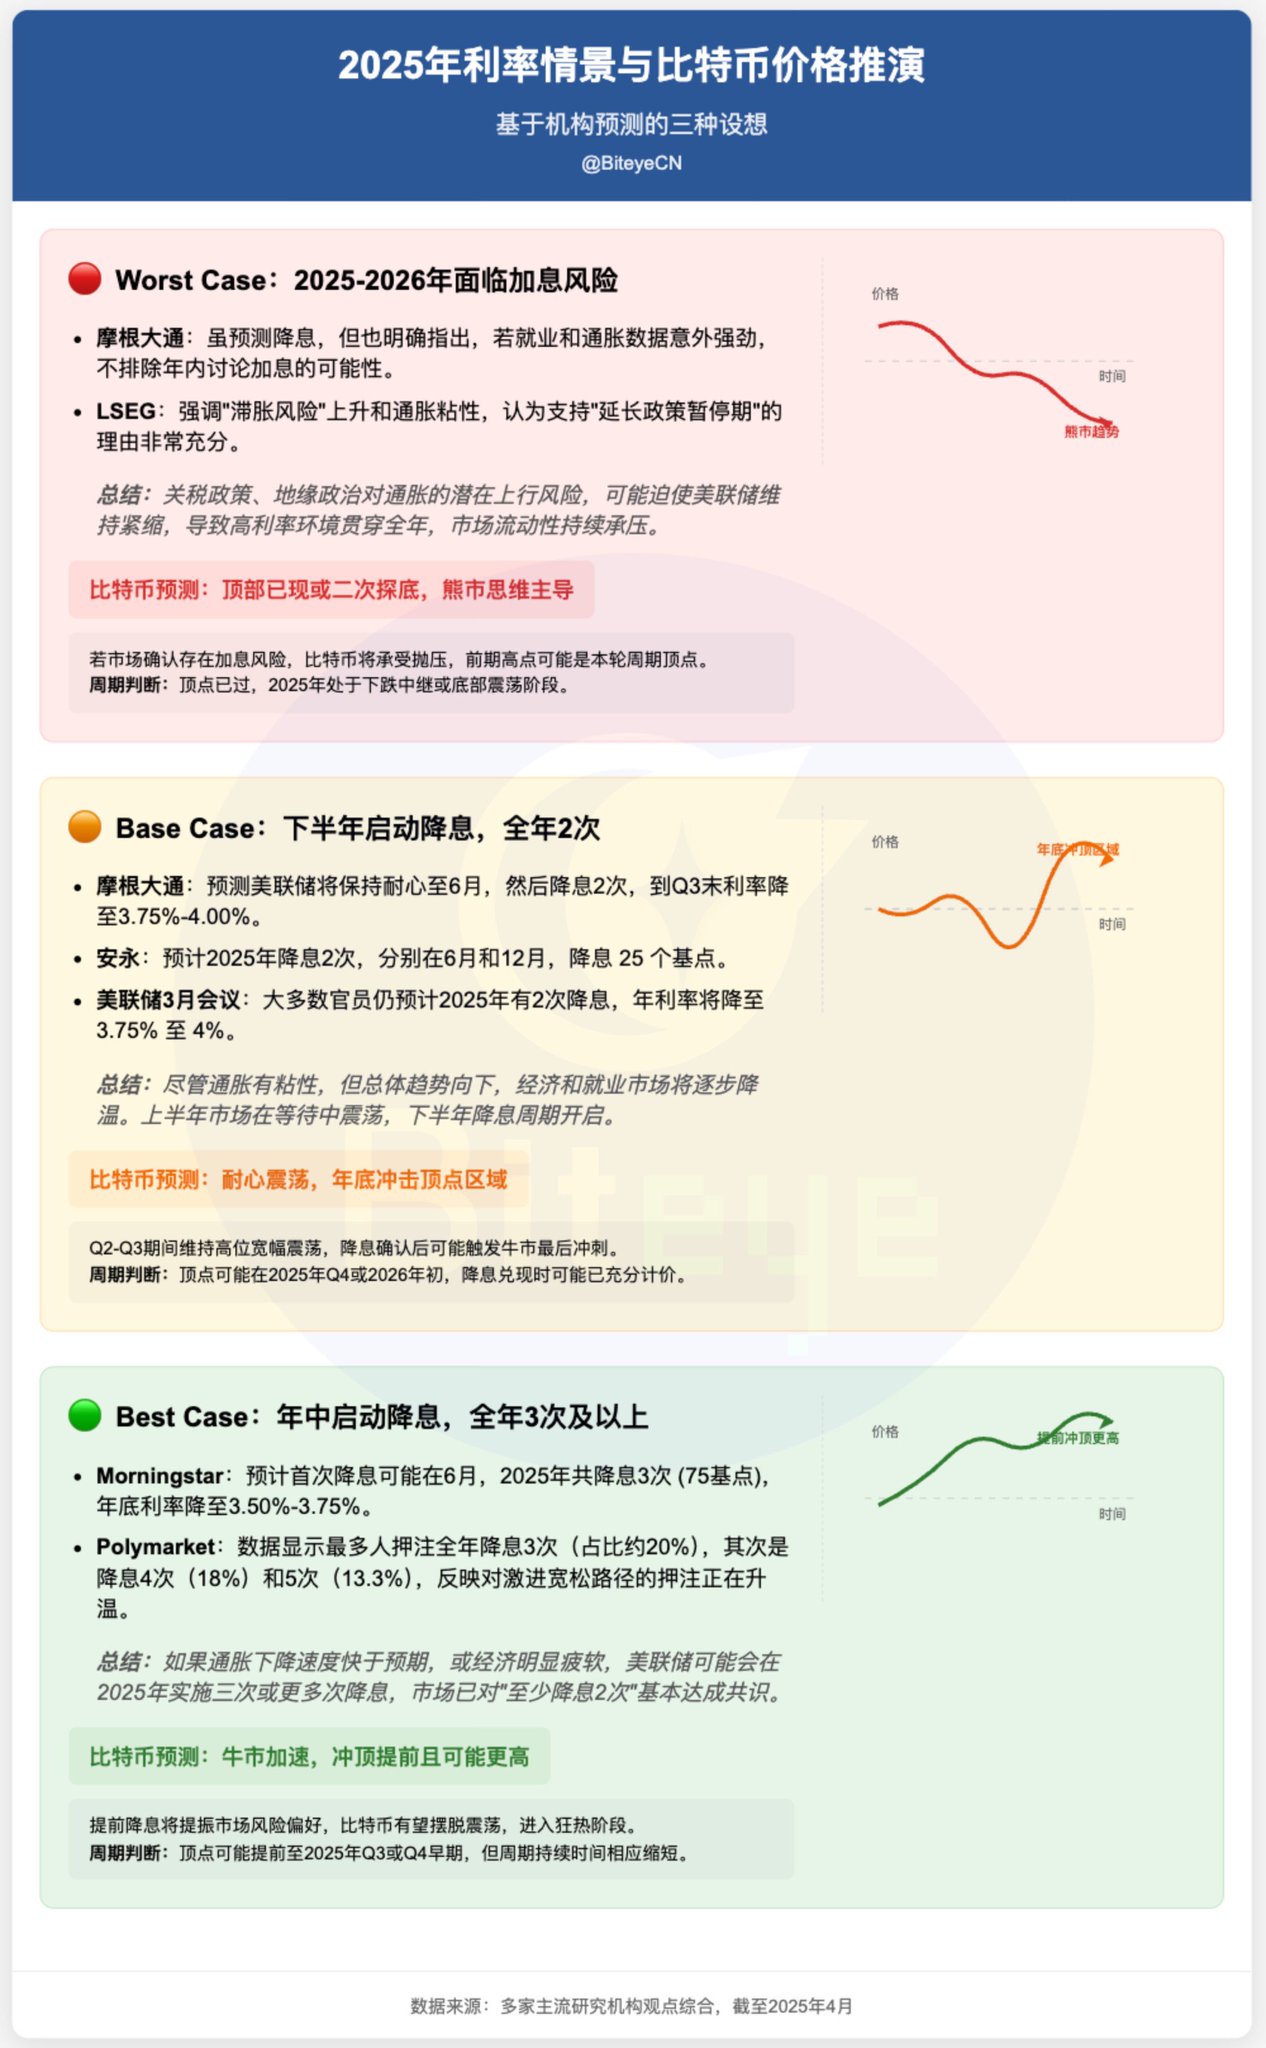
As of April 2025, opinions diverge sharply on the Fed’s next move. Drawing from recent reports by major research institutions, we outline three plausible scenarios:
1. Worst Case: Risk of Rate Hikes Returns in 2025–2026
-
J.P. Morgan (early March report): While forecasting rate cuts, JPM explicitly noted that stronger-than-expected employment and inflation data could prompt discussions about rate hikes within the year.
-
LSEG (London Stock Exchange Group, early April report): Highlighted rising stagflation risks and persistent inflation, arguing strongly for an extended pause in any easing.
Tariff policies and geopolitical factors pose upside risks to inflation, potentially forcing the Fed to maintain tight monetary conditions, prolonging high rates and keeping pressure on market liquidity throughout the year.
2. Base Case: Rate Cuts Begin in Second Half, Two Cuts Expected in 2025
-
J.P. Morgan (early March report): Predicts the Fed remains patient until June, then implements two 25-basis-point cuts, bringing rates to 3.75%–4.00% by end of Q3.
-
EY (Ernst & Young, March report): Expects two 25-basis-point cuts—in June and December—bringing the fed funds rate down by 50 basis points total.
-
Federal Reserve March meeting: Most officials still project two rate cuts in 2025, with the target rate ending the year between 3.75% and 4.00%.
These views assume that while inflation remains sticky, its overall trajectory is downward, and both the economy and labor market will gradually cool. The first half sees range-bound volatility; the easing cycle begins in the second half.
3. Best Case: Mid-Year Rate Cuts Begin, Three or More Cuts in 2025
-
Morningstar (March 28 report): Projects the first cut in June, with three 25-basis-point reductions totaling 75 basis points in 2025, ending the year with rates at 3.50%–3.75%.
-
Plymarket: According to Polymarket data, the most popular bet is for three rate cuts (75 basis points), accounting for ~20%. Bets on four (100 bps) and five (125 bps) cuts follow at 18% and 13.3%, respectively—indicating rising market appetite for aggressive easing. Meanwhile, the once-dominant “only two cuts” scenario has fallen to around 13%. Overall, there’s broad consensus that at least two cuts will happen in 2025, but significant disagreement remains on whether a more forceful easing cycle lies ahead—the outlook is still unanchored.
These perspectives suggest that if inflation falls faster than expected or the economy weakens significantly, the Fed may deliver three or more rate cuts in 2025.
3. Bitcoin Price Outlook: How Will BTC Perform Under Each Scenario?
Based on these three plausible interest rate paths, here's how Bitcoin’s price trajectory could unfold:
1. Worst Case (Risk of Rate Hikes in 2025–2026): Peak Already In or Double Bottom Ahead, Bearish Sentiment Dominates
Price outlook: If the market prices in renewed rate hike risk, Bitcoin is likely to face selling pressure starting in Q2 2025 and beyond. Previous highs may already mark the cycle top. Investor sentiment would turn negative, potentially triggering deep corrections, testing critical support levels, and even opening the door to a double bottom formation.
Cycle peak assessment: The peak is likely already behind us. 2025 will probably be spent in a downtrend or consolidating near cycle lows.
2. Base Case (Rate Cuts Start in Second Half, Two Cuts Total): Choppy Patience, Year-End Run Toward Peak Zone
Price outlook: During Q2–Q3, as markets await confirmation of rate cuts, Bitcoin is likely to trade in a wide sideways range, with sentiment fluctuating on incoming data. Once rate cuts are confirmed and initiated in late Q3 or Q4, it could spark the final bullish surge—an “express train” driven by sentiment and liquidity expectations.
Cycle peak assessment: Likely in Q4 2025 or early 2026, aligning with some halving-cycle models. However, by the time rate cuts are officially implemented, the market may have already priced them in, possibly leading to a “sell the news” pullback. The actual price peak may occur when rate-cut expectations are strongest but not yet fully realized.
3. Best Case (Mid-Year Rate Cuts, Three or More Cuts): Bull Market Acceleration, Earlier and Potentially Higher Peak
Price outlook: An unexpected economic downturn forcing earlier Fed easing would dramatically boost risk appetite. Bitcoin could quickly break out of consolidation and launch a powerful rally, pushing the broader crypto market into euphoric territory.
Cycle peak assessment: Could arrive as early as Q3 or early Q4 2025. Earlier liquidity injection may drive prices higher, though the overall bull cycle duration might be shortened.
4. Conclusion
Fed rate decisions remain the anchor of global asset pricing—especially for highly volatile assets like Bitcoin. Even though investors joke today about being “numb to drops,” the market remains at a pivotal juncture of shifting expectations. While reducing exposure may be prudent, there’s still room to hold onto a sliver of hope.
Join TechFlow official community to stay tuned
Telegram:https://t.me/TechFlowDaily
X (Twitter):https://x.com/TechFlowPost
X (Twitter) EN:https://x.com/BlockFlow_News
 @BiteyeCN