

Artificially Created Economic Recession: Industry Trends and Market Insights in Cyclical Shifts
TechFlow Selected TechFlow Selected
Artificially Created Economic Recession: Industry Trends and Market Insights in Cyclical Shifts
We are undergoing a transformation of systems or environments, and this adjustment period may merely be a market correction and economic contraction.
Author: Doug O'Laughlin
Translation: TechFlow
Apologies for disappearing recently. I’ve just finished relocating to New York City, while also dealing with some health issues. One update to share: I’ll be taking a week off starting March 27 to recover from an outpatient procedure. But for now, let’s dive into the matter at hand.
The market is rapidly repricing for an impending recession, partly due to Trump administration policies and significant pressure on the dollar. I'll offer a casual macroeconomic summary, then discuss the semiconductor industry and areas I’m focused on. Let’s start broad and then go deeper.
"Manufactured" Recession and the 10-Year Treasury Yield
Recent commentary suggests that, compared to stock market levels, the current government places greater emphasis on the 10-year Treasury yield—a shift from past strategies like so-called “Trump puts.” The term “transition period” has been repeatedly mentioned in interviews on Fox News, indicating a pivot in focus from equity performance to bond market signals.
The key metric here is the 10-year Treasury yield. This represents the interest rate the U.S. government pays when borrowing money. Lowering this critical rate can improve housing affordability or boost consumer auto purchasing power. However, “managing” the 10-year yield isn’t as direct as adjusting policy rates. Policy rates refer primarily to the overnight interbank lending rate set by the Federal Reserve, whereas the 10-year Treasury price is determined through auctions to investors willing to buy government debt—making it a market-driven price.
The issue is: the 10-year yield isn’t an exact science. No one truly knows how the 10-year moves; its price is set by trading and is believed to reflect expectations for inflation and real GDP growth in the issuing country.
This presents a challenge. Tariffs may create short-term inflationary pressures, but if the 10-year yield falls to 3% (as some, like Bessent, have predicted), it could signal deteriorating expectations for real growth. In such a scenario, the market might view a recession as a necessary correction.
This is exactly what the market is currently pricing in. Below are the yield curves from a month ago and today. Notably, the short end of the curve has started to decline. This means the market is rapidly pricing in lower short-term rates and a lower federal funds rate. In this context, the drop may not reflect falling inflation, but rather economic weakness and the belief that the Fed is cutting rates too slowly.
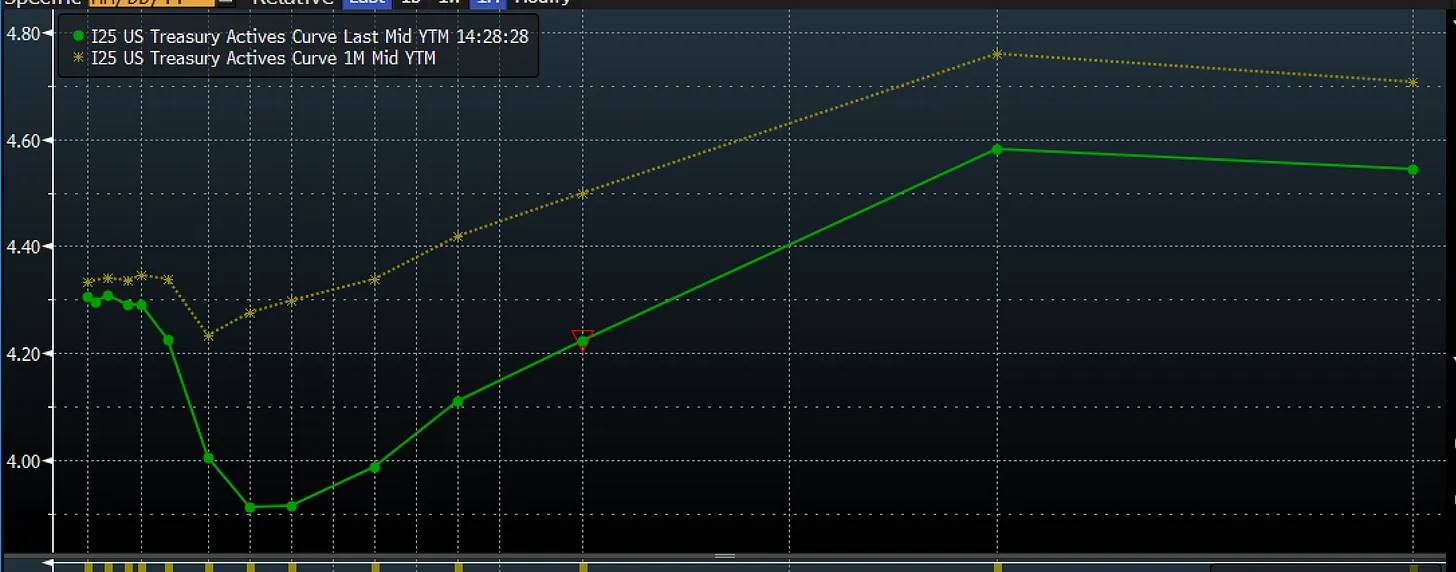
Source: Bloomberg
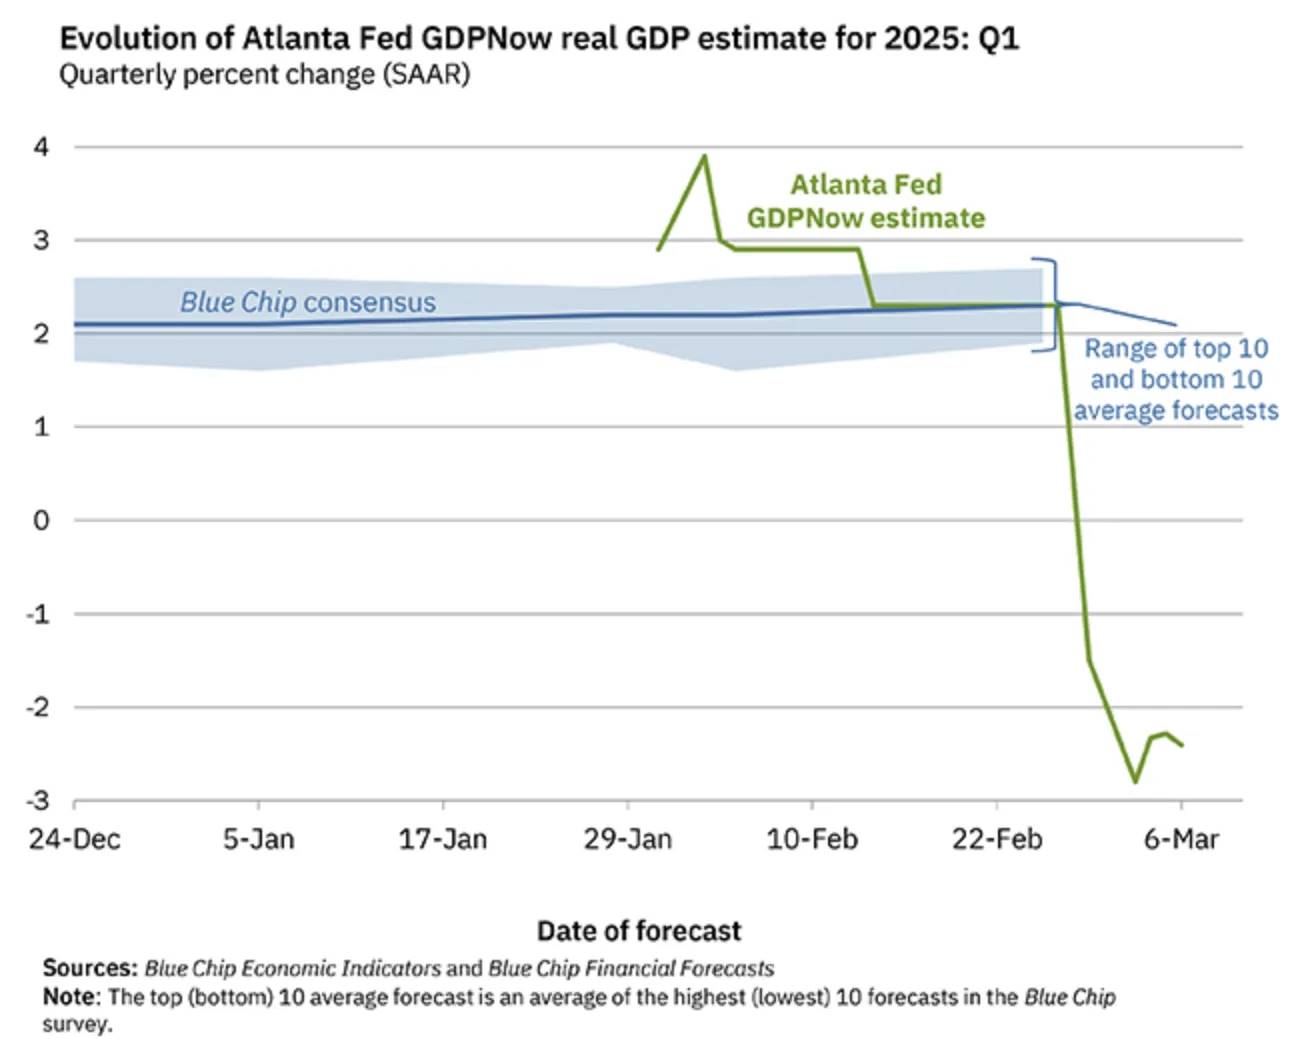
We’re living this in real time. GDPNow—a real-time economic forecasting tool—now predicts a sharp contraction in Q1 GDP. There are technical reasons behind this, but the overall trend remains weakening.
A major factor is the impact of net imports on GDP calculations. Net imports are subtracted in GDP accounting, which reflects a pre-emptive reaction to tariffs. But beneath this surface effect, the broader economy is weakening across the board. The chart above shows changing trends in growth contributions and their estimates. Imports are dragging significantly, but more importantly, the pace of change across most other categories is deteriorating.
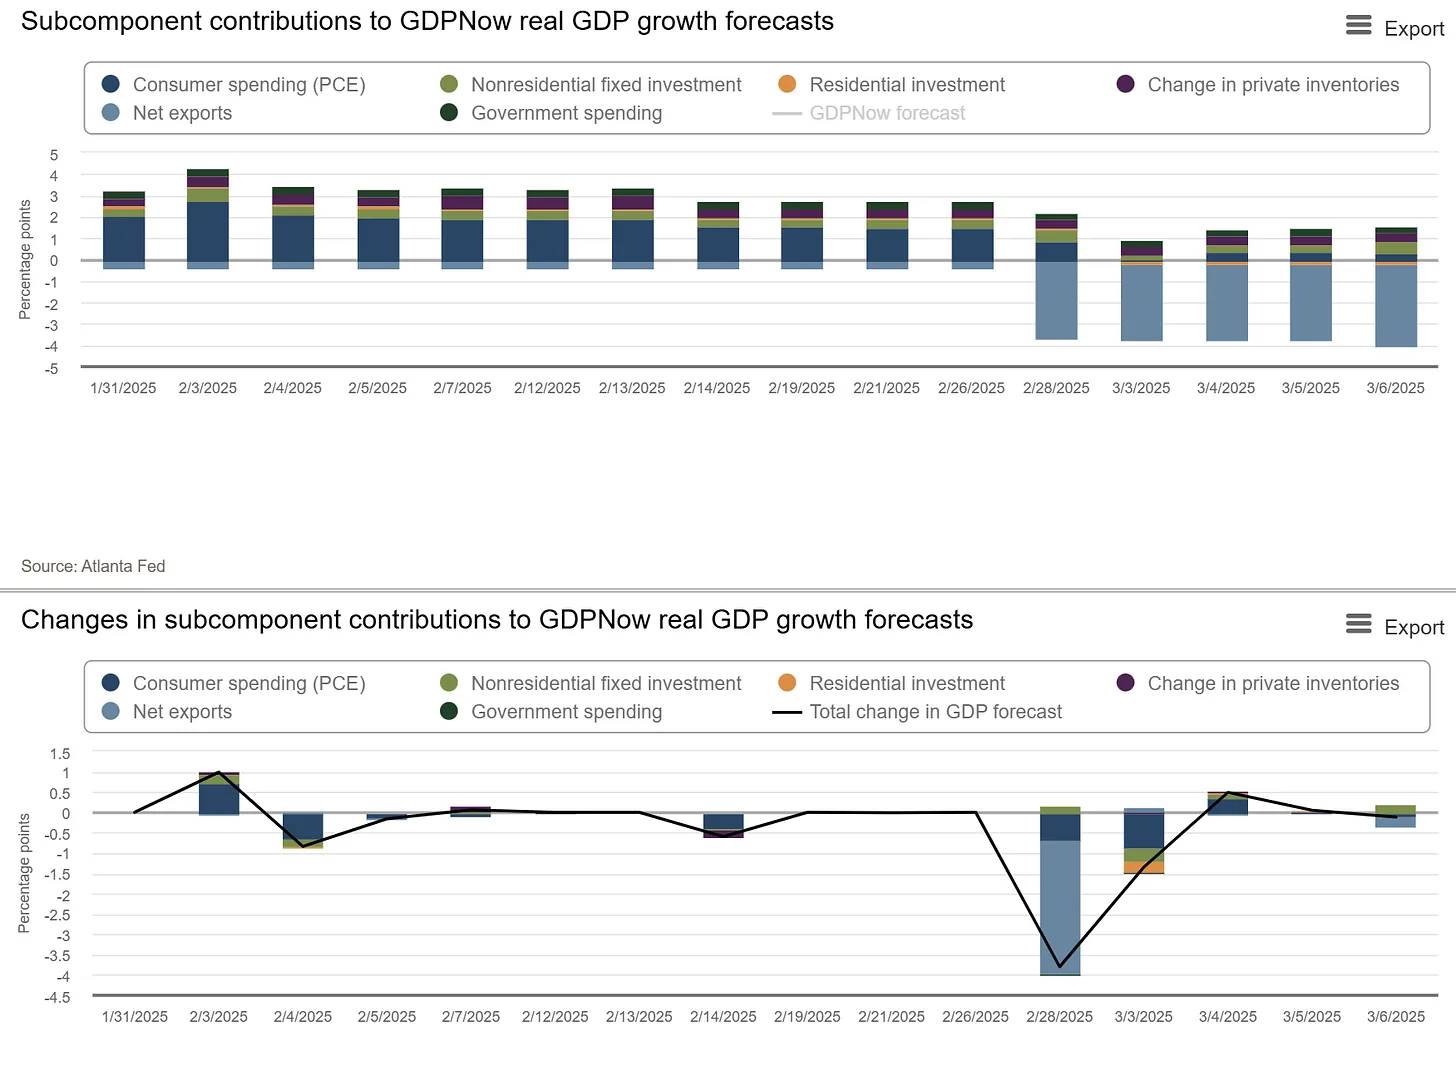
Source: GDPNow
The second chart further highlights weakening imports, along with declining residential investment, government spending (as expected), and consumer spending. The situation resembles Q2 2022, when the economy contracted amid a sharp inventory drawdown.
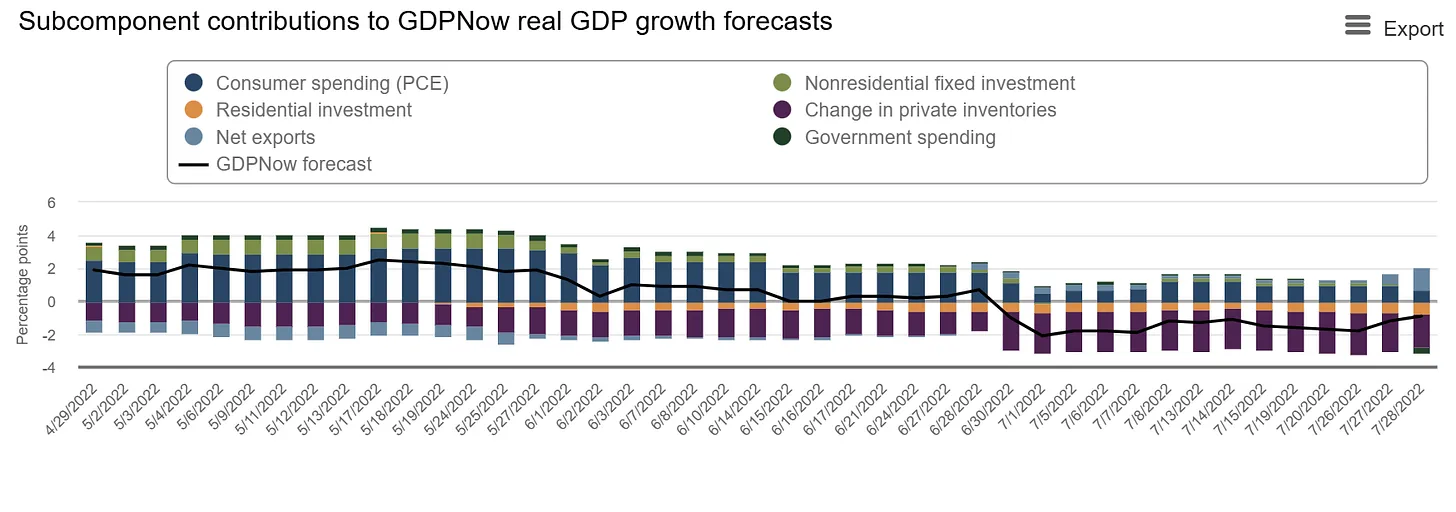
That situation reversed quickly afterward as inventories normalized. So will this preemptive tariff effect rebound swiftly—like post-pandemic inventory adjustments—or trigger a downward spiral in consumer and business confidence?
The concern is that consumer confidence is already beginning to fall, and leading indicators such as the Consumer Confidence Index and the Leading Economic Index are also declining. More worrying still, this decline is accelerating. Most economic and consumption data appear to point toward further weakness and uncertainty.
The yield curve reflects signs of economic weakness amid import surges, declining consumer sentiment, and the possibility of a technical recession. Expectations of weakness create reflexive effects—seeing weakness prompts people to save more. Trump’s use of the term “transition period” is notable, but such language rarely bodes well in markets.
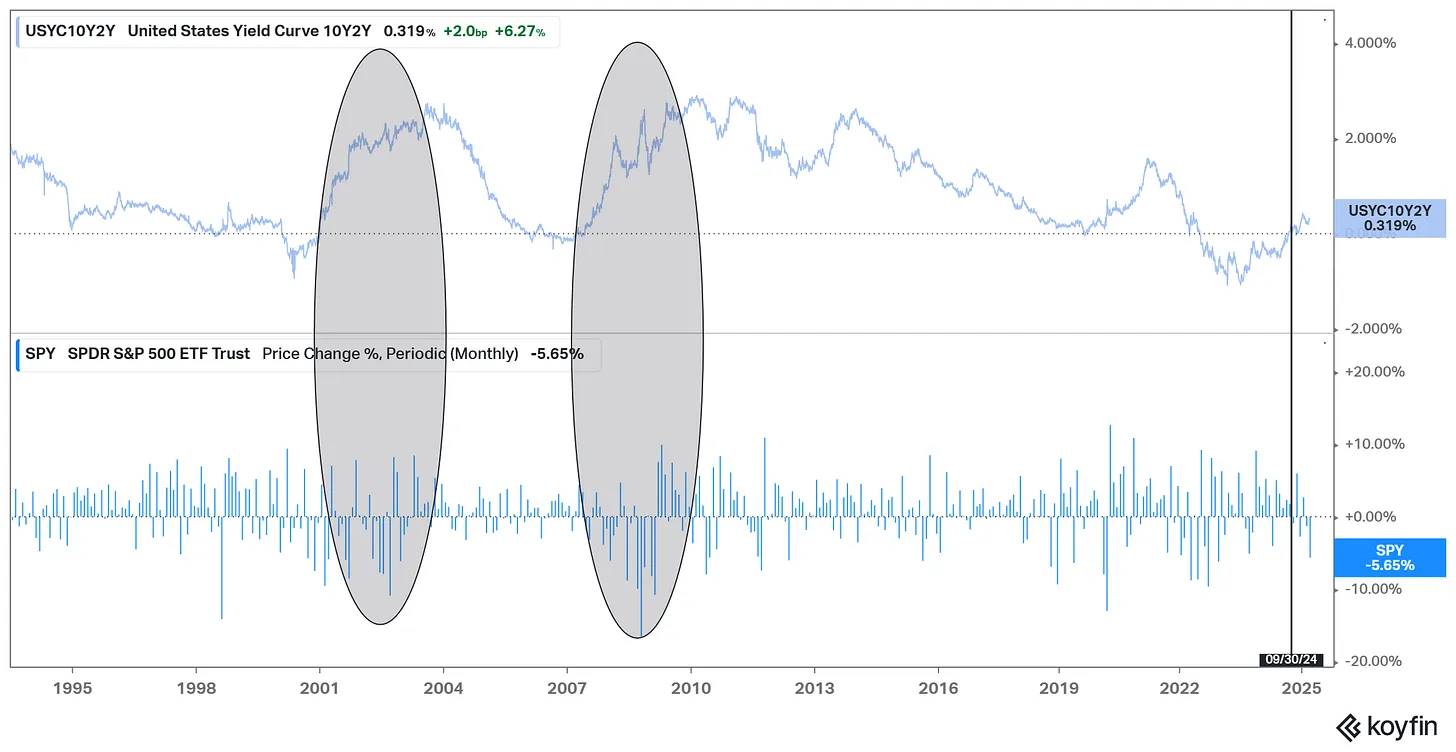
The timing is delicate. The yield curve has just normalized—and this moment almost always marks the beginning of pain. When the curve steepens, pullbacks or recessions tend to begin. In other words, an inverted yield curve typically precedes recession, while a normalizing curve often coincides with the onset of recession and negative impacts on equities. We are now seeing the yield curve reverse from its inversion in late September last year.
Source: Koyfin
We are now entering the painful phase. Another critical factor is tariffs and uncertainty, since in economics, uncertainty is nearly synonymous with volatility. When we don’t know whether tariff rates will be 10%, 20%, or 25%, decision-making becomes harder. Yet, the overarching theme remains trade.
Trade Deficit and Capital Flows
The U.S. has long run large trade deficits, meaning it imports more than it exports. But these dollars don’t vanish—they are transferred abroad as payment for goods and services. These foreign-held dollars typically flow back into U.S. financial markets through investment. Thus, trade deficits are accompanied by capital inflows that help finance purchases of American assets.
This creates a natural impetus for dollars accumulated via trade deficits to be reinvested in U.S. assets. Think of it as a self-replenishing inflow of dollars driven by trade.
However, Trump’s policies explicitly target trade through tariffs. Tariffs naturally raise consumer prices, reduce trade volumes, and, if high enough, shrink the trade deficit. This reduces the volume of dollars flowing back into the U.S., creating a more adverse effect on asset prices—capital outflows.
Higher tariffs mean fewer dollars accumulating abroad, and fewer dollars mean reduced foreign demand for U.S. assets. For example, a large Japanese conglomerate with a U.S. trade surplus may scale back its purchases of U.S. Treasuries and other assets due to reduced business activity. Given that foreign investors hold 24% of U.S. Treasuries and are now facing capital outflows during major auctions, diminished foreign demand could push up the 10-year yield. This is a highly precarious situation.
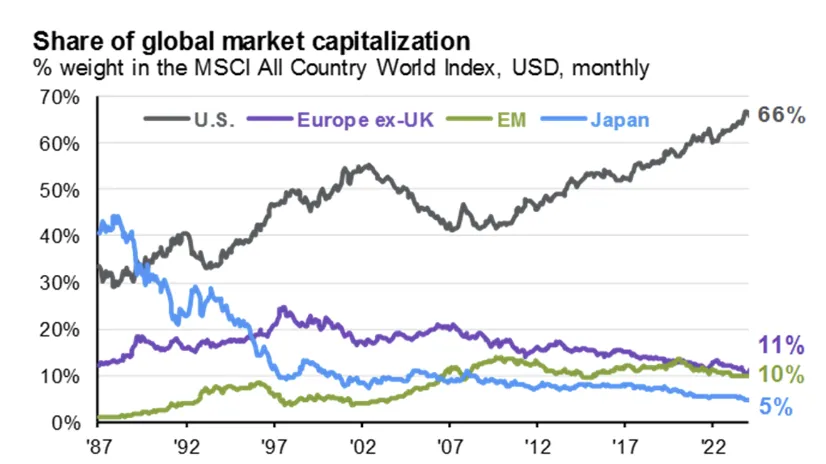
As the U.S. raises tariffs and adopts a hostile stance toward global trade, it risks triggering a natural outflow of capital, prompting foreign entities to exit U.S. assets. After decades of trade deficits acting as a steady source of capital inflows, this mechanism could unravel—and potentially spin out of control. The following chart on U.S. share of global market cap has been widely discussed—now, tariffs may represent a way to actively block that inflow.
Source: JPMorgan Guide to Markets
Another source of uncertainty is that the “West” is no longer as unified. The Financial Times is questioning the strength of the transatlantic relationship. Holding assets in an ally’s financial markets makes sense—but only if they remain strong allies. As the U.S. withdraws and implements reciprocal tariffs akin to Smoot-Hawley (effectively unilateral measures that evolve into bilateral tariff wars with Canada), it’s hard to argue the alliance remains solid.
Fractures in trade mean fractures in alliances. And as this continues, capital will flee. A retaliatory U.S. government may push European trade toward China—the world’s largest manufacturing base. The old world order is at risk, and placing all bets on America no longer seems wise. So where will capital go? For now, Europe appears to be the biggest beneficiary.
The Reversal of Roles Between the U.S. and Europe
An ironic pattern is emerging: the U.S. and EU are oddly switching roles. Fueled by a wave of AI investment announcements and new potential defense spending plans, Europe is doing something long neglected—running deficit spending.
Meanwhile, raising revenue through tariffs while slashing costs dramatically fits the textbook definition of austerity. This was precisely Europe’s strategy after the financial crisis—and now the roles are reversing. Austerity has a terrible track record, while deficit spending after the crisis enabled America’s economic dominance and differentiation.
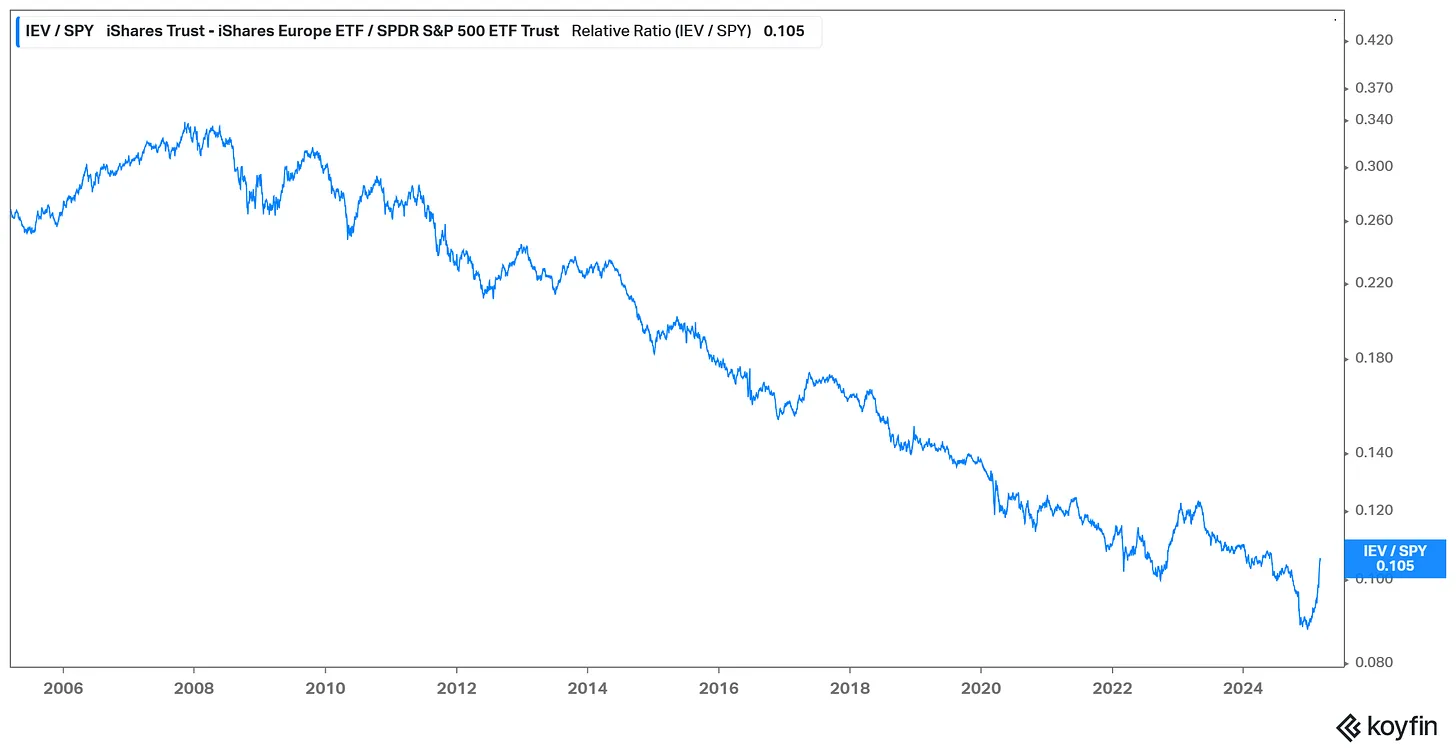
This helps explain why capital is beginning to flow out of the U.S. The largest divergence in developed-market assets is now moving toward Europe. Massive flows that once went to the U.S. are now reversing, initially shifting toward large, liquid European assets or similar-language markets. One way to visualize this trend is the ratio of IEV (European ETF) to S&P 500 ETF. In 2025, the long-standing trend of U.S. outperformance has broken, and capital rotation into Europe has become pronounced.
This is likely a long-term trend, as the consensus around American exceptionalism unravels. Another accelerant is the rapid decline in U.S. asset prices, while the rest of the world holds up relatively well.
But honestly—this is meant to be a newsletter about semiconductors, not macroeconomics. Most of the dynamics discussed above represent fairly conventional macro views that are already being rapidly priced in. The reality is that meaningful shifts in markets take time and are approaching their final stages. This could be a volatile process.
Market Dynamics and Semiconductors
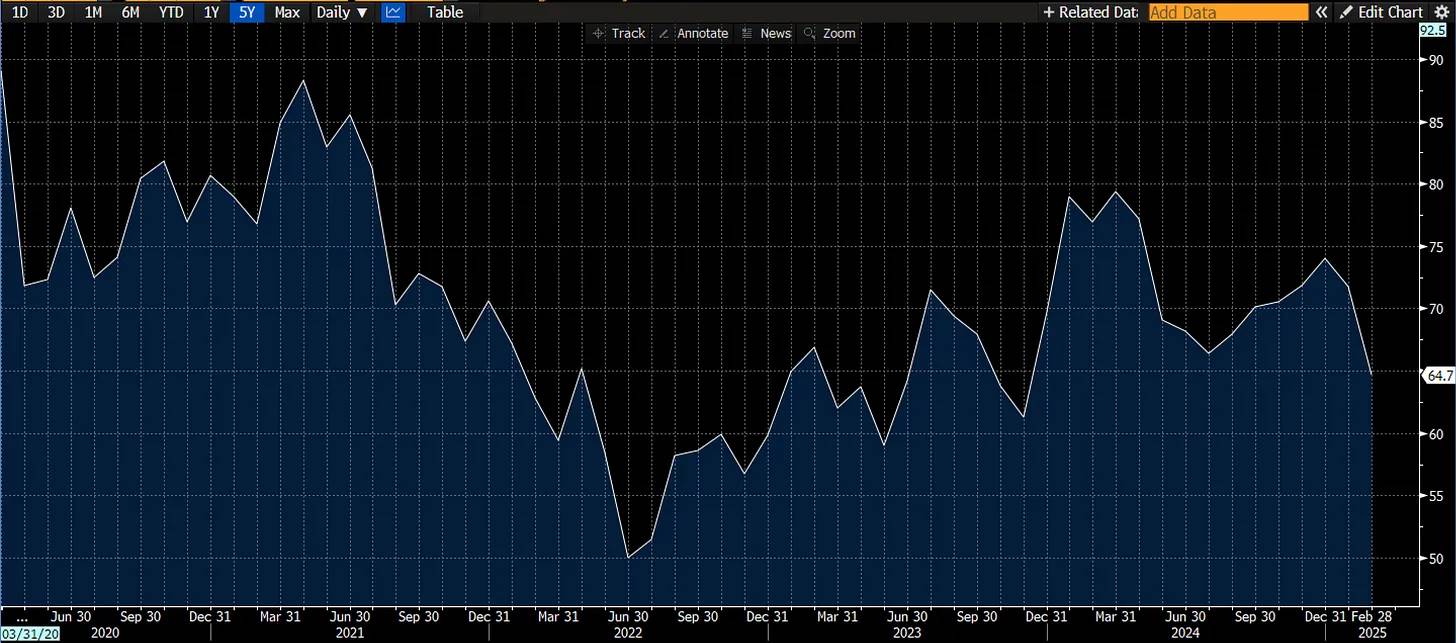
Finally, let’s return to my favorite sector: semiconductors. A few observations. First, the way markets top out closely resembles many past downturns. There’s an old saying: semiconductors lead the market—and in my experience, it holds true.
The chart below illustrates that when the semiconductor sector ends its period of relative strength, the broader market often experiences a significant correction in the following months.
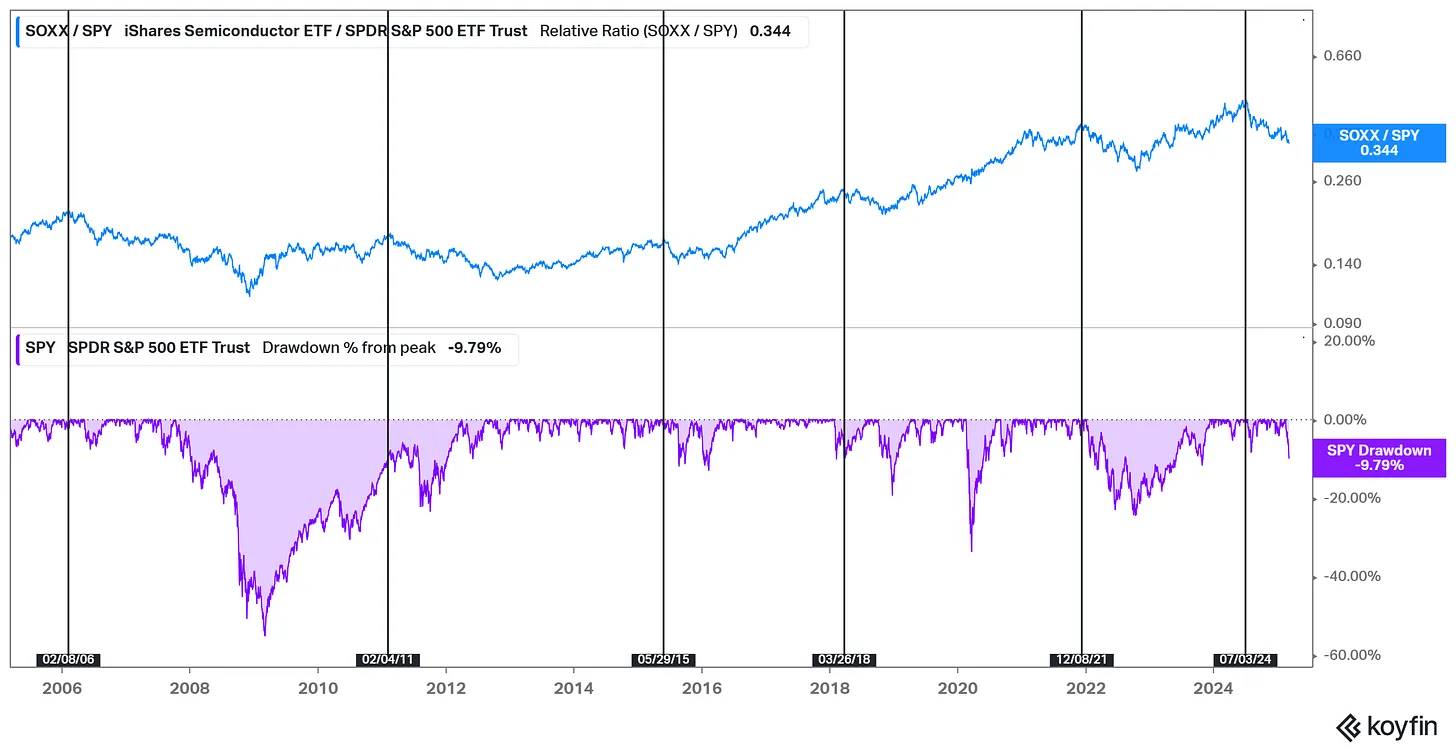
But semiconductors are cyclical. We’ve already seen declines. If the S&P 500 drops 10%, semiconductors typically fall 20%, and drops of 40% are possible. The sector is signaling poor economic health—a forward-looking indicator reflecting changes in semiconductor company orders and future revenue growth.
The question now is: how deep will this decline go? We’ve just seen a 10% drop, consistent with history. But such declines usually take longer and are often steeper. Given that the 2022 growth scare was enough to trigger a 20% market drop, I expect this downturn could end in a similar range—especially since today’s growth concerns are far more severe than in 2022.
Will this lead to a recession? That’s beyond my forecasting ability. But clearly, there are now several unsettling economic factors—trade headwinds and potential capital outflows away from the U.S. At minimum, we are undergoing a structural or environmental shift. This “transition period” may turn out to be just a market correction and economic contraction.
Join TechFlow official community to stay tuned
Telegram:https://t.me/TechFlowDaily
X (Twitter):https://x.com/TechFlowPost
X (Twitter) EN:https://x.com/BlockFlow_News


