

BTC oscillates around $80,000: Prelude to a bear market or a golden buying opportunity?
TechFlow Selected TechFlow Selected
BTC oscillates around $80,000: Prelude to a bear market or a golden buying opportunity?
Collection of diverse opinions from KOLs.
Written by: TechFlow
Welcome to another day of decline.
The crypto market is clouded today, with Bitcoin (BTC) price under renewed pressure, briefly dropping below $84,000 and posting a daily loss of nearly 3%.
Amid internal turmoil and external challenges, negative news continues to pile up: industry professionals are leaving en masse, project teams and market makers are embroiled in scandals, and KOLs are publicly clashing over unfair profit distribution—market trust is nearly shattered.
Once again, the chill is spreading to every retail investor.
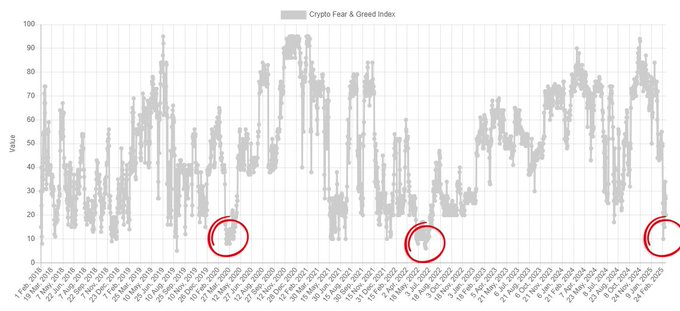
Data shows that current market fear levels mirror those seen during the 2020 pandemic crash and the 2022 market bottom, with the Fear & Greed Index now at 20—indicating an "extreme fear" state.
Yet recent U.S. announcements about establishing a national Bitcoin reserve have reignited hope among some investors.
As a barometer for the crypto market, BTC’s price appears significantly higher than years ago—seemingly bullish. But judging from recent volatility, it feels more like a bear market.
So what is this moment—a prelude to a bear market or a golden buying opportunity within a bull run?
Facing sharp price swings and uncertainty, what should we do? Let's examine perspectives from traders, KOLs, and influencers around the world to better understand market trends.
Wait-and-See Camp
"What are you doing?"
"I'm waiting for Godot."
"When will he come? I don't know. He told me he would come, and asked me to wait here." — *Waiting for Godot*

Samuel Beckett’s classic play *Waiting for Godot* tells the story of Vladimir and Estragon, endlessly waiting on a desolate roadside for “Godot”—a figure who never arrives, embodying profound uncertainty.
For retail investors, their “Godot” is BTC.
In the face of extreme BTC price volatility and overwhelming fear, some have chosen to wait and observe.
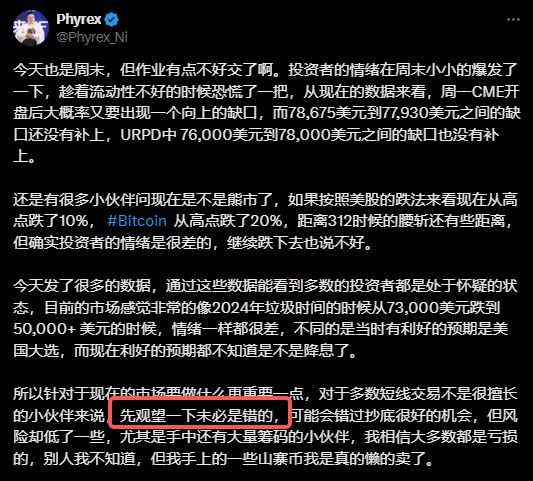
For example, Ni Da @Phyrex_Ni believes people should remain patient and await clearer market signals before acting, avoiding impulsive moves.
In his latest analysis, he clearly states that for average investors who aren’t skilled in short-term trading, staying on the sidelines may be the safest choice. He argues BTC is currently in a “garbage time” phase—similar to the period in 2024 when prices fell from $73,000 to $50,000—marked by extremely low sentiment and lacking near-term catalysts.
The reason for waiting lies in extreme market uncertainty.
Phyrex points out that BTC has broken below $84,000, repeatedly shaking investor confidence. The positive impact of strategic reserve initiatives has faded, expectations tied to the U.S. election have turned negative, and macroeconomic data (such as CPI, PPI, and the Fed dot plot) continue to dominate market narratives. With recent declines in U.S. equities and rising trade war (tariff) pressures, the crypto market could face further turbulence—making aggressive buying or increasing positions highly risky.
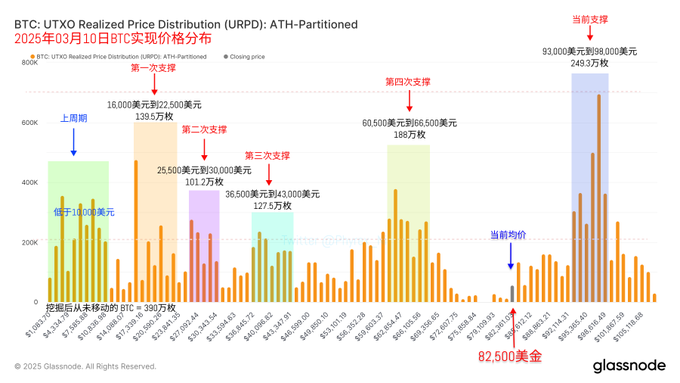
On-chain data supports this view.
The Unrealized Profit Distribution chart reveals a price gap between $76,000 and $78,000, potentially forming a short-term support zone. Meanwhile, the dense concentration of holdings between $93,000 and $98,000 has already failed to hold as support.
A key insight from the data: BTC turnover rate over the past 24 hours has been relatively low, meaning the price drop isn’t driven by mass sell-offs.
Taking all these factors into account, while buying the dip may seem attractive, the risk-reward balance must be carefully weighed.
Golden-Dip Bullish Camp
Downturns always flush out desperate sellers. Optimists argue that BTC is now in a temporary low, making it a prime opportunity to add positions or even buy the bottom.
-
@neso: Current levels represent a golden opportunity
Prominent KOL @neso asserts in his analysis that BTC’s current price sits in a “golden pit”—an excellent entry point for long-term investors.
"Both the stock market and crypto are experiencing a pullback of hot money—capital that likely flowed into assets like Nvidia and BTC anticipating Trump’s return. After his inauguration, policy uncertainty caused this capital to retreat, leading to a ~30% correction. But for crypto, we’re actually in the best policy environment since its inception. This pullback is clearly collateral damage—and from a long-term perspective, this is exactly a golden opportunity."

This argument holds merit.
Recent U.S. moves—establishing a Bitcoin reserve, the White House Crypto Summit, and the SEC’s retraction of SAB 121 accounting rules—mark the most favorable regulatory climate in crypto history.
While markets may feel these policies haven’t had immediate strong effects, compared to the harsh conditions crypto faced in the past, the improvement is enormous.
Further policy developments could lay a solid foundation for BTC’s long-term appreciation.
Additionally, describing BTC’s 30% retracement as “collateral damage” makes sense—it was dragged down by broader market forces like U.S. equities and macroeconomic headwinds (e.g., trade wars, monetary tightening), not due to fundamental issues within crypto itself. Historical patterns (such as rebounds after the 2022 bear market bottom and the 2020 pandemic crash) suggest such pullbacks often present strong long-term buying opportunities.
-
@Trader_S18: Long at $81,000
Trader @Trader_S18 took direct action, stating on X:
"Based on the expectation of a wide-ranging consolidation between $80K–$100K, I went long at $81,200 this morning."
He believes BTC has formed a broad consolidation range between $80,000 and $100,000, and the current dip to $81,200 approaches the lower boundary—offering a favorable risk-reward ratio for going long.
According to four-hour candlestick charts and volume data, $81,000 may act as technical support, providing justification for short-term long positions.
Of course, this trader’s strategy may suit experienced short-term traders. An entry at $81,200 is close to technical support, but risks remain clear: if the market drops further toward the $76,000–$78,000 zone, stop-losses could be triggered.

For retail investors buying the dip at current levels, let’s hope this isn’t a wait for "Guo" (a pun on “cutting losses”).
The $75,000 Action Zone Camp
Another school of thought suggests that around $75,000 will be a critical price level for BTC, warranting close attention.
-
Arthur Hayes: Market may see drastic moves at $70,000–$75,000
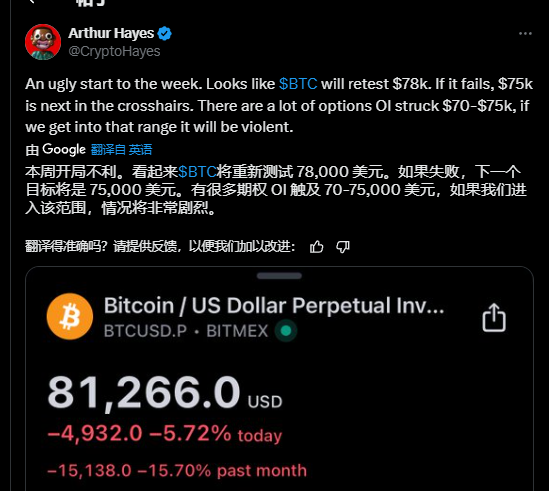
According to his post and related trend data, Bitcoin’s price in March 2025 has pulled back from highs, breaking below $81,000 and possibly testing $78,000 or even $75,000.
Hayes’ analysis suggests that if BTC reaches the $70,000–$75,000 range, significant price volatility could occur due to a high concentration of open interest (OI) in options contracts at those strike prices.
Specifically, Hayes refers to the Bitcoin options market, where a large volume of open contracts are set at strike prices between $70,000 and $75,000. This means many traders or investors have bought call or put options exercisable at these levels.
When BTC’s price approaches or enters this range, especially near expiration dates, holders may exercise their options (buying or selling BTC), or market participants may hedge or close positions—triggering substantial trading activity.
This could lead to sharp price swings—either up or down.
A large accumulation of OI in a narrow price band implies potential liquidity stress. If many traders simultaneously try to buy or sell BTC to hedge or exit options positions, it could cause rapid price movements or even trigger a “squeeze.”
Therefore, Hayes’ warning suggests investors should prepare for heightened volatility and consider whether to “buy the dip” or wait for more stable pricing.
-
Eugene Ng Ah Sio: Wait until $75,000
Trader Eugene Ng Ah Sio stated in a Telegram group that he isn’t rushing to enter at current levels. He reiterated that the only level he’s interested in right now is $75,000.
Bullish Indicators for Encouragement
If you just need a bit of psychological comfort or encouragement, here are some bullish indicators to lift your spirits.
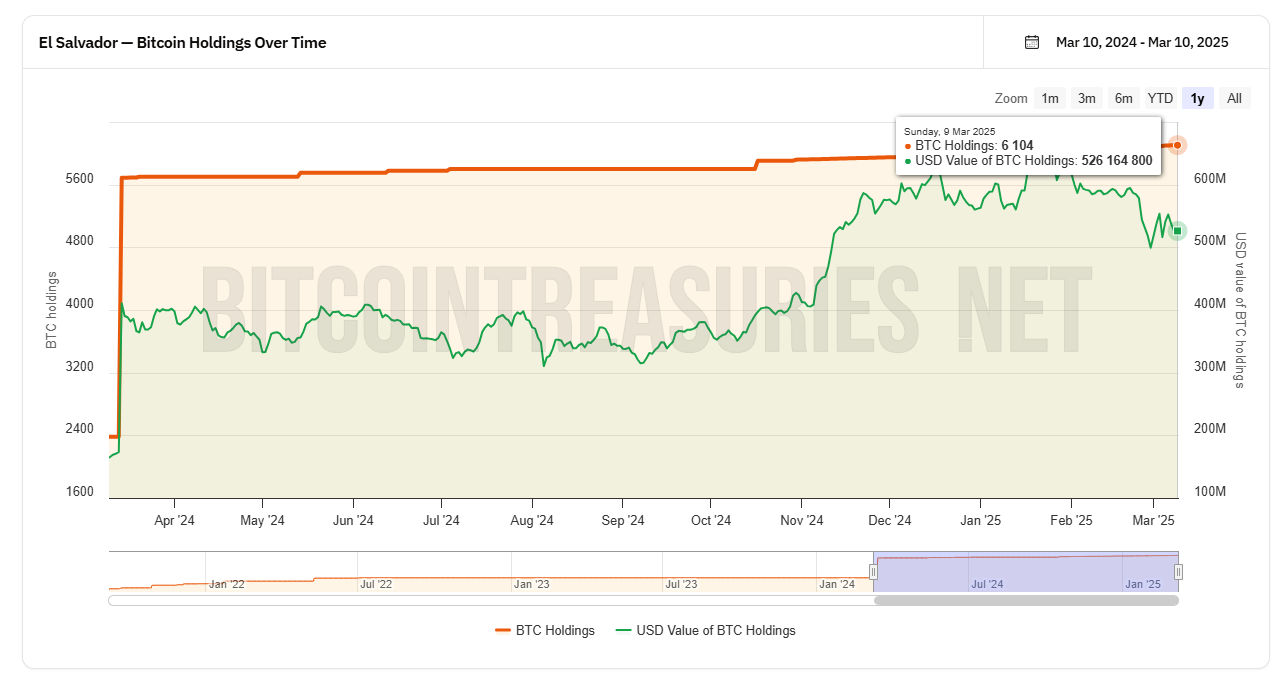
First, El Salvador added 5 more BTC today, bringing its total holdings to 6,111 BTC. The chart clearly shows El Salvador is a committed DCA (dollar-cost averaging) buyer—small purchases, but consistent.
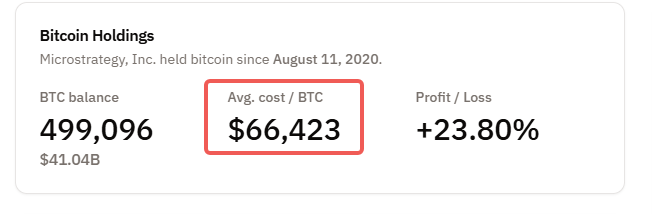
Then there’s MicroStrategy—the ultimate maximalist—which has made several large-scale BTC purchases from late last year into early this year.
Its CEO, Michael Saylor, was recently photographed looking distressed while attending a meeting hosted by Trump. Perhaps he’s the one who truly hopes BTC keeps rising.
Don’t worry though—data shows MicroStrategy’s average purchase cost is around $66,000, so they’re still above break-even.
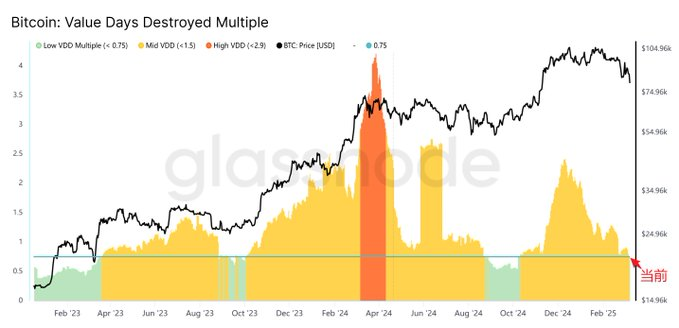
Additionally, on-chain analysis shows that BTC’s VDD Multiple has entered a bottom zone, nearing historical lows (below -2.9). This mirrors previous market bottoms during the 2022 bear market and after the 2020 pandemic crash—indicating extreme fear and low liquidity.
Combined with BTC’s recent ~20% drop from $90,000 to below $84,000, and no significant rise in exchange trading volume, the VDD indicator suggests investors are holding tight and supply is consolidating—potentially setting the stage for a rebound.
The VDD Multiple divides the short-term (typically 30-day) average of VDD by the long-term (typically 365-day) average, creating a ratio. This reflects how current spending velocity compares to annual averages, helping identify cyclical tops and bottoms in the Bitcoin market.
Finally, amid the unpredictable "kangaroo market" behavior, the views above should only serve as reference. The author still believes caution prevails—better to miss out than lose principal.
Prices might return, but your position must not disappear.
Join TechFlow official community to stay tuned
Telegram:https://t.me/TechFlowDaily
X (Twitter):https://x.com/TechFlowPost
X (Twitter) EN:https://x.com/BlockFlow_News


