








Analysis: Nasdaq's "double top" bearish pattern increases Bitcoin's short-term downside risk; a break below the 200-day MA could test support at $73,757
TechFlow Selected TechFlow Selected
Analysis: Nasdaq's "double top" bearish pattern increases Bitcoin's short-term downside risk; a break below the 200-day MA could test support at $73,757
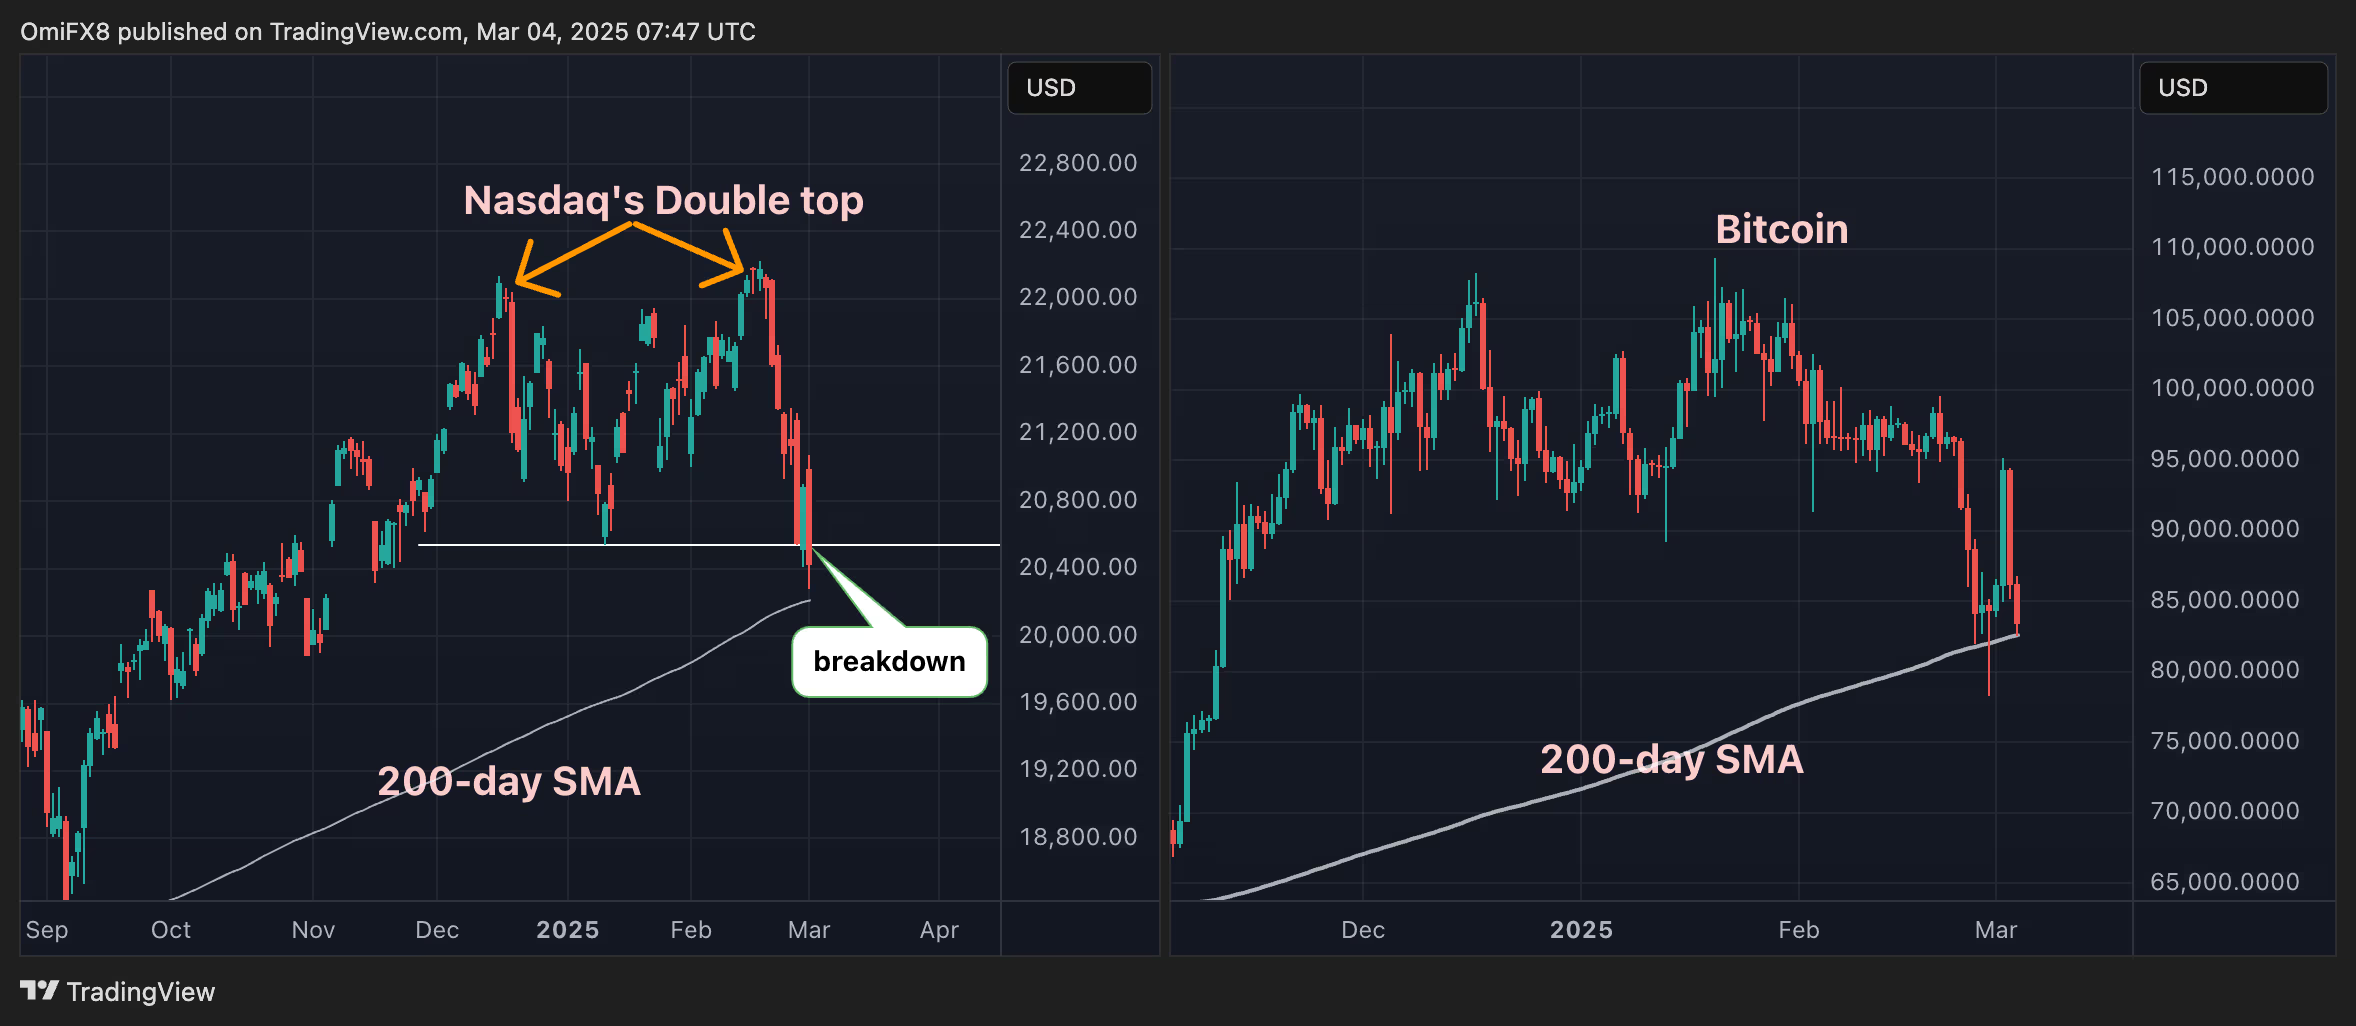
According to CoinDesk, the Nasdaq index triggered a bearish "double top" reversal pattern on Monday, increasing Bitcoin's (BTC) short-term downside risks. Research firm Ecoinometrics said on Monday that Bitcoin's long-term recovery is closely tied to the Nasdaq's upward trend, highlighting a significant positive correlation between the two. Bitcoin has dropped over 10% in the past 24 hours, erasing its gains from Sunday when it surged to $95,000. Earlier today, the price briefly tested the 200-day simple moving average (SMA) support level at $82,587.
 Navigating Web3 tides with focused insights
TechFlow news, on March 4, according to CoinDesk, the Nasdaq index triggered a "double top" bearish reversal pattern on Monday, increasing Bitcoin's (BTC) short-term downside risks. Research firm Ecoinometrics stated on Monday that Bitcoin's long-term recovery is closely tied to the Nasdaq's upward trend, highlighting a significant positive correlation between the two.
Bitcoin has fallen over 10% in the past 24 hours, erasing its gains from Sunday when it surged to $95,000. Earlier today, the price briefly tested the 200-day simple moving average (SMA) support level at $82,587. The 200-day SMA is considered a key indicator of long-term trends, and a break below this level is typically interpreted as a signal of potential significant losses.
The Nasdaq has formed two peaks near $22,200 since mid-December, with a trough at $20,538. On Tuesday, the index closed below the trough's support level, confirming the double-top bearish reversal pattern. According to technical analysis theory, the subsequent decline could be at least 70% of the distance between the peak and the trough, suggesting the Nasdaq might fall to 19,400.
If Bitcoin breaks below the 200-day moving average, the next support level would be directly at the former historical high turned support level of $73,757.
Join TechFlow official community to stay tuned
Telegram:https://t.me/TechFlowDaily
X (Twitter):https://x.com/TechFlowPost
X (Twitter) EN:https://x.com/BlockFlow_News




