









Buy the dip or hold cash and wait? Rethinking the "85" market crash from a trend perspective
TechFlow Selected TechFlow Selected
Buy the dip or hold cash and wait? Rethinking the "85" market crash from a trend perspective
From a trend perspective, Bitcoin still faces significant upward resistance.
 Navigating Web3 tides with focused insights
By TechFlow Asher Zhang
On August 5, Bitcoin plummeted sharply, triggering liquidations among major whales and leaving the market in despair. Many attribute this crash to expectations of a U.S. economic recession and the Bank of Japan's rate hikes, yet they overlook the substantial internal selling pressure inherent in the Bitcoin market itself. Moreover, the market overestimates the impact of random external factors on Bitcoin’s trend development. From the perspective of least resistance, these偶然 factors merely deepened the extent of the decline. This article focuses primarily on Bitcoin trend analysis. Our previous analyses have largely aligned with Bitcoin’s actual price movements. Here, we aim to offer readers some insights into Bitcoin’s underlying trends—excluding偶然 influences—as reference.
After Bitcoin’s rebound in July, $70,000 emerged as a key resistance level
Between sharp declines and rallies, various narratives drive bullish or bearish sentiment, forming the core of bull-bear battles. Therefore, when discussing trend developments, it is essential to define the time frame clearly. Viewed from the full bull market cycle, it remains difficult to argue that the current phase has fundamentally altered the ongoing bull market pattern. Looking ahead, this article still leans toward a continuation of the bull market. While recent U.S. employment data missed expectations, more evidence is needed before confirming an economic downturn; thus, shifting fully to bearish positions at this stage would be premature. The focus here lies in intermediate-term trends spanning weeks to months—a hallmark of our prior research. Below, we analyze the intrinsic reasons behind this latest market correction through the lens of trend dynamics.
Previously, I suggested that Bitcoin’s recovery by late July stemmed mainly from two aspects: 1) Analysis of German government sales and Mt. Gox repayments; 2) The impact of Trump’s speech. Specifically, after the German government concluded its Bitcoin disposal, market fear subsided. However, during Mt. Gox compensation, retail investor selling pressure was underestimated. Retail traders tend to buy high and sell low. Combined with stimulus from Trump’s pro-crypto remarks, the crypto market staged a strong rebound. Yet once Bitcoin failed to decisively break above $70,000, bullish momentum began to wane.
Why did I believe that Bitcoin could present a favorable entry opportunity in August following Trump’s speech? Three additional indicators support this view. First, institutional investors on Wall Street showed weakening appetite for accumulation once Bitcoin approached $70,000—a trend supported by their historical buying behavior. Overall, institutions remain in an accumulation phase but lack strong motivation for aggressive price pumps. Second, Bitcoin miners started selling aggressively around the $70,000 mark. As early as June 13, CryptoQuant noted on X that miners were under pressure and had begun offloading holdings, evidenced by increased transfers from mining pools, surging OTC volumes, and significant sell-offs by large publicly listed mining firms. When Bitcoin fluctuated between $69,000 and $71,000, miner selling intensified. Data shows miners sold 1,200 BTC via OTC trades on June 10—the highest daily volume in two months. Third, Bitcoin exhibits seasonal tendencies in August, a pattern mirrored in broader macroeconomic cycles.
These three indicators collectively signaled weakening bullish strength. Under such conditions, any negative macro developments would likely accelerate the downturn. Additional bearish catalysts included weaker-than-expected U.S. jobs data, Japan’s interest rate hike, and the U.S. government releasing approximately 28,000 BTC. On top of this came the distribution of 33,960 BTC under the Mt. Gox settlement and Genesis creditors receiving $1.5 billion worth of Bitcoin and Ethereum. Such massive supply overhangs are difficult to absorb in the short term. Combined with whale liquidations, these pressures culminated in a market crash.
A highly accurate Bitcoin bottom-picking indicator
I believe that when Bitcoin approached $70,000 near the end of July, making a direct shorting decision was not straightforward. However, employing hedging strategies based on the above trend analysis while awaiting clearer signals was feasible. But when Bitcoin crashed, there emerged a highly reliable bottom-picking signal—miner shutdown price—a metric proven accurate across multiple bull and bear cycles.
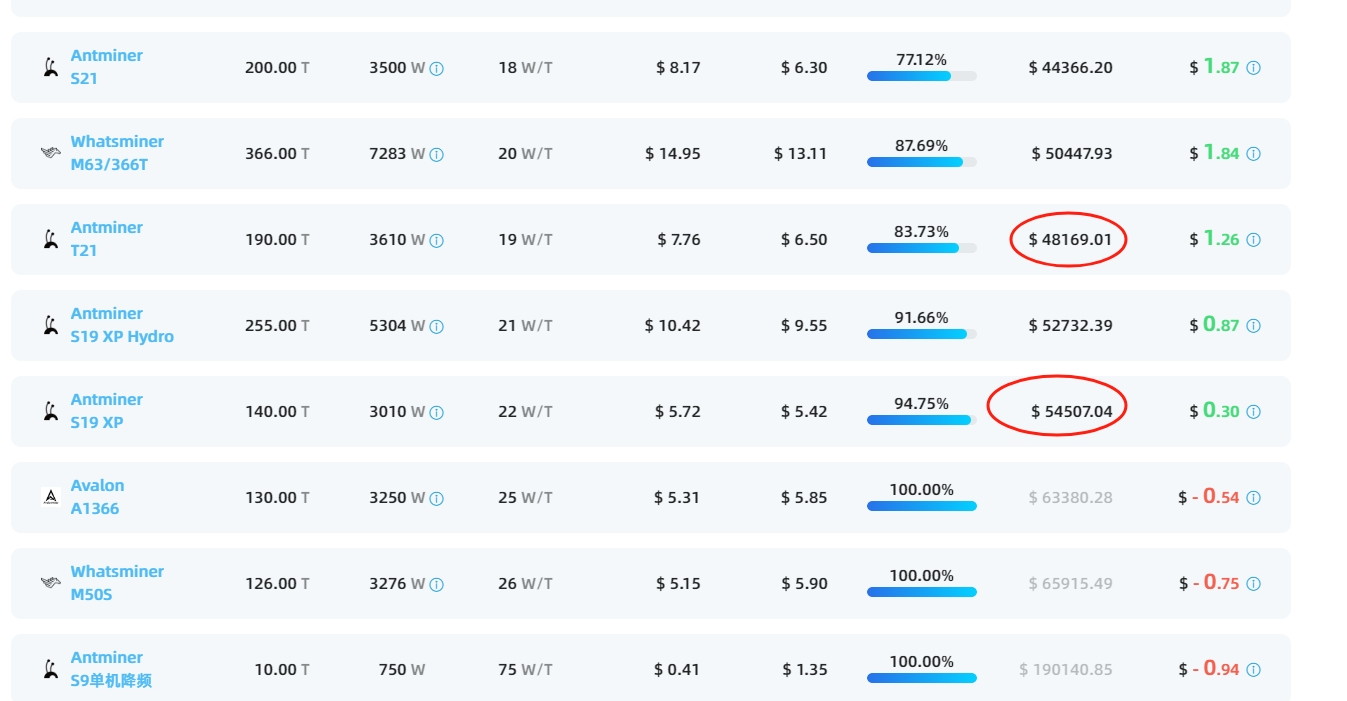
According to Poolin data, the shutdown price for mainstream Bitcoin mining rigs like the Antminer S19XP stands at $54,507, while the T21 model shuts down at $48,169. For Bitcoin, this creates a critical support zone between $48,000 and $54,000. Especially after breaking below $63,000, investors should consider gradually building positions within this range—an area confirmable without complex technical or market analysis.
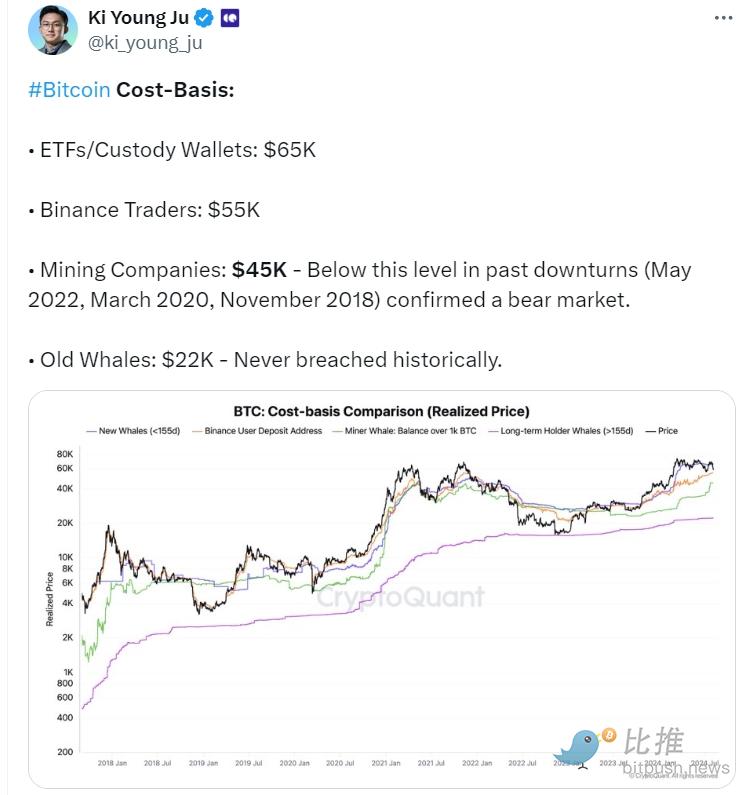
Beyond these visual metrics, Ki Young Ju, CEO of CryptoQuant, offered a valuable statistical breakdown. On August 6, he posted on X showing Bitcoin cost basis levels as follows: ETF/custodial wallets – $65,000; Binance traders – $55,000; Mining companies – $45,000. In past market downturns (May 2022, March 2020, November 2018), prices falling below these levels confirmed bear markets. Long-term whales hold at ~$22,000. As previously stated, the overarching trend remains bullish, and from the miner shutdown perspective, $45,000 represents Bitcoin’s approximate downside limit.
How will Bitcoin develop going forward?
What lies ahead for Bitcoin? Currently, U.S. macroeconomic conditions remain a dominant influence. How do prominent market analysts view the outlook for the U.S. economy and Bitcoin?
Goldman Sachs CEO David Solomon expects the Federal Reserve to avoid emergency rate cuts, believing the U.S. economy will not enter a recession. He stated: "I don’t expect much movement before September. The economy will continue on a steady path, possibly avoiding a recession altogether. Based on current economic data and Fed messaging, I anticipate one or two rate cuts this fall."
Cryptocurrency analyst Alex Krüger posted on X: "This market collapse is clearly driven by macro forces, not crypto-specific issues." A financial crisis triggered by leveraged Japanese speculators is preferable to one caused by a U.S. recession. Regarding U.S. data, attention now centers on the labor market. Investors should closely watch Thursday’s initial jobless claims (typically non-market-moving) and state-level employment figures due August 16 (State Employment Data)—a rarely monitored dataset providing granular regional insights.
On August 6, 10x Research noted in a report that many blame Bitcoin’s sell-off on yen carry trade unwinding, but reality is more complex. Since mid-March, Bitcoin has been fragile despite a 15% rise in the Nasdaq and a 10% depreciation in the yen—yet Bitcoin remained range-bound. Carry trades depend on sustained high U.S. interest rates, which appear unsustainable. The rules have changed. In the past 24 hours, crypto trading volume hit $244 billion—the highest since March 6. After reaching new highs, Bitcoin experienced massive intraday liquidations. With new asset pricing drivers emerging, financial markets resemble puzzles needing periodic reassembly—this is one such moment. Unlike April and June’s sharp drops later reversed by rising leverage, such a rebound may not occur this time.
Also on August 6, QCP Capital stated in its latest analysis: Rumors of emergency rate cuts are unlikely, as they would severely damage the Fed’s credibility and amplify market panic, reinforcing recession fears. Yesterday’s risk-off wave already wiped out a significant portion of leverage. With prices crashing, now might be the time to consider accumulating spot BTC and ETH. It’s too early to declare markets normalized. Although the VIX has dropped from yesterday’s peak above 65, it remains elevated above 30.
On August 6, Coinbase researcher David Duong said Tuesday’s market conditions suggest a potential short squeeze may emerge as centralized exchange buying increases—possibly driving a near-term rally. Additionally, Genesis’ bankruptcy plan includes distributing Bitcoin and Ethereum in-kind; unwinding of yen carry trades may also affect Mt. Gox creditors’ decisions upon receiving BTC. The recent market drop does not signify the start of a new long-term trend or market cycle.
Conclusion
From a trend perspective, Bitcoin continues to face strong upward resistance stemming from miner selling, U.S. government disposals, and payouts from Mt. Gox and Genesis—pressures requiring time to digest. However, once Bitcoin enters the $48,000–$54,000 range, investors can begin accumulating with confidence. According to Goldman Sachs analysts, the Fed may cut rates once or twice this fall—potentially providing tailwinds for Bitcoin. Additionally, as the U.S. election approaches, Trump’s pro-crypto rhetoric could help restore market sentiment and fuel further gains. Nevertheless, I am more optimistic about the first half of next year, primarily because the market will have absorbed recent massive sell-offs, while Fed rate cuts could inject substantial liquidity into the crypto ecosystem.
Join TechFlow official community to stay tuned
Telegram:https://t.me/TechFlowDaily
X (Twitter):https://x.com/TechFlowPost
X (Twitter) EN:https://x.com/BlockFlow_News
 比推 BitpushNews









