









10x Research: Here comes the big one — Bitcoin could drop to $42,000
TechFlow Selected TechFlow Selected
10x Research: Here comes the big one — Bitcoin could drop to $42,000
"We are very bearish on altcoins, especially Ethereum, which could fall to $2,000."
 Navigating Web3 tides with focused insights
Author: Markus Thielen
Translation: Fu Heruo, Odaily Planet Daily
Despite prevailing bullish sentiment in Bitcoin and the broader cryptocurrency space, at times it's crucial to protect wealth or capitalize on significant price declines.
On October 3, 2023, we published an article forecasting a strong rebound in Bitcoin—contingent on the Federal Reserve maintaining its current stance—and advised "selling into the first Fed rate cut." This view has gained widespread attention, as the anticipated rate cuts appear driven more by economic weakness than by falling inflation.
Market Forecast and Analysis
In October 2022, when most were bearish, we took a bullish position and set a halving price target of $63,160 for 2024, which was ultimately reached on April 20, 2024, at $63,491. Similarly, our year-end 2023 target of $45,000 came close, with the actual result at $43,613.
Many expressed disappointment with our early February report, where we set a 2024 Bitcoin price target of 'only' $70,000. However, we had already forecasted a range of $60,000–$70,000, predicting diminishing returns and a cycle peak at $62,000 based on our Stock-to-Flow analysis. For further details, please refer to our report from May 9, 2024.
Bitcoin is primarily a momentum-driven trading game—trend is your friend until it isn't. While we can outline potential cycle developments, timing tops and bottoms requires reacting to breakdown or breakout signals. This approach may lead to losses when false buy signals occur during rebounds, but effective risk management, such as using stop-loss orders, can protect most traders' capital. Although many advocate holding or dollar-cost averaging, these strategies have not served investors who entered Ethereum or Bitcoin since 2021 particularly well. Our short signal on Ethereum, initiated on July 22, generated a 20% profit; a larger correction could still unfold.
Risk Management
Bitcoin has been primarily driven by changes in leverage since March.
The key difference between institutional and retail traders lies in regulators requiring institutions to adhere to risk management principles. This is especially important in crypto markets, where many tokens face a high probability of dropping 99%. For example, Alameda and Three Arrows Capital outsourced their risk management to counterparties willing to lend them billions. Yet, in any disciplined investment firm, risk managers would eventually step in and force liquidations.
While institutions may endure losses of 20% or 40%, they won’t hold positions until they’re worthless. Every trader—institutional or retail—must take responsibility for risk management and establish acceptable thresholds for maintaining long-term positions.
Technical Analysis
As shown in the chart below, Bitcoin has broken below the support level of $59,837. The next minor support is at $55,000, followed by $42,000.
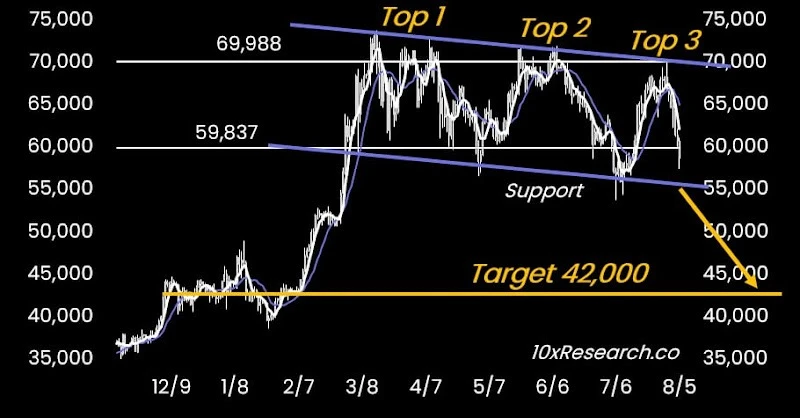
Over the past five months, Bitcoin has traded in a difficult range resembling a topping pattern. We previously predicted Bitcoin would fall to $52,000–$55,000 in April. Although the low reached only $56,500, we recommended re-entering once Bitcoin rose above $61,000. In June, we again forecasted a drop to $50,000–$55,000, and Bitcoin hit $53,500. Once more, we advised re-entering just above $60,000. However, without strong market structure support, Bitcoin remains vulnerable to range-bound volatility. We’ve focused on identifying factors that could break this range either upward or downward.
The monthly stochastic indicator for Bitcoin—shown below—illustrates cycles:
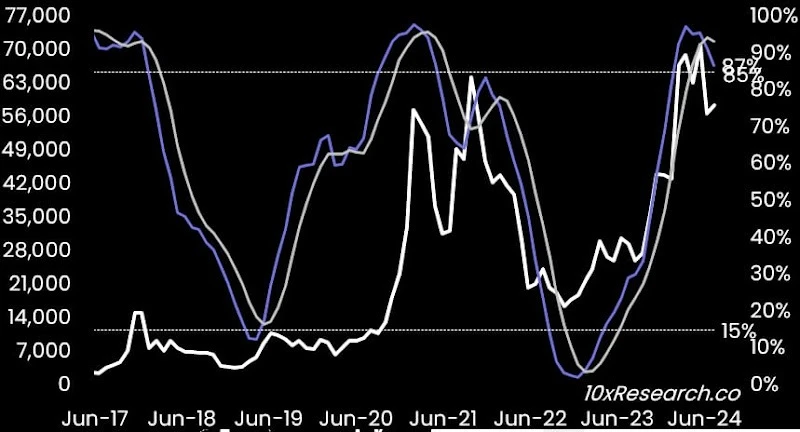
We use two monthly indicators to determine when Bitcoin gains or loses momentum. The monthly stochastic has historically given reliable buy signals when bottoming and sell signals at peaks. Over the past two months, we’ve emphasized that this indicator has been topping out. Bitcoin’s rally ended when it failed to sustain above two standard deviations from the 21-month moving average—a pattern similar to January 2018 and April 2021.
Although we frequently analyze on-chain data, they often fail to provide timely signals—our primary concern. On-chain metrics like HODL waves track the number of short-term holders (3–6 months and 1–3 months). These typically rise during bull markets as more participants enter. However, since the halving, these figures have plateaued, indicating no significant new capital inflow into the crypto market.
Additionally, on-chain data suggests Bitcoin is undervalued when the price falls below realized price (the average cost basis). This means Bitcoin is considered cheap when the market price is below the realized price. Currently, the realized price stands at $31,400.
Market Participant Behavior
With new participants entering the Bitcoin market and confidence in the network remaining high, the system appears poised for sustained price increases. However, periods of sharp price declines are also possible. Since mid-March, we’ve warned of downside risks due to slowing stablecoin growth and relatively weak ETF inflows—largely driven by arbitrage positions.
Altcoin Market
The rallies in May and July 2024 were primarily fueled by a sharp increase in futures leverage, despite weak market structure and no significant influx of new participants. Instead, larger players sold altcoins and rotated capital into Bitcoin. This strategy mirrors what Block One did after its ICO (rather than foolishly building the promised EOS ecosystem). Given the billions of dollars in token unlocks observed in recent weeks, other participants may adopt similar tactics in 2024. As a result, many altcoins are expected to decline sharply. We remain strongly bearish on altcoins, particularly Ethereum.
Every trader must act as their own risk manager, recognizing that multiple scenarios are possible (a point we cannot emphasize enough). When prices fell below $60,000 in July, ETF investors bought the dip, even though ETF holders were on average underwater. This $60,000 level is also the threshold at which Bitcoin mining becomes unprofitable for the industry, leading to significant price drops due to miners’ high beta.
Outlook
Although Bitcoin has been in a gradual downtrend, forming three tops and two bottoms, we expect the $55,000 support level to break, potentially pushing prices down to $42,000. In such a scenario, Ethereum could fall below $2,000. While this may seem extreme to some, weakening economic data (as indicated by our ISM reports), persistently weak market structure, on-chain data, and our cycle analysis all suggest further pressure ahead.
Our goal is to help investors understand the market by continuously sharing our latest insights. Not every analysis will be accurate—markets are dynamic, and new information can shift prior views—but we strive to offer investors the most relevant perspectives available today. This is why professionals constantly reassess and reanalyze the market.
Bitcoin and cryptocurrencies will continue to exist and offer wealth opportunities. But successful trading requires knowing when to participate, when to exit, when to make small bets, and when to go big. These principles are essential for staying in “the game.”
Join TechFlow official community to stay tuned
Telegram:https://t.me/TechFlowDaily
X (Twitter):https://x.com/TechFlowPost
X (Twitter) EN:https://x.com/BlockFlow_News










