

TechFlow: Fed's "Stealth Stimulus" Arrives, Crypto Market Set to Benefit from Liquidity Influx
TechFlow Selected TechFlow Selected
TechFlow: Fed's "Stealth Stimulus" Arrives, Crypto Market Set to Benefit from Liquidity Influx
What will happen to net Fed liquidity in the third quarter of 2024?
Author: Tomas
Translation: TechFlow
Net Fed liquidity is set to rise over the coming months. This could be good news for stocks, gold, and Bitcoin. Let me explain why.

Net Fed liquidity measures the total liquidity flowing directly into markets from Federal Reserve sources. It can be seen as America's "stealth stimulus," influenced not only by the Fed but more importantly by the U.S. Treasury.
Since early 2022, the Fed has officially pursued a tightening policy through balance sheet reduction. In reality, however, nearly $1 trillion in liquidity was injected into markets between December 2022 and March 2024. This is what caught many investors off guard during the market rebound at the end of 2022.
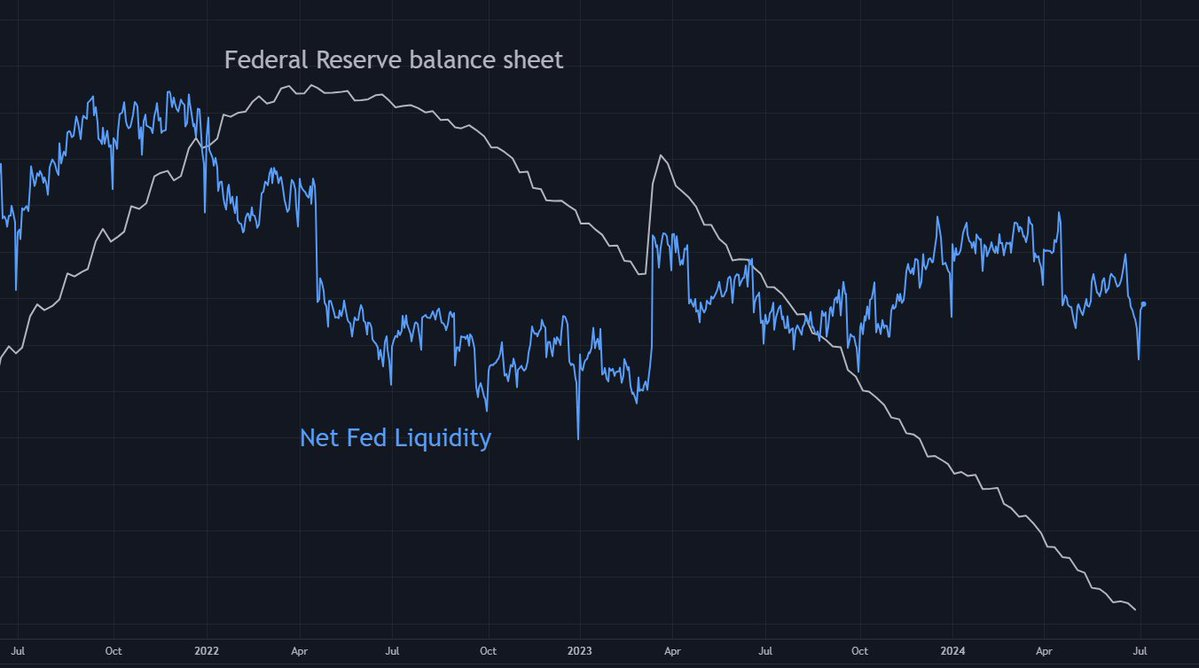
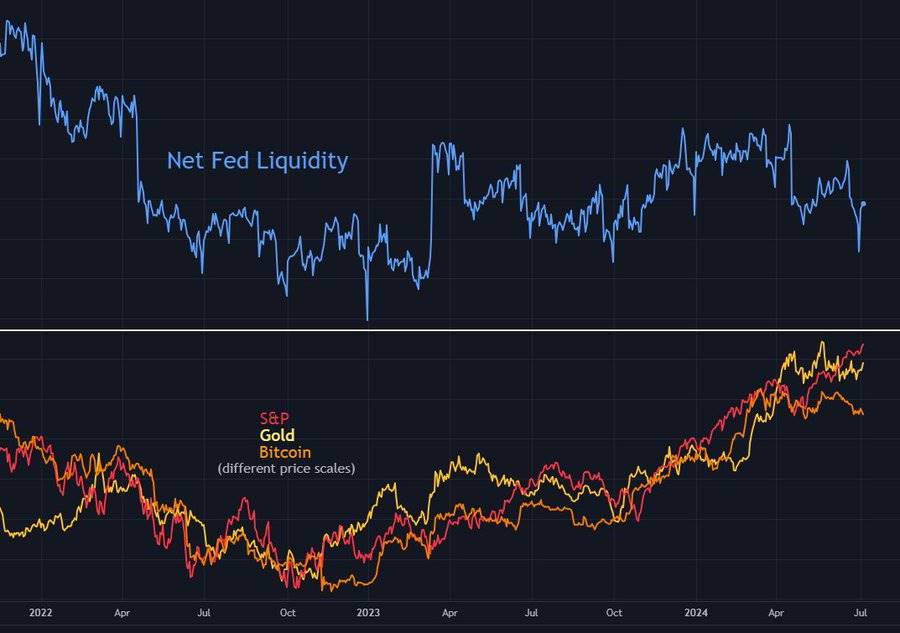
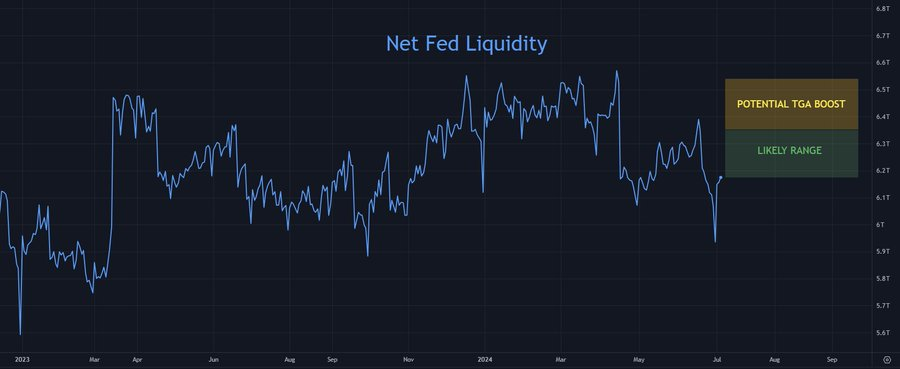
Net Fed liquidity correlates broadly with most asset markets. It declined in 2022 (alongside asset prices) and then bottomed out near the end of that year (also alongside asset prices) [Chart 1]. The correlation with Bitcoin in particular is strong [Chart 2], while its relationship with equities has weakened in recent months.
[Chart 1]
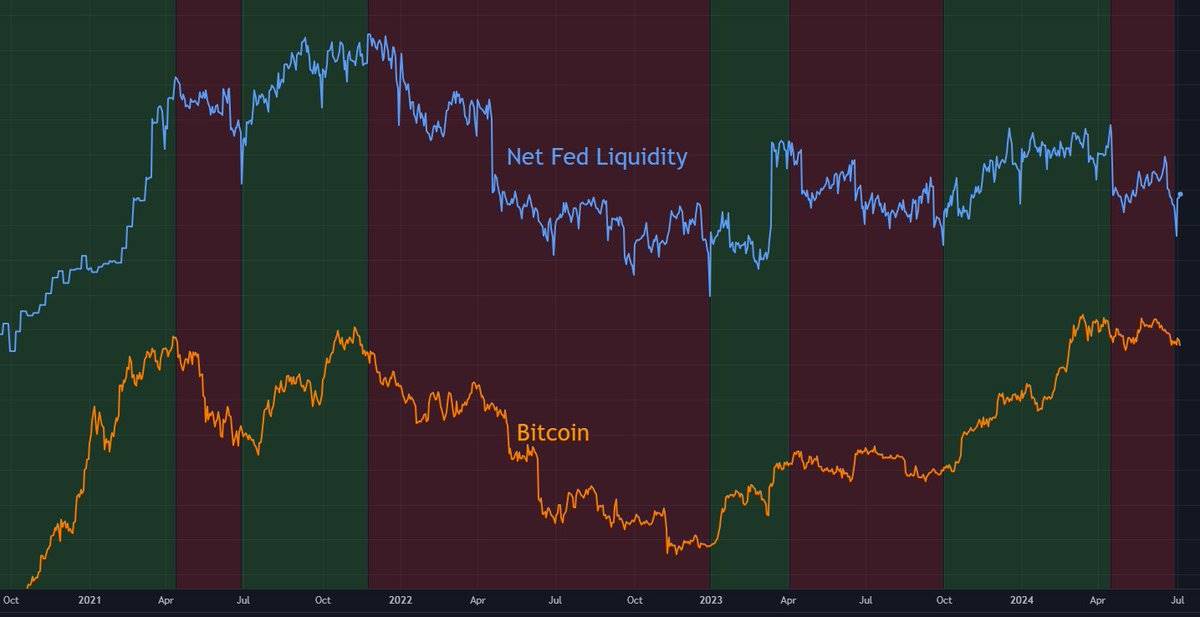
[Chart 2]
My measure of net Fed liquidity includes five components:
-
Discount Window
-
Bank Term Funding Program (BTFP)
-
Balance Sheet
-
Treasury General Account (TGA)
-
Reverse Repo (RRP)
At any time, these five components are either injecting or draining liquidity from markets. Different components essentially pull in opposite directions—like a tug-of-war.
Net Fed liquidity measures which side wins this tug-of-war.

The important thing about net Fed liquidity is that its overall future direction can sometimes be predicted relatively accurately.
So, what will happen to net Fed liquidity in Q3 2024? Let’s examine each of these five components and how they might behave in the third quarter.
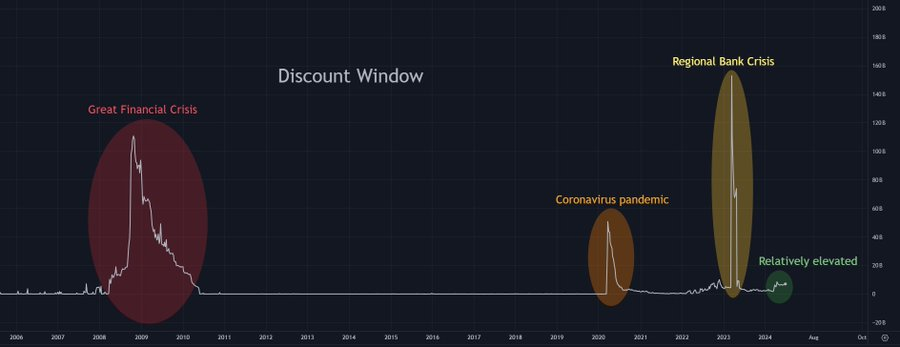
1. Discount Window – No significant change
The Fed's discount window serves as the banking sector’s “lender of last resort” in emergencies.
Banks borrowing through the discount window effectively injectsliquidity into markets. While usually insignificant, the discount window spikes during banking stress periods—such as the 2008 global financial crisis, the 2020 pandemic, and the 2023 regional bank crisis.
Currently, discount window usage is relatively high (~$7 billion), but far below historical “panic levels,” and insufficient to meaningfully impact markets. Most of the time, it's negligible—and I expect it to remain so in Q3 2024. So we can temporarily ignore the discount window.
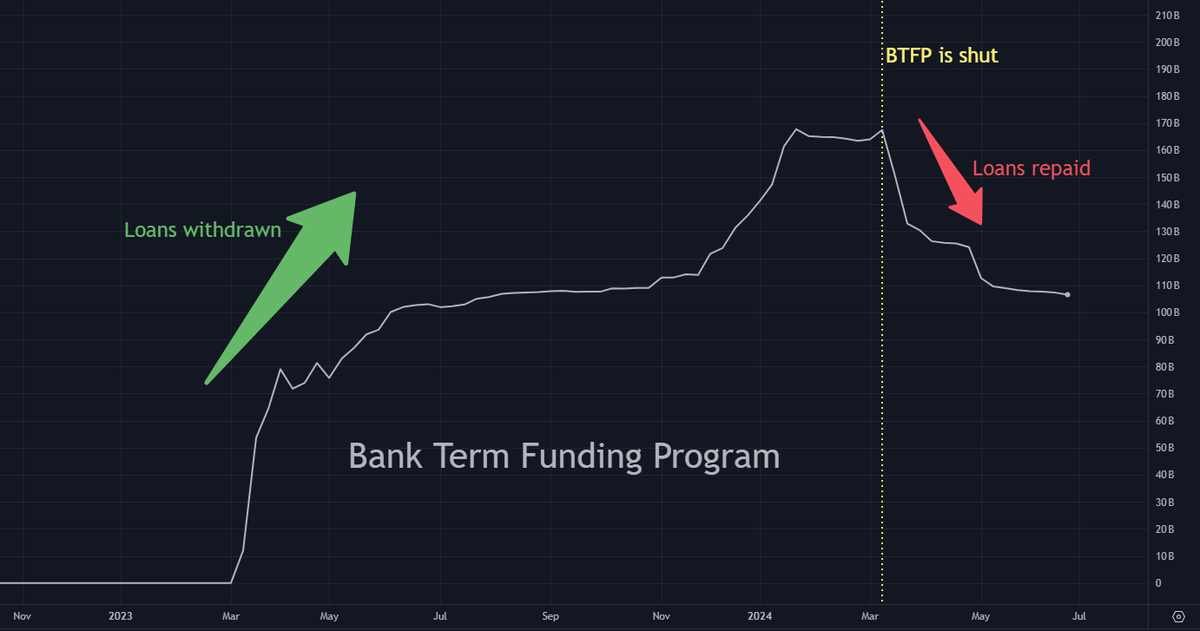
2. Bank Term Funding Program – Minimal change
The Bank Term Funding Program (BTFP) was an emergency lending facility launched by the Fed in March 2023.
During and after the regional banking crisis (e.g., Silicon Valley Bank collapse), banks borrowed approximately $165 billion through BTFP, which at the time represented aliquidity injection.
However, the BTFP was shut down in March 2024, and those loans now need to be repaid within 12 months. As repayments occur, this willdrain liquidity from markets.
I expect minimal changes to BTFP balances in Q3. Any movement will likely be under $20 billion. For simplicity, we can also set this factor aside.
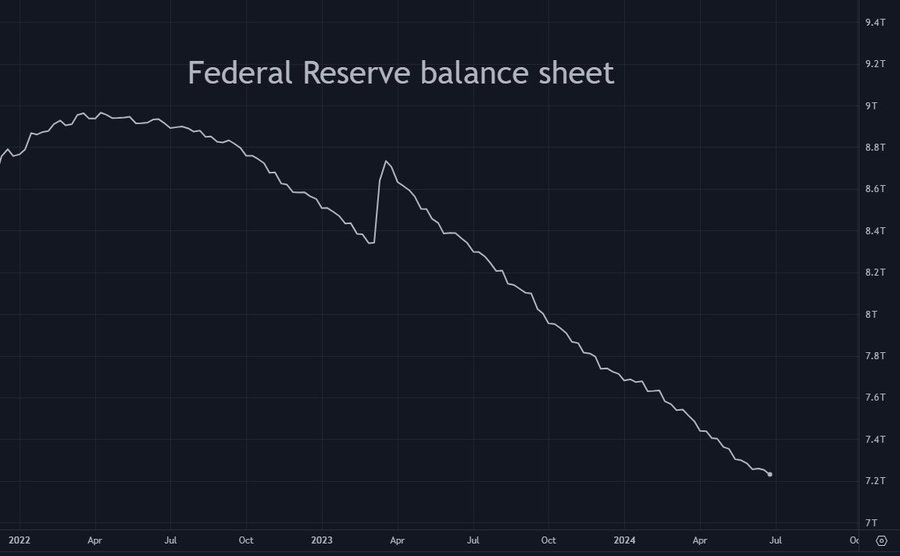
3. Balance Sheet – $75 billion liquidity drain
The Fed is currently engaged in Quantitative Tightening (QT), reducing its massive balance sheet by selling off U.S. Treasuries and mortgage-backed securities (MBS). QT acts as aliquidity drain, because when the Fed sells these assets, the market must absorb them—tying up funds that could otherwise circulate.
This is the easiest component to predict, as it operates systematically. The Fed’s balance sheet is scheduled to shrink by ~$25 billion per month in Q3, totaling a $75 billion liquidity drain over the quarter.
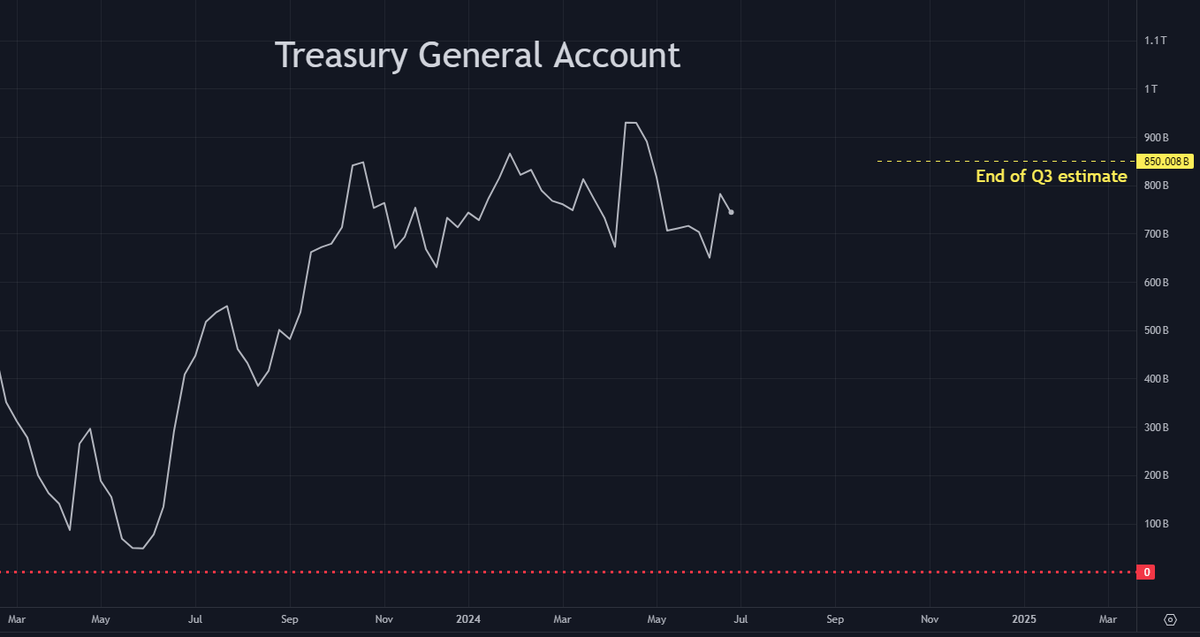
4. Treasury General Account – $100 billion liquidity drain
The Treasury General Account (TGA) is the government’s operating account at the Federal Reserve.
When cash sits idle in the TGA, it is effectively “frozen” and removed from circulation—making it aliquidity drain.
Conversely, when the Treasury spends money from the TGA, that cash re-enters the economy, thusinjecting liquidity.
Currently, the TGA holds around $750 billion. In its latest quarterly refinancing statement, the Treasury projects the TGA balance to reach $850 billion by the end of Q3. Taking this projection at face value, the TGA will grow further (draining liquidity), adding approximately $100 billion. Combined with QT’s $75 billion drain, this brings thetotal liquidity drain to $175 billion.
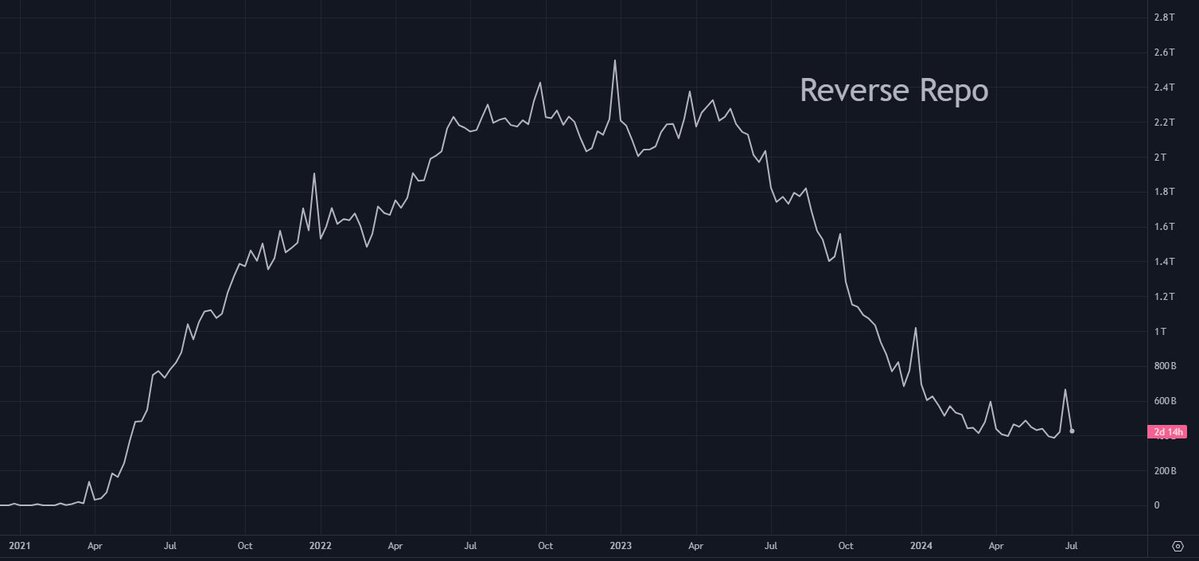
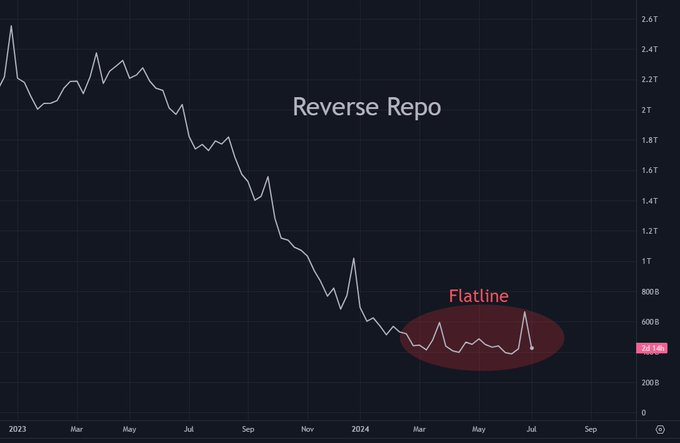
5. Reverse Repo – $200–400 billion liquidity injection
Reverse Repo (RRP) is a Fed tool where financial institutions parked cash during the loose monetary era of 2020–2021, earning a fixed return. By late 2022, about $2.5 trillion sat in reverse repo. Since both RRP and U.S. Treasury bills (T-bills) are short-term, risk-free assets, they are near-perfect substitutes.
To cover its large deficits, the U.S. government has issued massive amounts of T-bills over the past 18 months. With yields slightly higher than RRP, new T-bills have drawn roughly $2 trillion out of reverse repo [Chart 3]. This cash moved from the Fed’s “frozen” reserves back into active money markets—aliquidity injection.
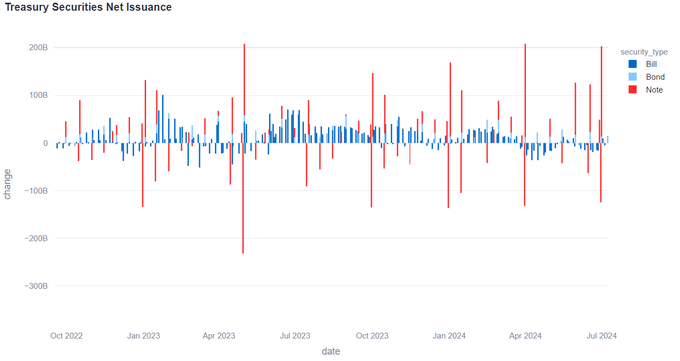
However, RRP stopped draining liquidity in Q2 2024, as the government temporarily paused heavy T-bill issuance. This slowdown is visible in a chart by @dharmatrade [Chart 5], showing net T-bill issuance far exceeding historical norms in 2023 and early 2024, then turning negative in Q2 2024.
But this pause in T-bill issuance will end in Q3 2024. As the government seeks to fill its fiscal “gap,” a fresh wave of T-bill issuance will resume. Given this incoming flood of supply, I expect $200–400 billion to flow out of reverse repo in Q3 (I acknowledge this range is wide), representing asignificant liquidity injection.
[Chart 3]
[Chart 4]
[Chart 5]
Therefore:
-
$200–400 billion liquidity injection (Reverse Repo)
-
$175 billion liquidity drain (QT + TGA)
-
Net liquidity injection between $25 billion and $225 billion
Revisiting the Treasury General Account
Let’s revisit the Treasury General Account (TGA). So far, our calculation suggests anet liquidity injection in Q3—based on the assumption that the TGA reaches $850 billion by quarter-end.
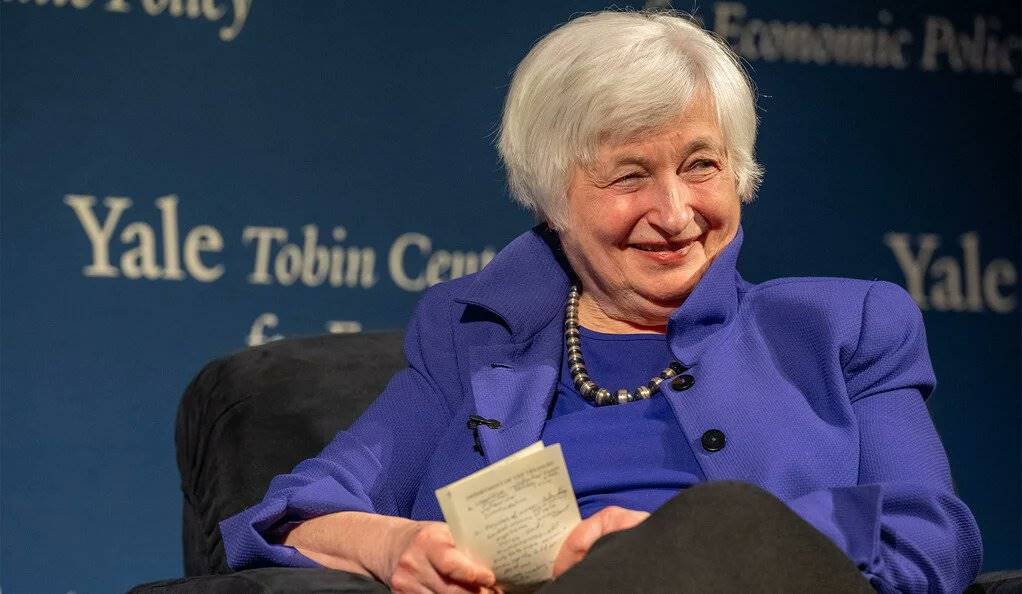
Earlier, I mentioned these TGA balance estimates should not be taken too seriously. Since Janet Yellen became Treasury Secretary, TGA forecasts have frequently been too high—sometimes significantly.
Thus, the actual TGA balance at the end of Q3 could easily fall short of $850 billion.
We already have a net liquidity injection range of $25–225 billion assuming a $850 billion TGA. Any shortfall in the actual TGA balance will shift this range upward.
Projection
Combining all factors, here is the projected range for net Fed liquidity by the end of Q3, including a buffer in case the TGA estimate proves inaccurate again:
One final note:
This analysis assumes no major changes during Q3.
However, low-probability events could still force the Fed to respond to financial system stresses or unexpected black swan events. These could include restarting the Bank Term Funding Program (BTFP), launching another emergency facility, halting QT, restarting QE, or taking any other action that rapidly injects additional liquidity into markets.
Join TechFlow official community to stay tuned
Telegram:https://t.me/TechFlowDaily
X (Twitter):https://x.com/TechFlowPost
X (Twitter) EN:https://x.com/BlockFlow_News


