Insight Data Issue 01 | AICoin & OKX: How to Quickly Sense the Crypto Market and Build a Data Methodology?
TechFlow Selected TechFlow Selected
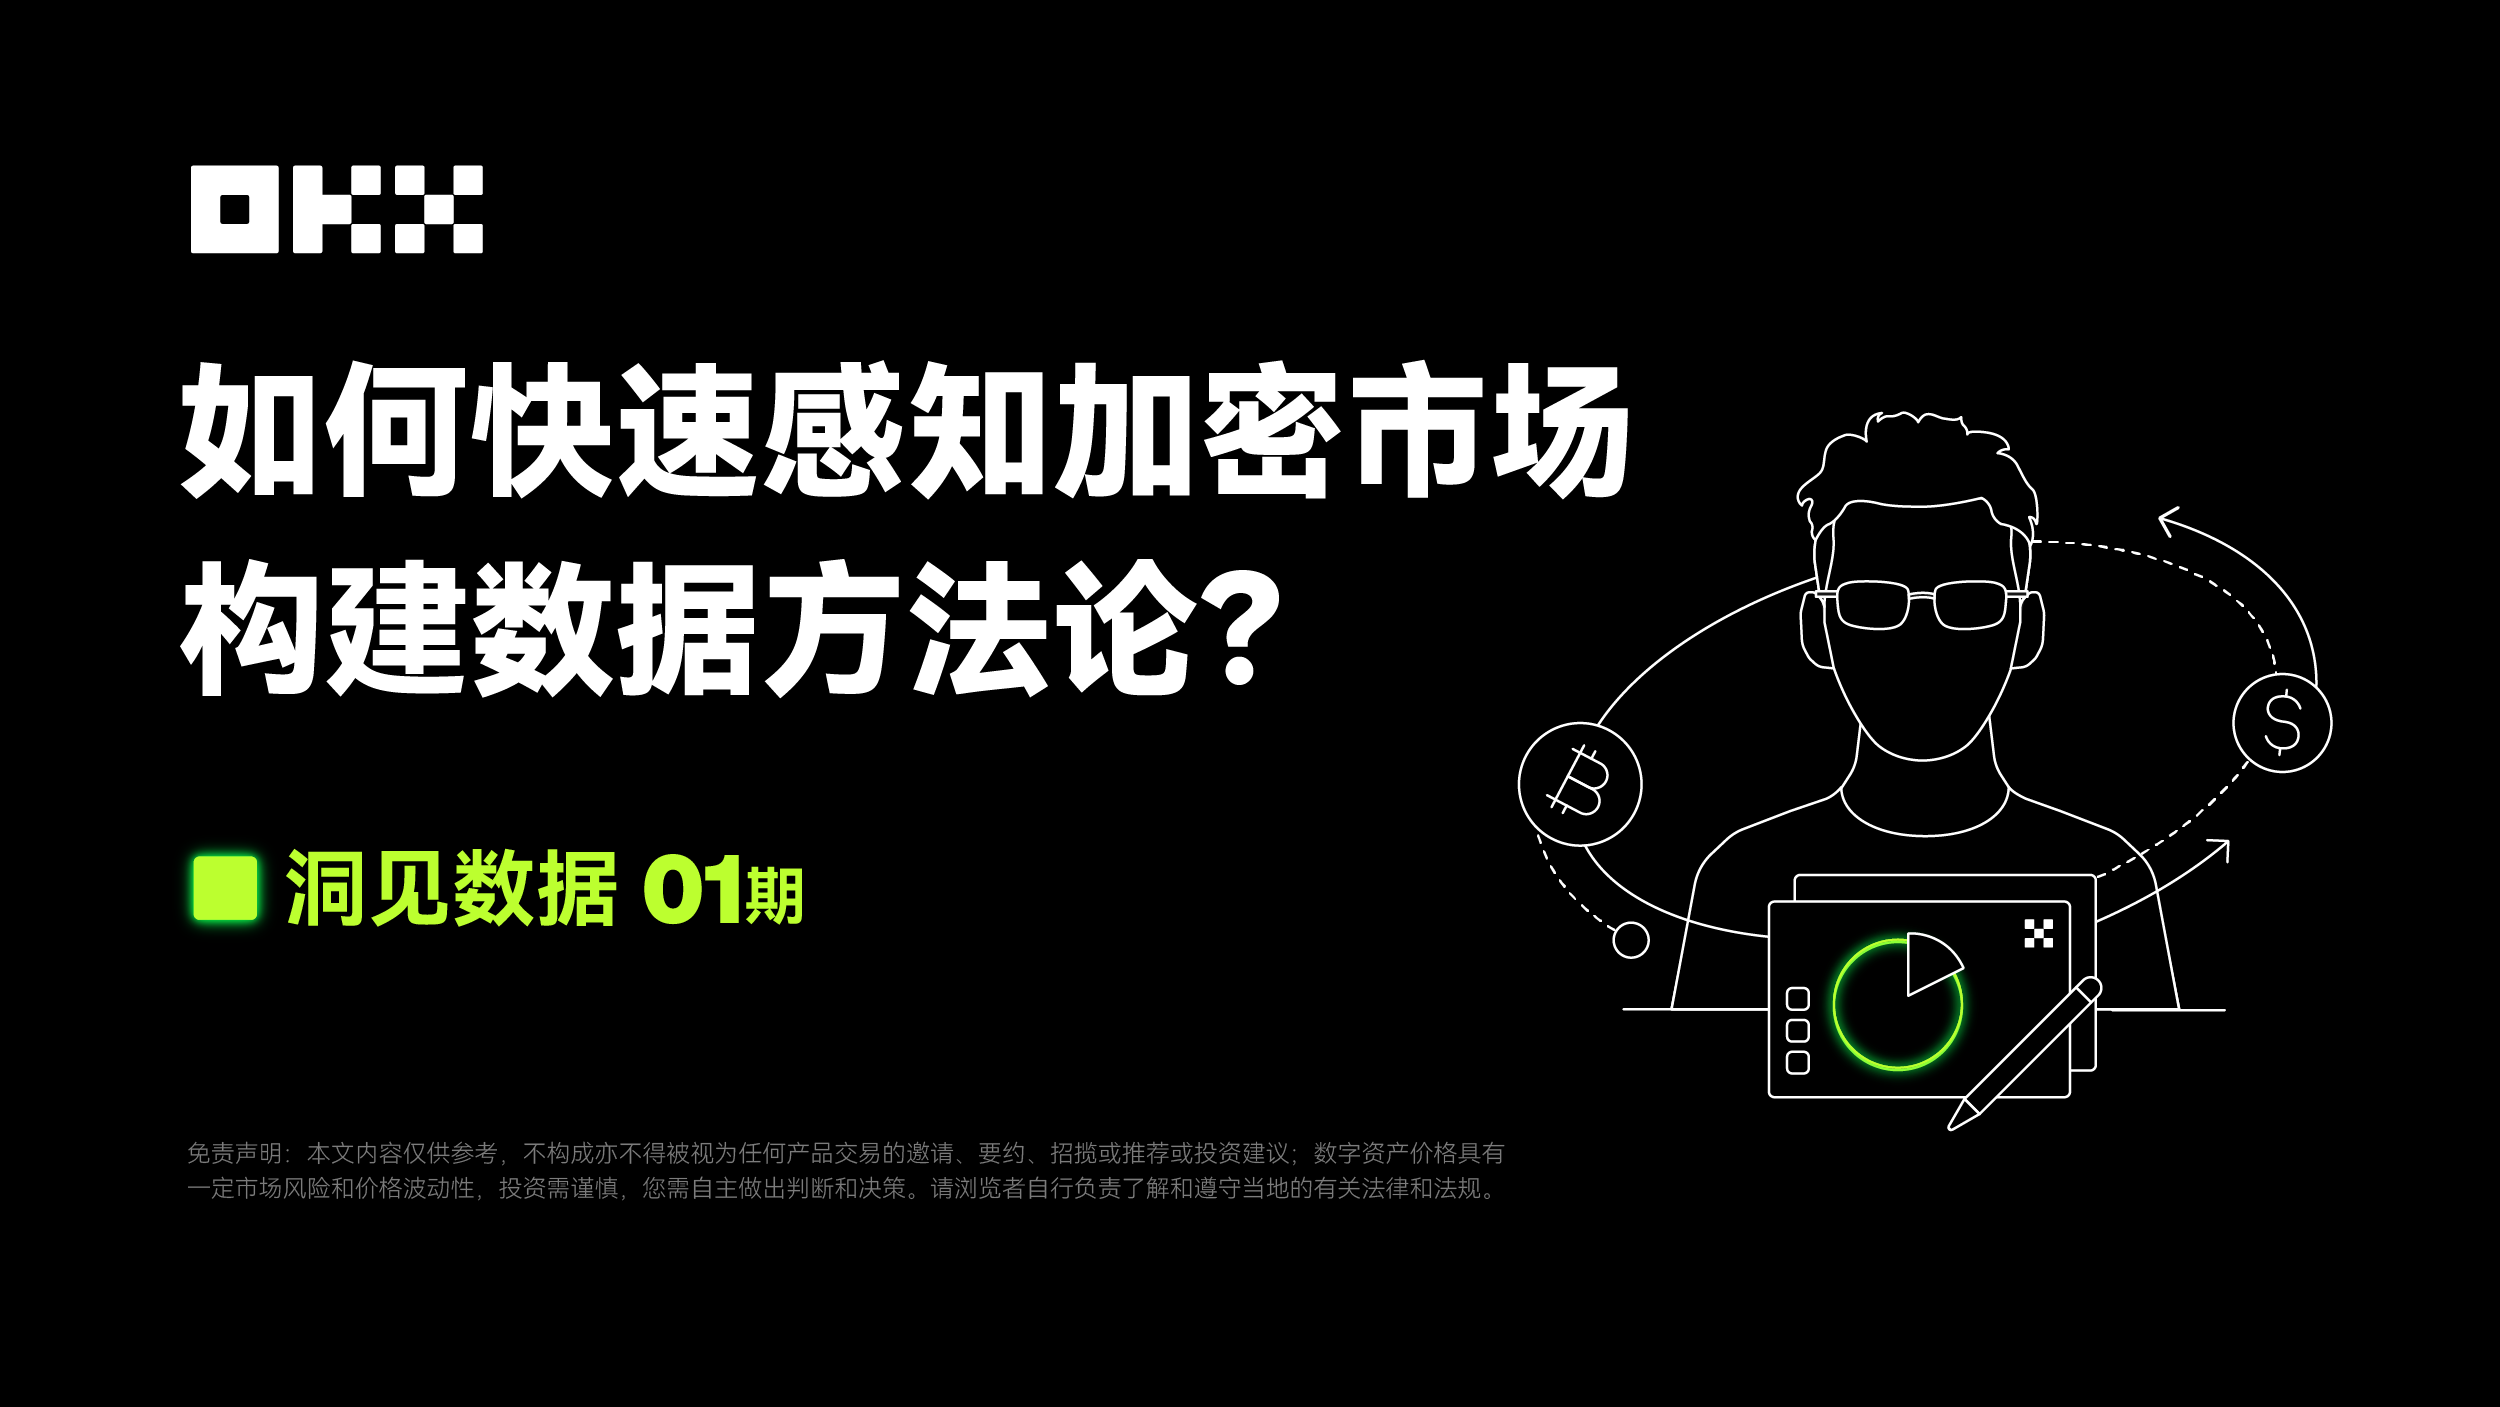
Insight Data Issue 01 | AICoin & OKX: How to Quickly Sense the Crypto Market and Build a Data Methodology?
The first episode of OKX's "Insights on Data" column focuses on core trading issues such as understanding market changes and establishing scientific trading strategies.
 Navigating Web3 tides with focused insights
Summary: In the cryptocurrency market, data has always been a key factor in making trading decisions. How can we cut through the noise and uncover effective data to optimize trading strategies? This is an ongoing topic of interest for the market. As part of a special initiative, OKX has launched the "Insights into Data" column, collaborating with leading data platforms such as AICoin and Coinglass. Starting from common user needs, we aim to develop a more systematic data methodology for reference and learning by the broader market.
Below is the first installment, jointly discussed by the OKX Strategy Team and AICoin Research Institute, focusing on perceiving market changes and building a “data” methodology, which we hope will be helpful to you.
OKX Strategy Team: The OKX Strategy Team consists of a group of experienced professionals dedicated to advancing innovation in global digital asset strategies. Drawing expertise from fields such as market analysis, risk management, and financial engineering, the team provides solid strategic support for OKX’s development based on deep domain knowledge and extensive practical experience.
AICoin Research Institute: Based on the AICoin platform, AICoin Research Institute is committed to providing Web3 users with in-depth data interpretation and investor education. AICoin is a Web3 data service provider offering comprehensive tools including market analytics, professional K-charts, signal-based trading strategies, asset management monitoring, and real-time news.
1. To promptly perceive market changes, which key data dimensions should one monitor at all times?
AICoin Research Institute: We believe the following dimensions can help investors better detect market shifts.
First, price volatility and trends. Start with the latest price—the real-time change most directly reflects current market sentiment. Next, price trends, typically measured using technical indicators such as MA, EMA, MACD, RSI, and various custom indicators developed by technical analysts.
Second, trading volume, including total volume and large transactions. Total trading volume efficiently measures overall market activity. Large transaction data reveals the behavior of major players—whales’ buying or selling may signal significant market moves. We have historically monitored and analyzed several key metrics made available to users for analysis and alerts, including institutional-sized orders, large trades, and chip distribution derived from CEX order book and trade data.
Third, fund flows. Net inflows and outflows help assess supply and demand dynamics within the market. Recent ETF net inflow data serves as a strong example—if substantial capital flows into ETFs, it suggests the market remains an expanding one. We collect and share this type of data with users. Additionally, exchange-level fund movements are critical to track, helping understand buy/sell pressure. Key references include large deposit/withdrawal activities and exchange wallet balances.
Fourth, market sentiment and social media dynamics. Monitor sentiment indices such as the Fear & Greed Index. We particularly recommend OKX's contract data metrics, such as long/short ratio by number of holders and elite traders’ average position ratios, which offer valuable insights into short- to medium-term market direction. As a leading CEX, OKX’s open access to such large-scale trading data holds significant reference value for the market.
Also, stay updated on social media and news outlets like Twitter, Reddit, and major industry publications, as they help capture shifts in market sentiment and emerging trends.
Fifth, on-chain transaction data—including number of transactions and active addresses—helps gauge on-chain activity levels. We recommend tracking changes in smart money addresses and tokens favored by community KOLs. For PoW-based assets like Bitcoin, hash rate and mining difficulty reflect miner confidence and network security. Two key factors stand out: the halving cycle, and the relationship between miner shutdown prices and coin prices.
Sixth, macroeconomic data and policy developments, including economic indicators such as U.S. non-farm payrolls and CPI, which help us understand broader economic trends. Moreover, regulatory changes across countries directly affect how crypto markets operate locally and serve as indicators of market expansion or contraction.
OKX Strategy Team: Perceiving market changes is crucial for users. We recommend monitoring at least the following four data dimensions:
First, price trends. Price movement is the most direct signal of market change. Users should monitor both short- and long-term trends, using technical indicators such as Moving Average (MA), Relative Strength Index (RSI), and Moving Average Convergence Divergence (MACD) to support decision-making.
Specifically:
• Moving Average (MA): Includes Simple Moving Average (SMA) and Exponential Moving Average (EMA), used to smooth price fluctuations and identify trend direction;
• Relative Strength Index (RSI): Measures the speed and magnitude of price changes, identifying overbought or oversold conditions. Typically, an RSI above 70 indicates overbought, below 30 indicates oversold;
• Moving Average Convergence Divergence (MACD): Identifies trend changes by calculating the difference between short- and long-term moving averages.
Second, market volatility. Volatility is a key indicator of market change and helps assess stability and potential investment risk. It can be measured via standard deviation or the VIX index. Alternatively, composite sentiment gauges such as the Fear & Greed Index—which incorporates volatility—can provide a more holistic view of market mood and potential swings.
Third, fund flows and trade distribution. Analyzing fund flows and trade distribution together allows quick understanding of overall capital movement and cost structure, enabling more accurate assessment of market sentiment, price volatility, and key support/resistance levels.
Fund flows are a vital metric for judging market sentiment. By tracking inflows and outflows, investors can grasp the direction of capital. Inflows refer to orders executed at or above the best ask price, while outflows are those at or below the best bid. Net inflow equals inflows minus outflows. Individual inflow amounts can be categorized by size—mega orders, large, medium, and small—for easier analysis.
Trade distribution shows the volume traded at different price levels, reflecting investor positioning. Analyzing this data reveals profit and loss status among holders. Comparing current price against historical trades identifies profitable vs. losing zones. Key metrics include profit ratio, average cost, resistance/support levels, 90% and 70% trading ranges, and range overlap. High overlap indicates concentrated trading activity and potentially limited price volatility. Tracking these metrics improves accuracy in forecasting market movements.
Fourth, fundamental data. For cryptocurrencies, fundamentals include project technological progress, tokenomics, partnerships, and regulatory developments.
2. Which indicators help users better capture shifts in macro trends?
AICoin Research Institute: Based on historical market patterns, we recommend the following macro indicators for deep tracking by crypto traders:
First, total market capitalization. This reflects the overall scale and health of the cryptocurrency market. Growth in total market cap usually signals broader market development and increasing participation.
Second, Bitcoin dominance (BTC Dominance), representing Bitcoin’s share of total crypto market cap. High BTC dominance often indicates reduced risk appetite, with investors favoring more stable assets, while lower dominance may suggest capital rotation into altcoins. We also track Ethereum dominance as another important comparable metric.
Third, on-chain activity data, primarily active addresses, transaction counts, and volumes. For Bitcoin, hash rate reflects network computational power and security, while miner revenue-cost balance indicates profitability—critical for assessing mining sector health.
Fourth, liquidity and trading volume, including trading volumes across exchanges during different periods and fund inflows/outflows. Monitoring capital movement into and out of exchanges—large inflows may signal rising selling pressure, and vice versa.
Fifth, stablecoin liquidity, mainly reflected in total market cap and circulation of stablecoins like USDT and USDC. Stablecoin inflows and outflows reveal underlying buy/sell pressure.
Sixth, market sentiment indices, notably the Crypto Fear & Greed Index and OKX’s proprietary trading big data metrics.
Seventh, DeFi data. Total Value Locked (TVL) in DeFi protocols reflects the size and growth trajectory of the DeFi market.
Eighth, derivatives market data. Key metrics include open interest in futures and options markets, indicating participants' expectations and risk exposure. Funding rates, especially in perpetual futures, show the balance between long and short positions. Rates and spreads guide institutional arbitrageurs, who help correct pricing inefficiencies and add liquidity to the market.
Ninth, U.S. economic data such as CPI and Non-Farm Payrolls. These influence Federal Reserve interest rate policies and help forecast overall capital flow directions in financial markets.
OKX Strategy Team: We suggest users consider the following five key dimensions:
First, total cryptocurrency market cap. This is a vital indicator of market size and trend. Changes reflect overall market health and investor confidence. Sustained growth typically signals a bull market, while declines indicate bearish sentiment.
Second, overall market volume. Trading volume reflects market activity. High volume often accompanies strong sentiment and sharp price moves. Analyzing volume trends helps determine strength of momentum and identify peaks and troughs.
Third, BTC/ETH market share. The dominance of Bitcoin and Ethereum reveals structural shifts. Rising dominance suggests capital concentration in major coins—often seen as a risk-off signal. Falling share may indicate increased exploration of altcoin opportunities.
Fourth, ETF fund flows. Inflows and outflows from crypto ETFs reflect institutional sentiment. Heavy inflows suggest bullish outlooks, while outflows may signal weakening confidence. Tracking ETF flows aids in assessing medium- to long-term trends.
Fifth, economic calendar. This includes key events and data releases such as GDP, inflation, and interest rate decisions. Macroeconomic factors significantly impact crypto markets. Rising rates may trigger outflows from risky assets, whereas heightened uncertainty could drive demand for cryptos as hedges. Monitoring the economic calendar helps anticipate macro shifts.
3. Timing is critical to success—what data helps capture optimal entry and exit points?
AICoin Research Institute: This can be broken down into stages:
First, entry phase: Recommended indicators include:
• EMA: Crossovers between short-term (e.g., 12-day) and medium-term (e.g., 26-day) EMAs signal opportunities—e.g., a “golden cross” when the short-term line crosses above the long-term line;
• RSI: Readings below 30 often indicate oversold conditions, suggesting potential buying opportunities;
• Bollinger Bands (BOLL): When price touches the lower band and shows signs of rebounding, it may serve as a buy signal;
• There are numerous technical indicators with rich applications—each can be a deep field in itself. Investors should choose those that suit their style;
• Additional data points: trading volume, active/new addresses, on-chain transaction count, and movements of large institutional orders.
Second, take-profit and stop-loss phase: Consider the following:
• Fibonacci retracement levels—such as 38.2%, 50%, and 61.8%—can guide setting take-profit and stop-loss points;
• EMA: A break below key moving averages (e.g., 120-day or 250-day) may act as a stop-loss signal;
• RSI: Readings above 70 often indicate overbought conditions, signaling time to consider taking profits.
Additionally, data-driven exits should consider volume trends, large transfer patterns, and declining network activity—sharp drops in on-chain transactions and active addresses may signal waning interest, prompting stop-loss actions. Regulatory updates or negative news also carry significant weight. Lastly, we recommend robust risk management: set clear profit-taking and stop-loss levels, use dollar-cost averaging to smooth entry prices and reduce risk per trade, and conduct regular reviews to refine your strategy.
OKX Strategy Team: We believe position bias, basis, and technical indicators offer strong predictive value.
Position bias (Long/Short Ratio) reflects the balance between bullish and bearish market participants. A high long ratio suggests optimistic sentiment and buying inclination; a high short ratio reflects pessimism and selling tendency. Analyzing this ratio helps identify prevailing trends and optimal timing for entries.
Basis refers to the difference between futures and spot prices. It can be positive (futures > spot) or negative (futures < spot). A positive basis (contango) usually signals expectations of future price increases, while a negative basis (backwardation) suggests anticipated declines. Basis helps monitor sentiment and design arbitrage strategies—rapid widening may indicate bullish bias, while sharp narrowing hints at bearishness.
Technical indicators – Overbought/Oversold: Tools like RSI and Stochastic Oscillator help identify extreme market conditions. RSI above 70 may signal overbought markets prone to pullbacks; below 30 may indicate oversold conditions with rebound potential. These help time entries during emotional extremes.
Finally, reward/risk tools help visualize and manage potential gains and losses per trade. Users can set take-profit and stop-loss levels to calculate risk-reward ratios, enabling rational exit planning.
4. What data should large-capital investors analyze to build scientific and robust trading strategies?
AICoin Research Institute: The answer depends on investment goals and tolerance for drawdown risk. Here’s a brief overview of arbitrage metrics suitable for large funds:
• Monitor term structure arbitrage opportunities such as futures-spot (basis) and inter-futures (calendar spread) discrepancies;
• Track cross-exchange price differences for the same asset, considering timeliness and execution feasibility;
• Watch funding rate arbitrage opportunities in perpetual contracts;
• Explore on-chain vs. off-chain arbitrage possibilities;
• Assess market depth and open interest to determine whether the market can absorb large trades without excessive slippage;
• Prioritize exchange stability—platforms like OKX, as top-tier exchanges, are better equipped to handle large-scale arbitrage operations.
Currently, AICoin offers multi-dimensional data analysis and alert systems for arbitrageurs, aiming to provide actionable insights for traders.
OKX Strategy Team: From our observation, large-capital investors typically adopt diversified asset allocation. Common tools include dollar-cost averaging (DCA), portfolio arbitrage, and large-order slicing. DCA reduces average holding costs through periodic purchases; portfolio arbitrage mitigates risk via hedging; and large-order slicing minimizes market impact and transaction costs by breaking big orders into smaller ones. Combining these strategies enables large investors to efficiently diversify and achieve stable returns.
Dollar-Cost Averaging (DCA) involves regularly purchasing multiple cryptocurrencies at fixed intervals to lower average entry cost. By consistently buying in dips and selling at peaks, this cyclical approach enables continuous profit-taking.
Portfolio Arbitrage is designed to hedge risks and lock in profits. It simultaneously executes trades across different or identical assets/markets, leveraging price divergences and market oscillations to automatically realize gains. This strategy effectively reduces potential losses amid market uncertainty.
Large-Order Slicing is a convenient tool for institutional traders. It splits large orders into smaller ones and places them incrementally. Through intelligent algorithmic settings, this strategy minimizes market impact while maintaining a relatively high average fill price, significantly reducing trading costs for large-volume participants.
Conclusion
This concludes the first episode of OKX’s "Insights into Data" series, focusing on core trading challenges such as detecting market shifts and building scientific trading strategies. We aim to offer traders a systematic data methodology to better sense market rhythms and make informed decisions. In upcoming articles, we will continue exploring practical data usage and analytical methods, providing guidance tailored to traders with diverse investment preferences.
Risk Warning and Disclaimer
This article is for informational purposes only. The content represents the authors’ opinions and does not reflect the views of OKX. This article is not intended as (i) investment advice or recommendation; (ii) an offer or solicitation to buy, sell, or hold digital assets; or (iii) financial, accounting, legal, or tax advice. Holding digital assets—including stablecoins and NFTs—involves high risk and may experience significant price volatility. You should carefully consider whether trading or holding digital assets is suitable for you based on your financial situation. For specific advice, please consult your legal/tax/investment professionals. You are solely responsible for understanding and complying with applicable local laws and regulations.
Join TechFlow official community to stay tuned
Telegram:https://t.me/TechFlowDaily
X (Twitter):https://x.com/TechFlowPost
X (Twitter) EN:https://x.com/BlockFlow_News
 OKX
OKX