Analyzing the surge in Bitcoin market liquidity: Insights from long-term and short-term holder behavior
TechFlow Selected TechFlow Selected
Analyzing the surge in Bitcoin market liquidity: Insights from long-term and short-term holder behavior
The combination of long-term and short-term holder groups, along with their profit and loss behaviors, also signals a potential shift in market trends.
Author: Chloe, PANews
On March 14, Bitcoin's price broke its all-time high (ATH) at $73,750.07, marking a pivotal moment in the market and signaling Bitcoin’s entry into a new, uncharted territory—the "price discovery" phase. Michael Novogratz, founder and CEO of Galaxy Digital, noted that the market has already absorbed a significant number of new investors.
Rising Market Liquidity
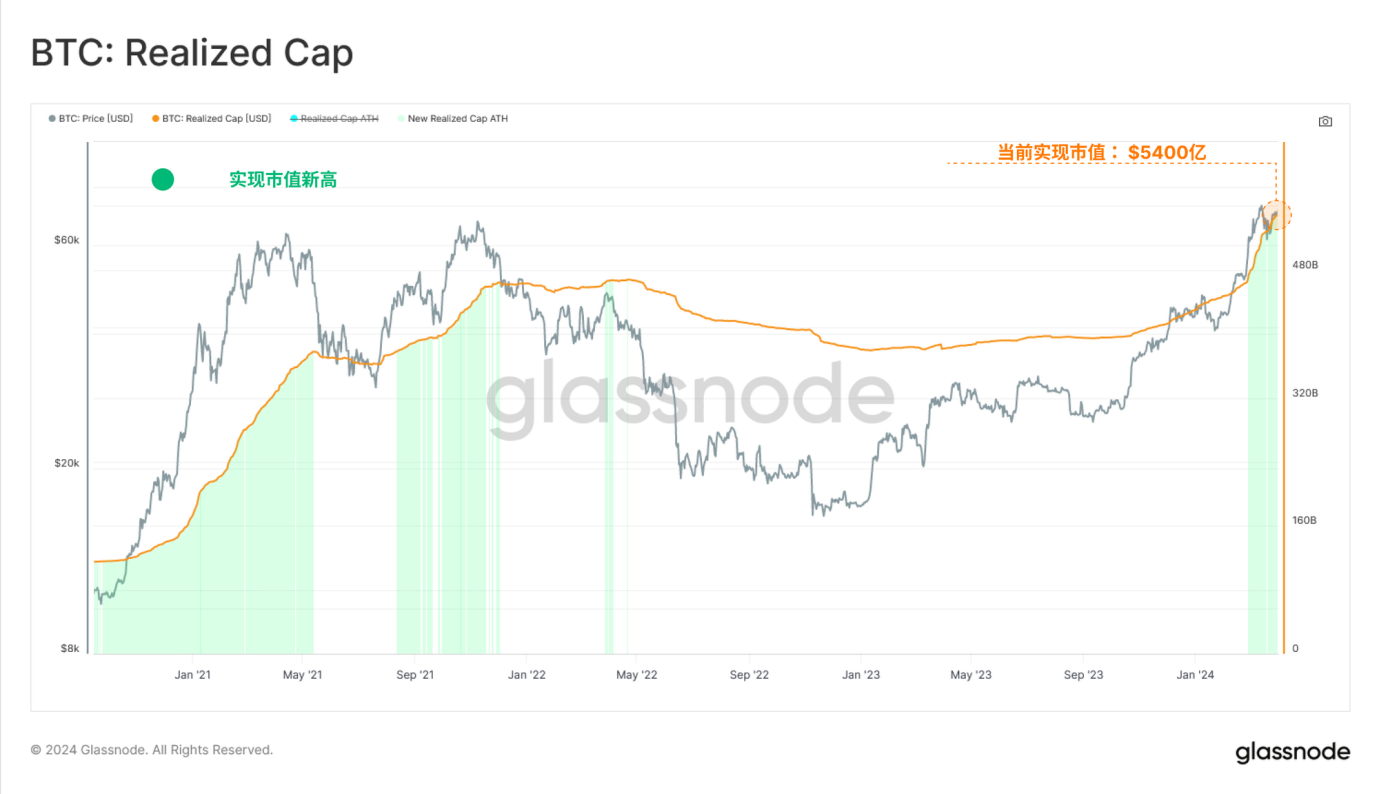
Glassnode recently pointed out that current market prices are prompting large-scale selling to realize profits, causing sold Bitcoins to be revalued from lower to higher cost bases. When these coins change hands, it also reflects new demand and liquidity injected into the asset class. This mechanism is highlighted through realized market cap—a metric tracking the cumulative dollar liquidity “stored” within the asset. The realized market cap has now reached a record high of $540 billion, growing at an unprecedented pace of over $79 billion per month.
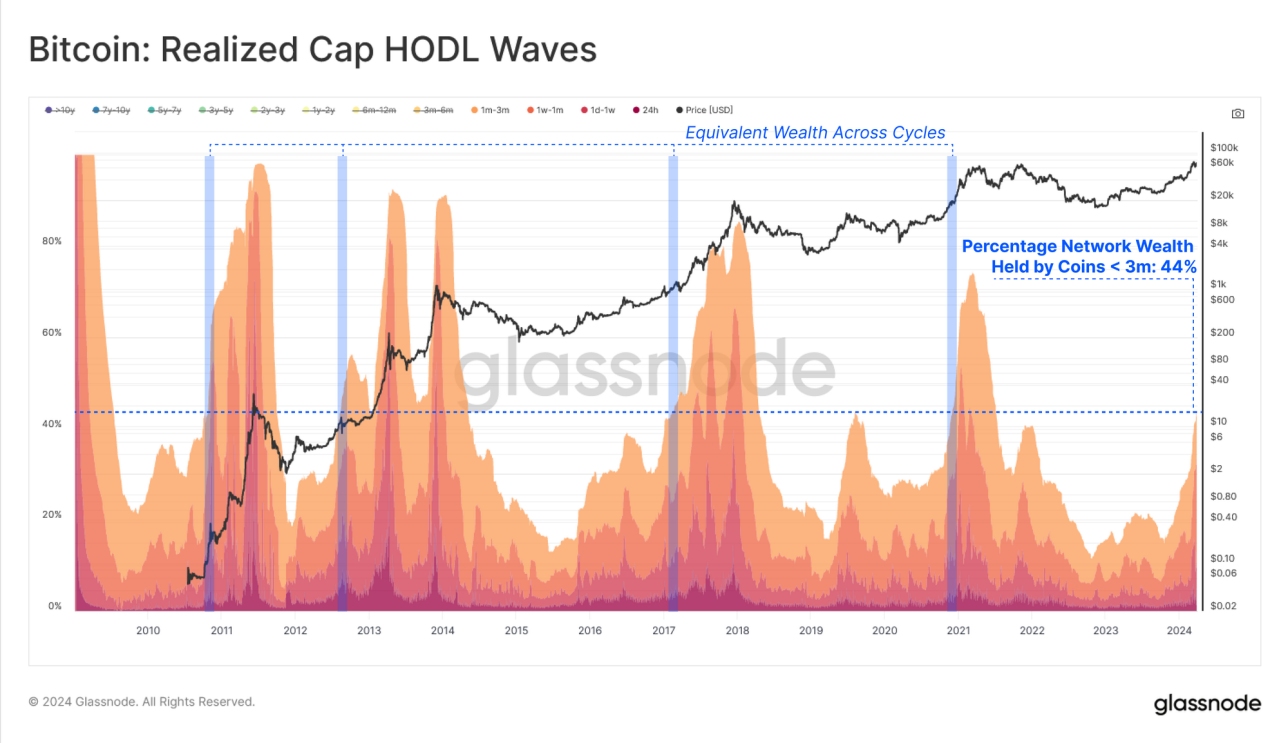
Focusing only on holders who have held Bitcoin for no more than three months, we see a sharp increase in recent months—new market entrants (those who bought and held BTC for under three months) now control approximately 44% of the total Bitcoin supply. This growing share directly reflects long-term holders selling their holdings at higher prices to meet rising new demand. It also underscores shifts in Bitcoin’s wealth distribution and the significantly increased proportion of network wealth controlled by new investors.
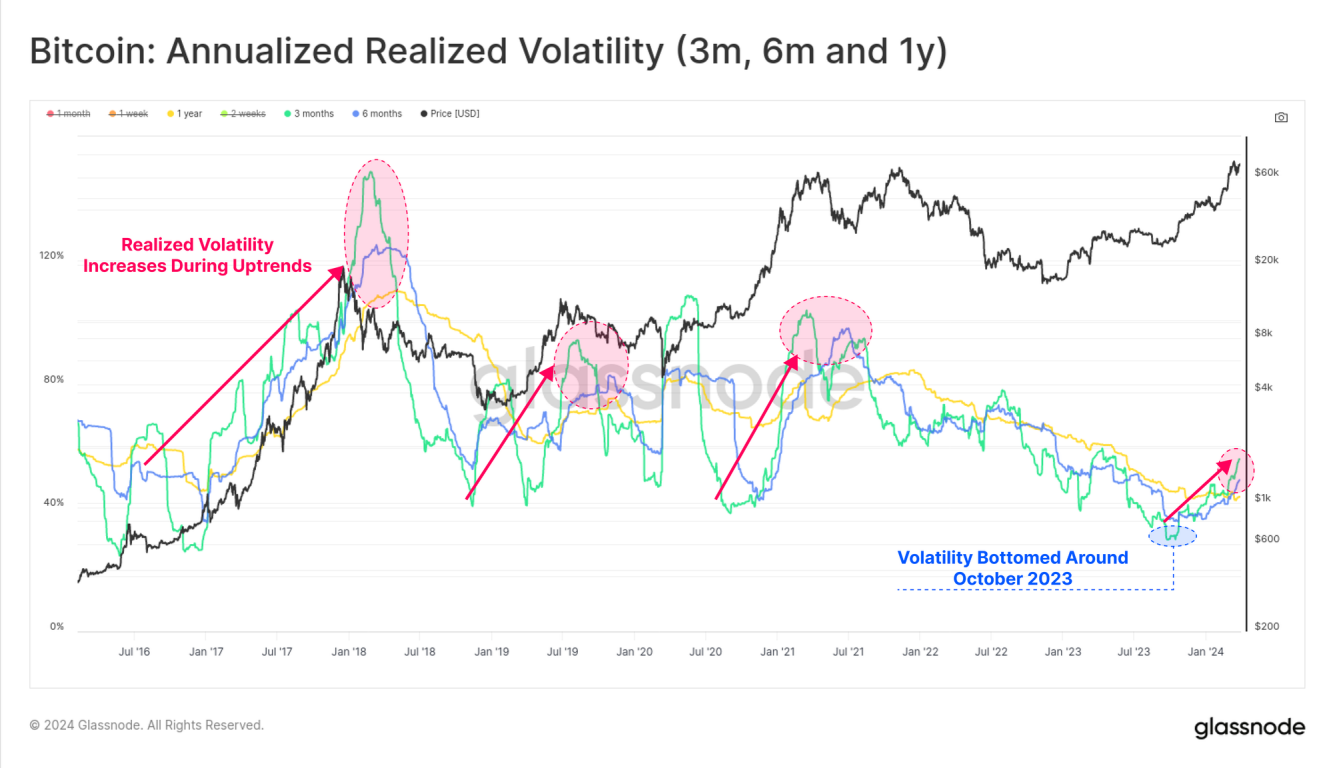
In previous Bitcoin cycles, surges in new demand typically signaled heightened speculative interest and often led to greater market volatility—a hallmark of macro-level upward trends in past cycles.
Since volatility bottomed in October 2023 (bottom right of chart below), the 90-day realized volatility has nearly doubled—from 28% to 55%, coinciding with an accelerating inflow into realized market cap.
Market Recovery Begins
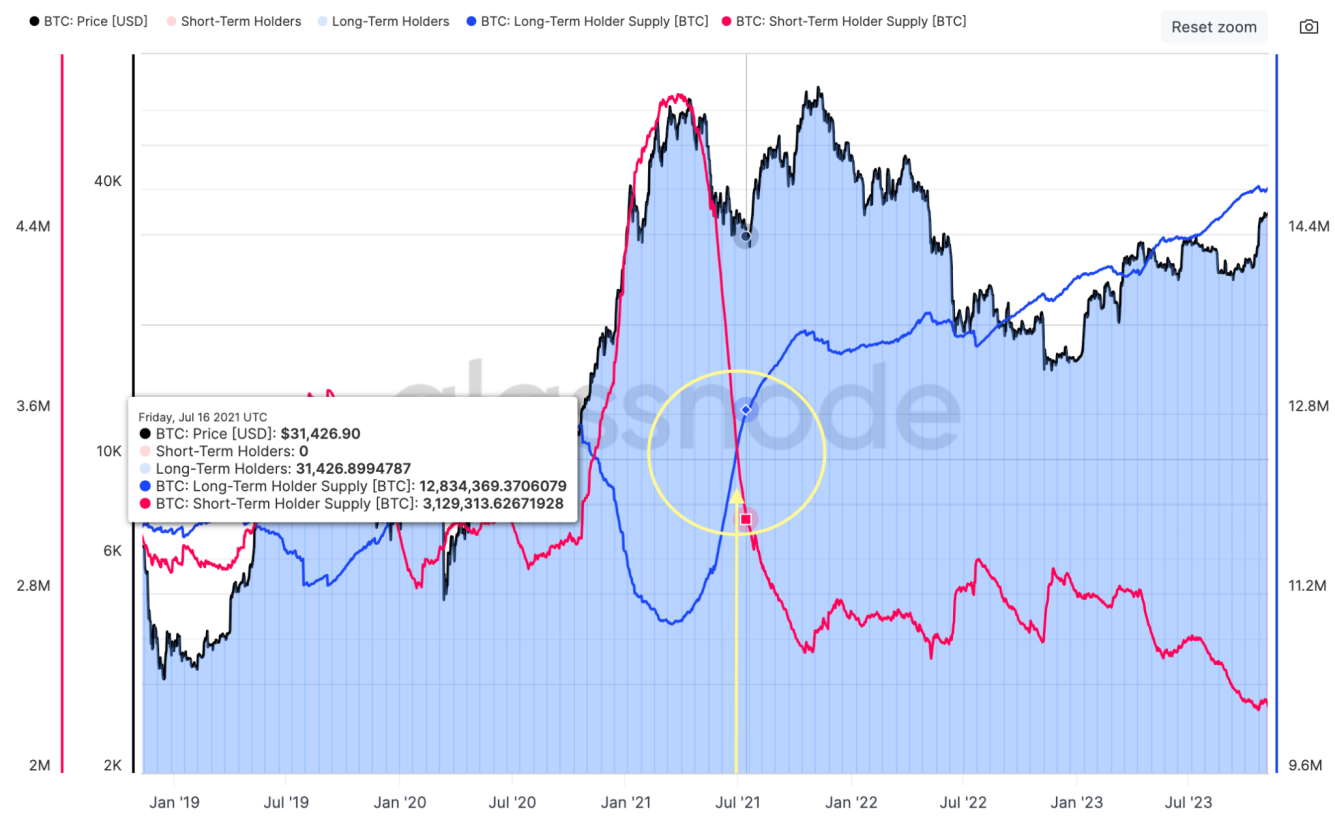
Following last year’s historic supply contraction (yellow zone in chart below), a strong divergence emerged between long-term holders (blue line) and short-term holders (red line). Long-term holder supply approached an all-time high, while short-term holder supply was effectively at a historical low, highlighting increasing scarcity of available BTC supply.
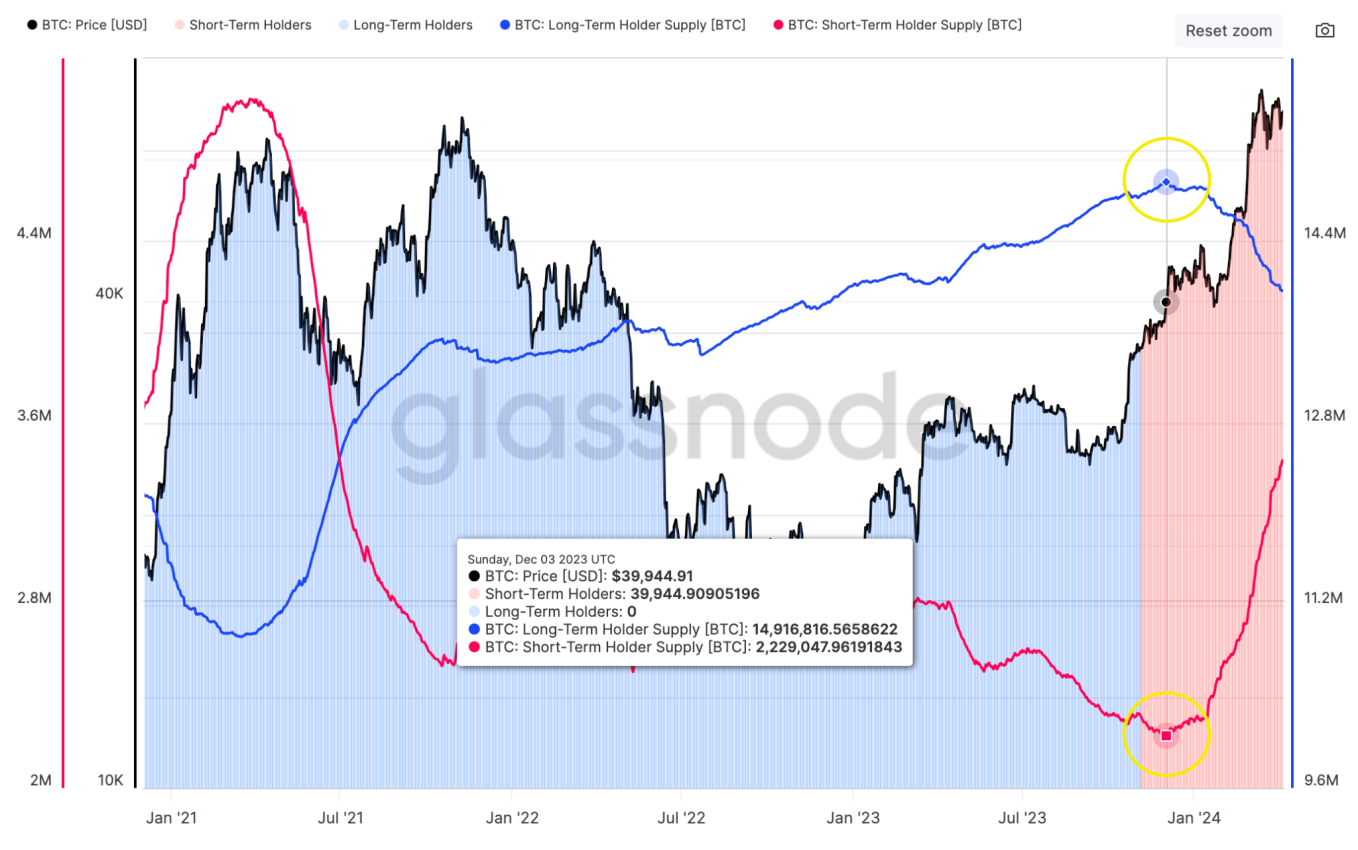
Today, however, this gap between long- and short-term holder supply is beginning to narrow. As prices rise, unrealized profits grow, encouraging long-term holders to sell portions of their holdings.
According to Glassnode data, since peaking at 14.916 million BTC in December 2023, long-term holder supply has decreased by 900,000 BTC—a significant shift. Outflows from GBTC accounted for about one-third of this decline (approximately -286,000 BTC).
PANews believes this outflow reflects substantial capital exiting GBTC, potentially increasing market supply as investors convert GBTC shares into Bitcoin or cash. This partly explains the notable drop in long-term holder supply, with GBTC outflows being a key contributing factor.
Conversely, short-term holder supply has increased by 1.121 million BTC, absorbing selling pressure from long-term holders and acquiring an additional 121,000 BTC from secondary markets via exchanges. This dynamic illustrates a structural shift in the market and highlights how different investor behaviors impact Bitcoin supply and pricing.
From the above information, we can conclude that investor behavior has clearly changed as the market reaches new highs. With rising new demand, selling pressure from long-term holders at elevated price levels appears to be accelerating. While newly approved ETFs represent an important new element in market structure, similar patterns have been evident in on-chain data across all prior cycles.
Glassnode further analyzed Bitcoin holdings acquired above $60,000. As shown in the chart below, approximately 1.875 million BTC—9.5% of the current circulating supply—were purchased at prices exceeding $60,000.
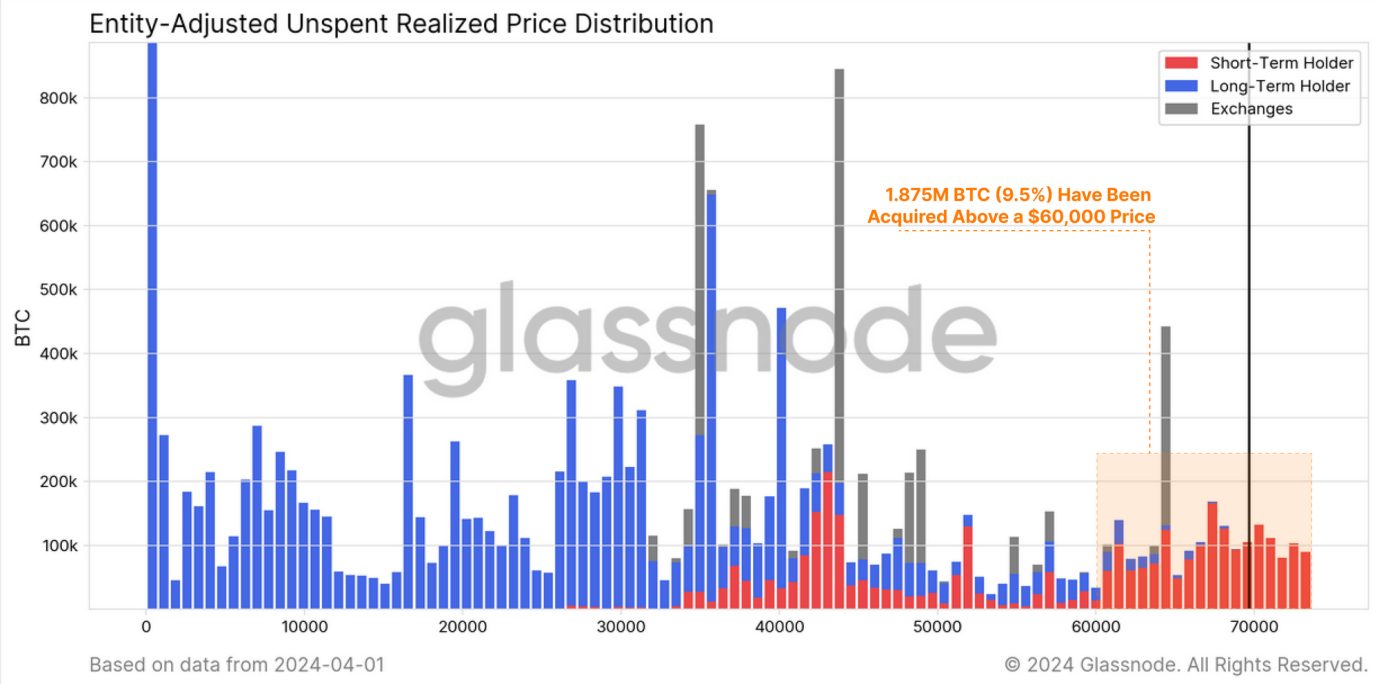
The red segment indicates that most of these coins are now held by short-term holders, suggesting a significant portion of Bitcoin was bought at high prices recently. Additionally, about 508,000 BTC are held in U.S. spot ETFs (excluding GBTC), which are categorized under short-term holders because ETF investors typically seek short-term gains rather than long-term holding.
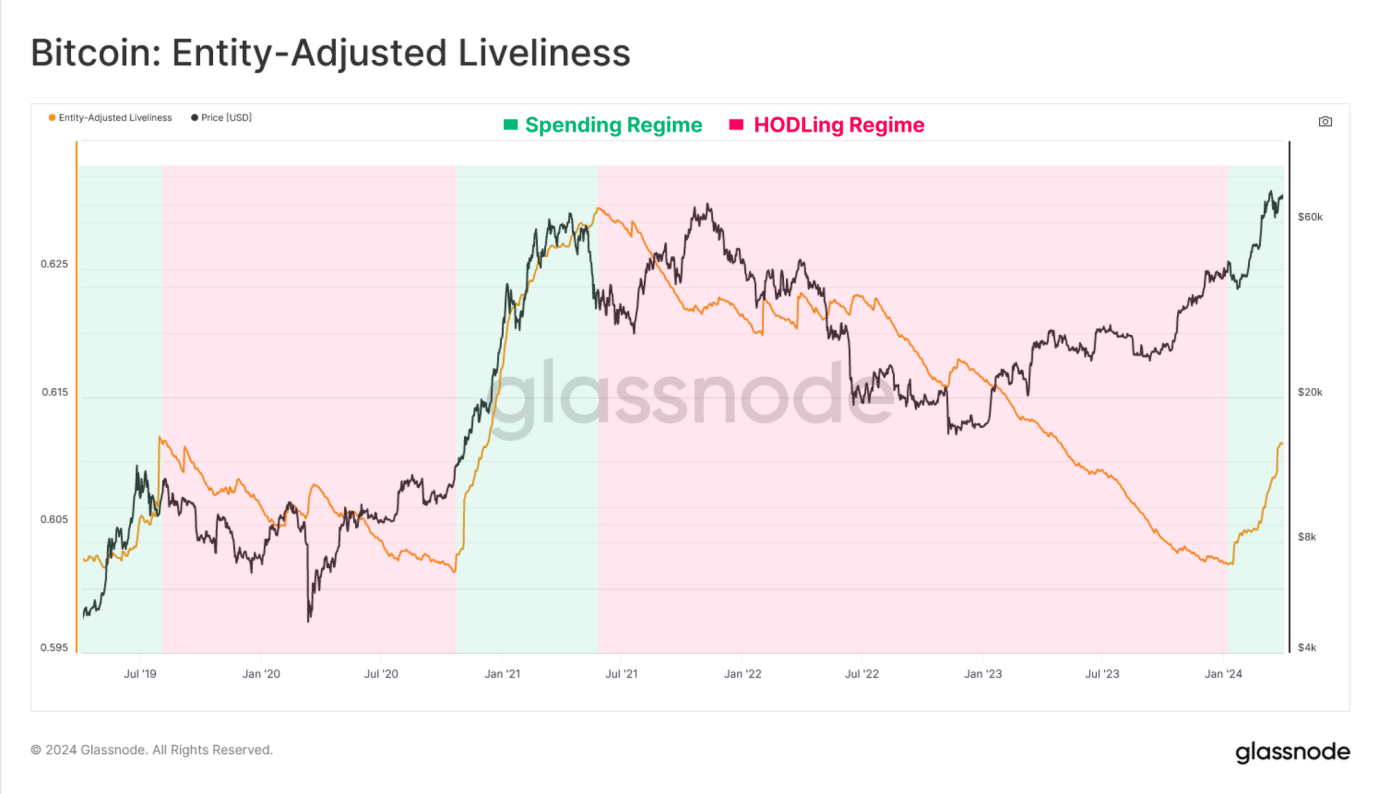
We can also examine the activity metric below, which measures the overall balance of “holding duration” across Bitcoin supply. A sustained rise in activity (orange line) means the volume of Bitcoin being sold—particularly long-dormant coins—exceeds the volume of newly purchased and long-held Bitcoin. This trend suggests that, overall, more Bitcoin is being used to realize profits rather than being held long-term (HODLed).
Taken together, the current market state leads to a clear conclusion: the Bitcoin market has transitioned into a phase primarily driven by selling and profit-taking. PANews believes this shift reflects the growing influence of short-term holders and changing Bitcoin trading behaviors—patterns especially critical for understanding both short- and long-term market trends when prices reach new highs.
Analyzing Market Behavior of Long-Term vs. Short-Term Holders Through Metrics
Understanding the behavior of long-term and short-term holders is crucial for identifying supply-demand equilibrium and capturing market trends. Using on-chain metrics provided by Glassnode, we’ll explore how specific indicators offer insights into market dynamics and value.
First is the "Realized Profit-to-Loss Ratio," a key indicator for spotting market turning points. This ratio oscillates around a neutral value of 1 on a nonlinear scale, making it ideal for identifying inflection points. During bull runs, a sharp increase in realized losses may indicate buyers at the peak are panic-selling, signaling a potential market reversal.
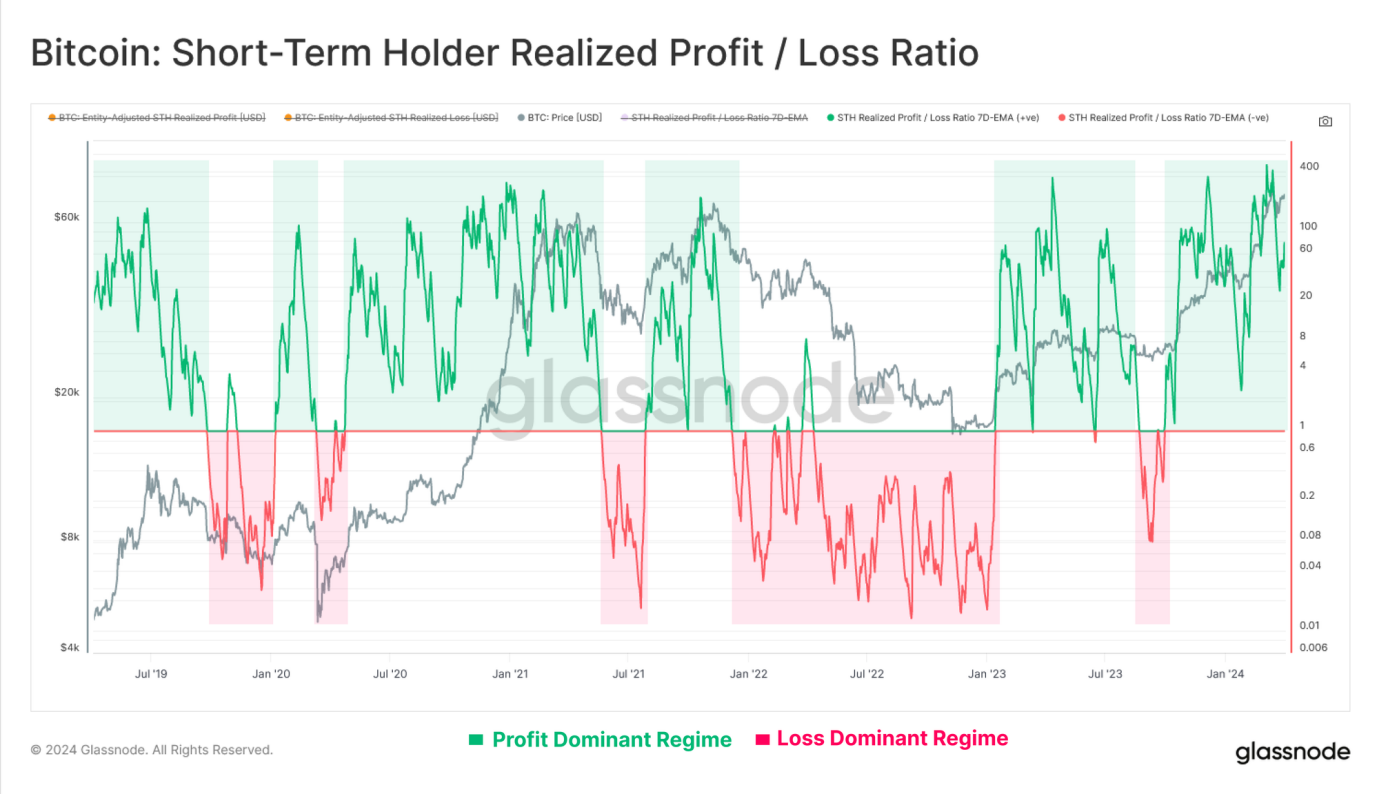
Starting with short-term holders, we observe their profit-to-loss ratio remains firmly in positive territory—short-term holders are realizing roughly 50 times more profit than loss. The ratio fluctuates around the 1.0 equilibrium, indicating that during price pullbacks, investors generally preserve profitability and avoid realizing losses by maintaining their positions.
Simply put, a ratio above 1 means short-term holders are realizing more profit than loss when selling Bitcoin. A significantly high ratio—far exceeding 1—indicates far more profitable sellers than those at a loss.
In the chart above, green zones reflect profit dominance, while red zones indicate significant realized losses. Generally, if the ratio stays above 1 after a price rally and correction, it signals market health—most participants remain profitable even amid volatility.
For deeper insight, comparing this ratio with Bitcoin’s price trend helps assess market sentiment and potential reversals. For example, if price hits new highs while the ratio declines, a correction may be imminent. Conversely, falling prices accompanied by a rising ratio could signal an upcoming rebound.
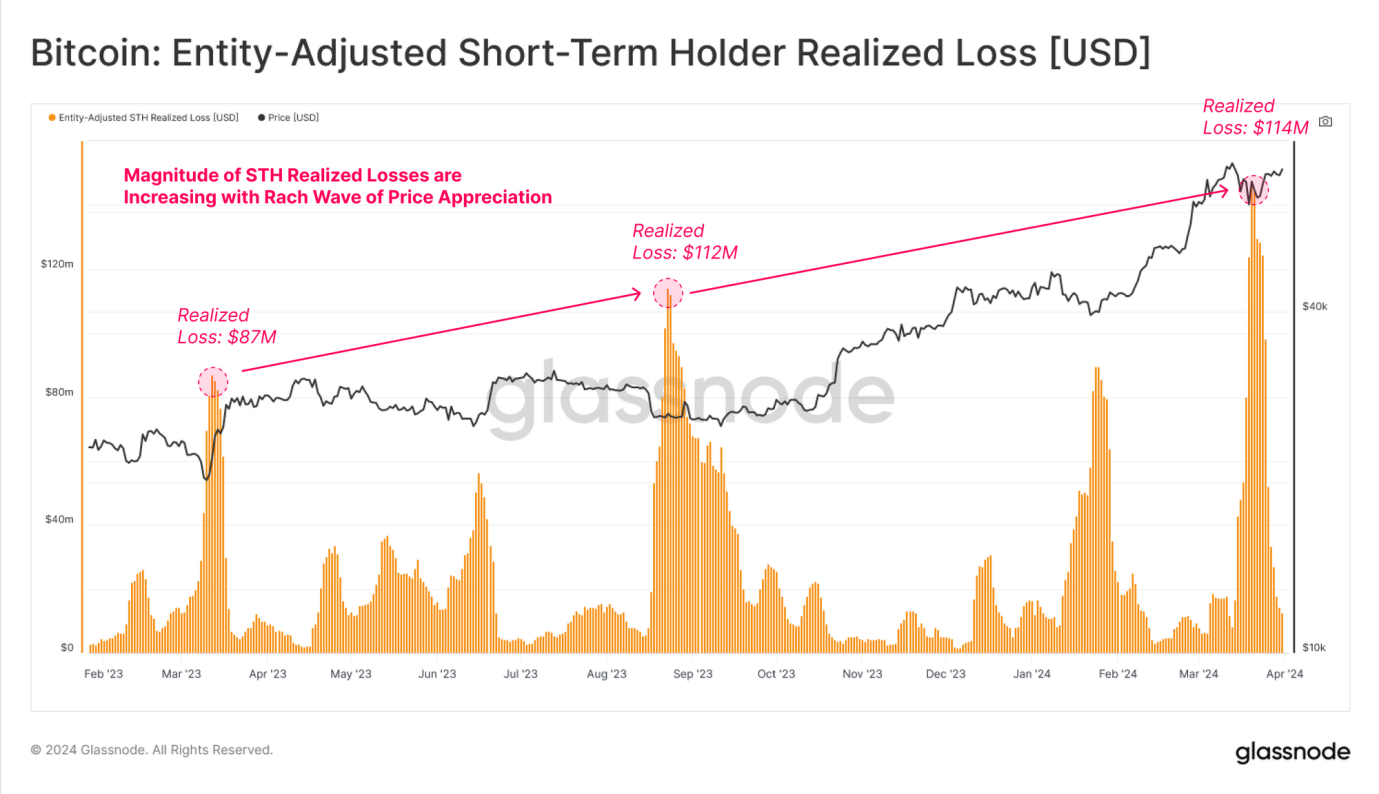
As seen in the next chart, during market corrections, short-term holders show clear spikes in realized losses—suggesting recent buyers are rushing to sell amid fears of further downside (panic selling).
Moreover, each subsequent market dip sees an increase in the magnitude of realized losses, indicating that the number and size of “top buyers” drawn in by each rally are growing.
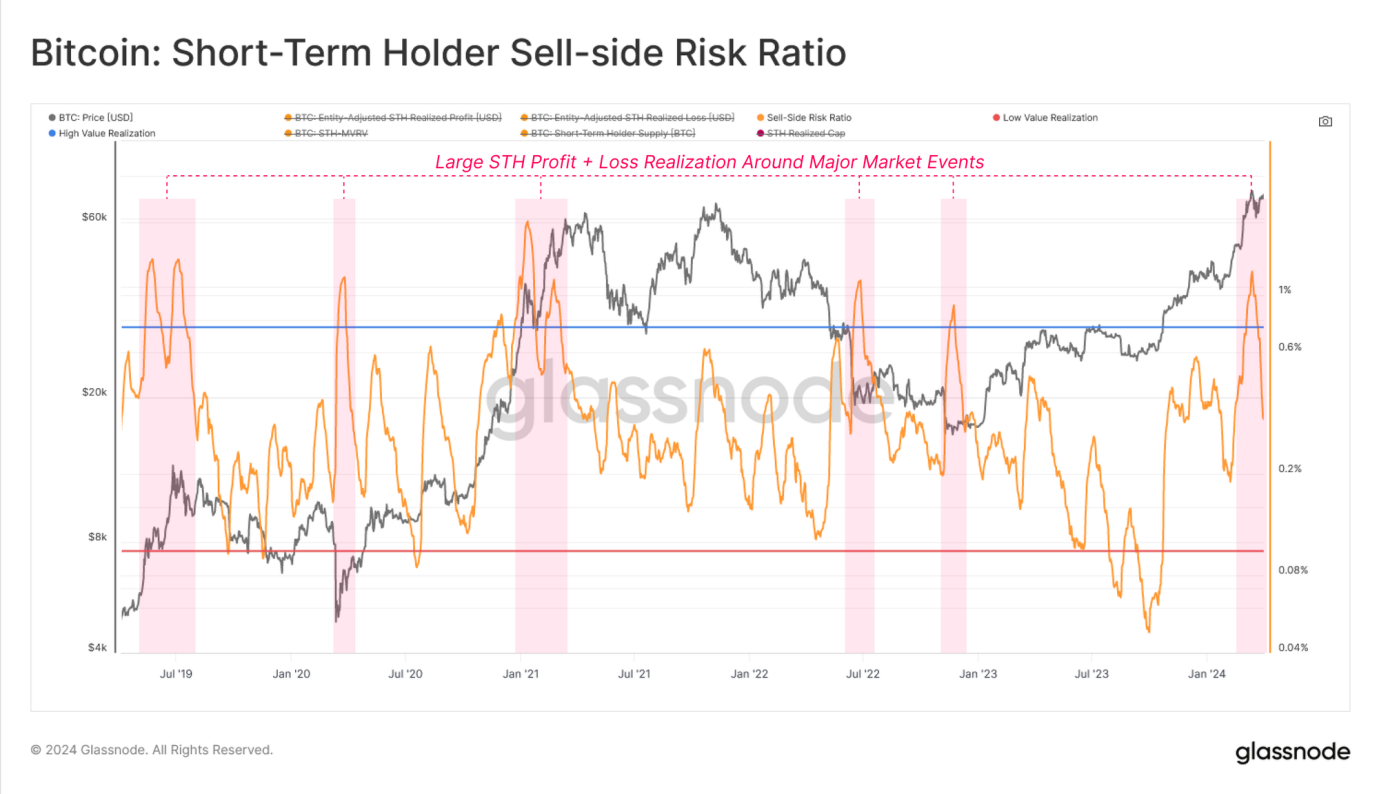
Next is the "Sellers’ Yield Ratio," which evaluates the relative scale of profit and loss events, helping understand market momentum and its impact on total market size—especially near new all-time highs.
High values suggest short-term holders are transacting at prices significantly above or below their cost basis, indicating the market may need to reestablish equilibrium—often accompanied by sharp price swings. Low values mean most sold Bitcoin is close to its break-even cost, signaling market balance where profit-taking and loss realization have been exhausted—typically seen in low-volatility environments.
After Bitcoin surpassed $70,000, the short-term holder seller risk ratio spiked sharply—a pattern commonly observed near market turning points (both global and local). This usually indicates a new equilibrium hasn’t formed yet, and as the market adjusts and consolidates, the metric undergoes rapid correction.
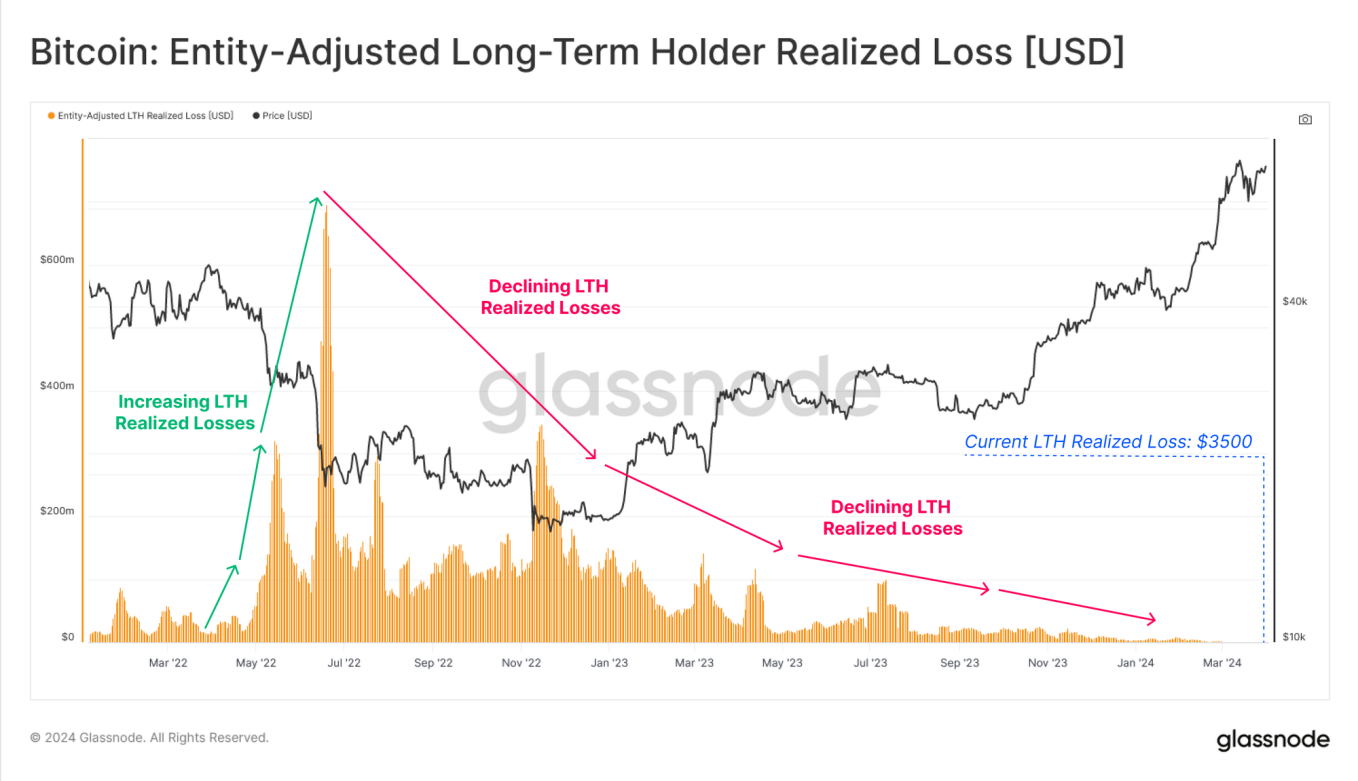
Regarding long-term holders, the chart below shows their realized profit-to-loss ratio has risen exponentially and vertically. By definition, this occurs because there are no long-term holders in loss when the market just breaks past the prior cycle peak—an effect further amplified by increased profit-taking among long-term holders.
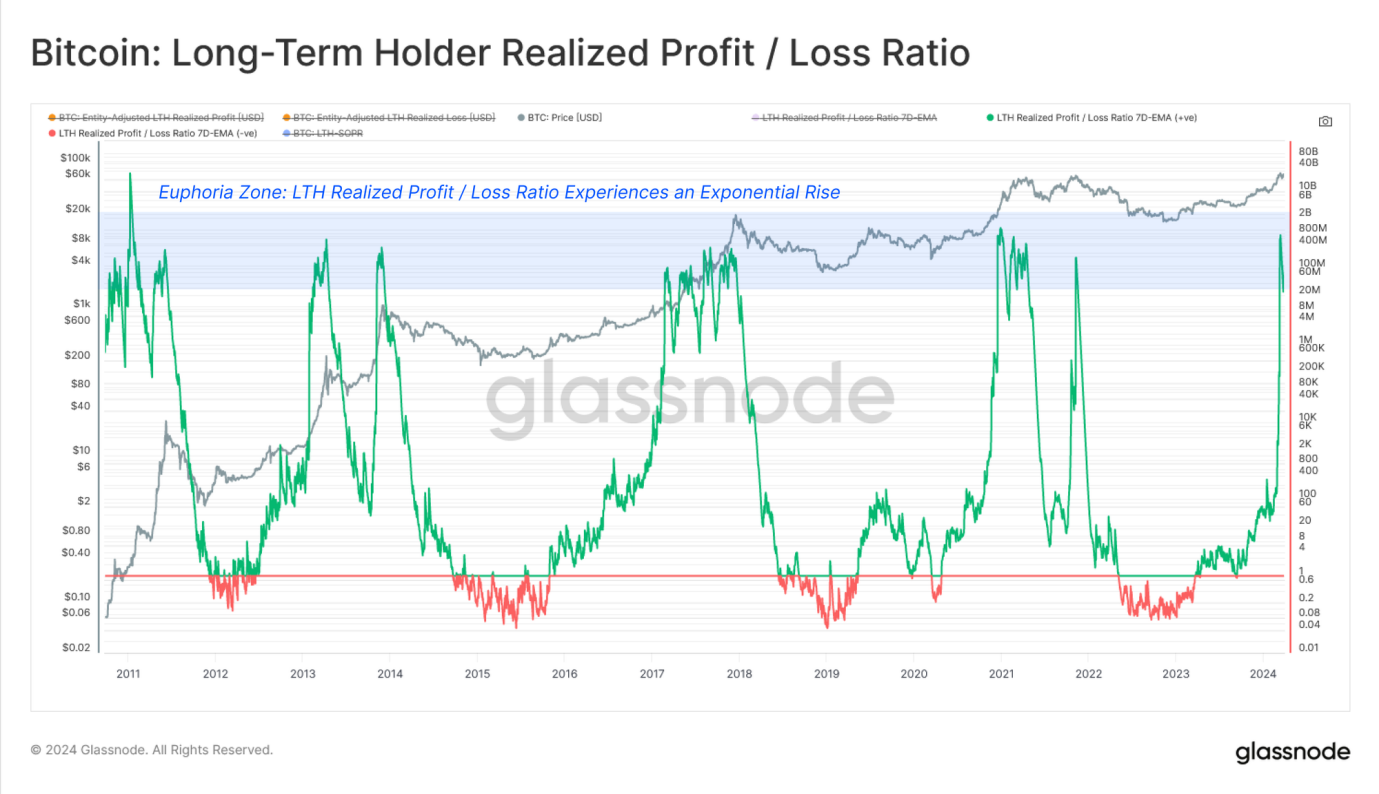
During uptrends, tracking short-term holders’ realized losses is useful—but monitoring long-term holders’ realized profits is even more critical, as it represents a key component of selling pressure. PANews believes long-term holder behavior is often viewed as a long-term indicator of market health. Minimal realized losses among them suggest they aren’t rushing to sell during downturns, reflecting optimism about the market’s long-term outlook. In contrast, high realized losses among short-term holders reflect market volatility and investor panic.
To illustrate, during the latest market adjustment, long-term holders realized only $3,500 in daily losses—compared to $114 million for short-term holders.
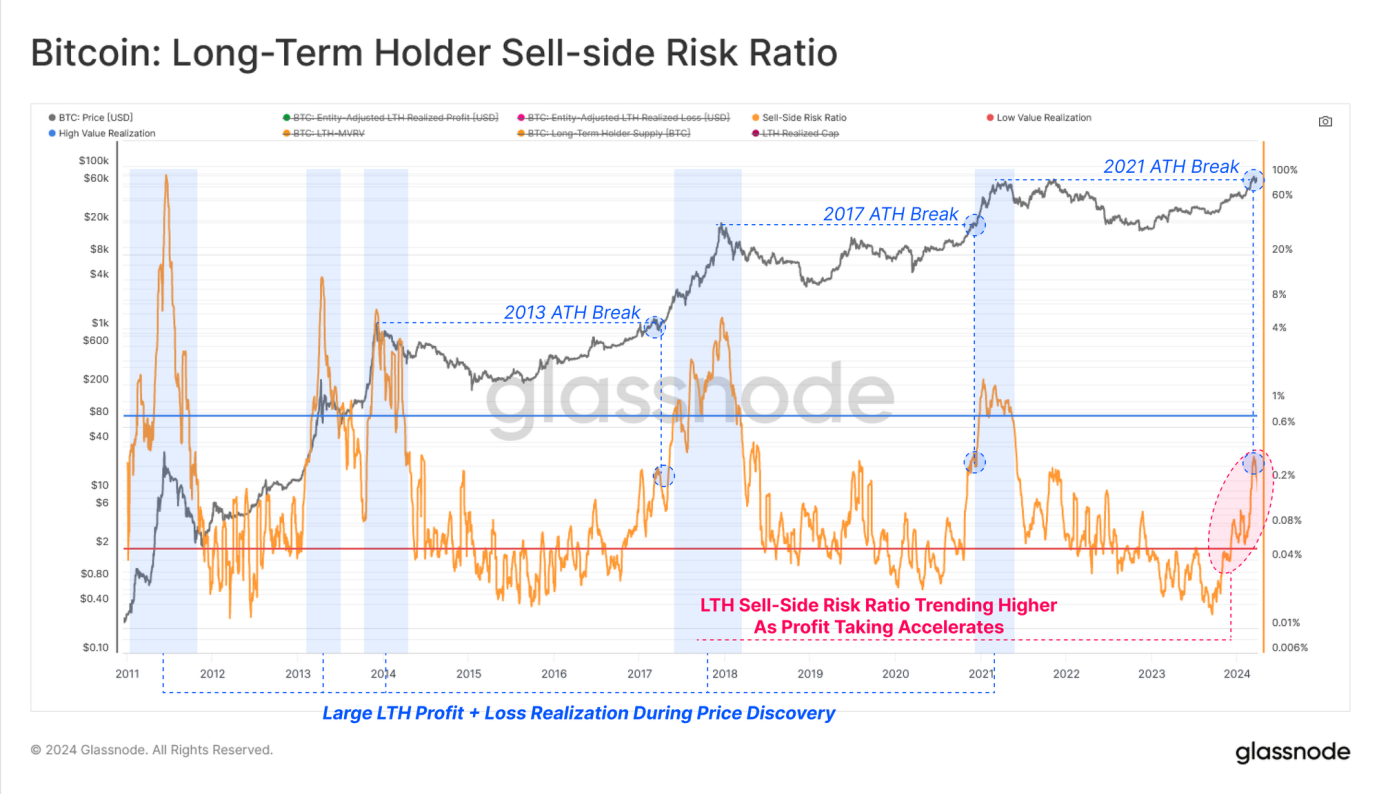
Finally, Glassnode notes that accelerating realized profits among long-term holders have driven their seller risk ratio into an upward trend since October 2023. This metric’s strong growth following the breach of historical highs suggests distribution pressure and profit-taking among long-term holders are comparable in relative terms to previous cycles.
In summary, analyzing the combined behavior of long- and short-term holder groups—and their profit-and-loss patterns—offers multiple perspectives on investor psychology and capital flows.
Using Glassnode’s diverse suite of on-chain tools and metrics, we observe a clear shift in investor behavior within today’s Bitcoin market. Long-term holders are deep into their selling cycle, realizing profits and reactivating dormant supply to meet new demand at higher prices. By leveraging on-chain analysis of different holder cohorts, investors can use these metrics to identify local and global market turning points—particularly using profit-and-loss indicators.
Ultimately, the interplay between long- and short-term holder groups and their profit-taking and loss-bearing behaviors may foreshadow potential shifts in market trends. These behavioral changes—especially profit realization and loss absorption at key price levels—offer a new pathway for predicting market volatility and potential market tops.
By integrating the above indicators, investors can gain a more comprehensive understanding of market dynamics and make more informed decisions in shaping future investment strategies.
Join TechFlow official community to stay tuned
Telegram:https://t.me/TechFlowDaily
X (Twitter):https://x.com/TechFlowPost
X (Twitter) EN:https://x.com/BlockFlow_News