









Galaxy: 10 Charts Illustrating the Vitality of RWA, DeFi, and the Ethereum Ecosystem
TechFlow Selected TechFlow Selected
Galaxy: 10 Charts Illustrating the Vitality of RWA, DeFi, and the Ethereum Ecosystem
The L2 ecosystem remains vibrant, with transaction volume approaching an all-time high.
 Navigating Web3 tides with focused insights
Author: Zack Pokorny, Galaxy
Translation: Deng Tong, Jinse Finance
It has been 50 days since the start of 2024, and we have seen the market capitalization of on-chain tokenized RWAs reach an all-time high, the number of addresses interacting with DeFi on major L1s and L2s hit a two-year high, and Ethereum’s L2 ecosystem remain vibrant. This report highlights some of the key emerging trends in the industry through the lens of on-chain data.
-
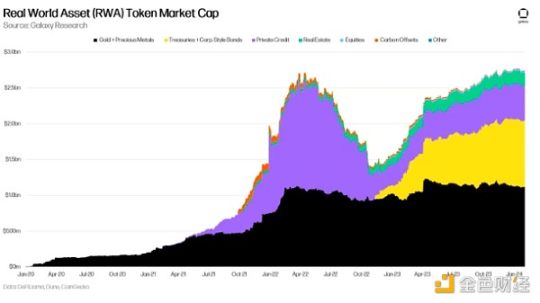
The total market cap of RWA tokens reached approximately $27.74 billion on February 2, setting a new all-time high. The market for tokenized financial assets—such as government bonds, private credit, and real estate—hit a record $16.14 billion on February 8. As RWA token market caps achieve these milestones, crypto-native assets are gaining market share over RWAs in key areas of DeFi.
-
The number of addresses interacting with DeFi on major L1s and L2s is approaching a two-year high, reaching 445,000 addresses. DEXs are among the most common types of DeFi applications users engage with when first entering DeFi.
-
Within the Ethereum ecosystem (L1 and major L2s), daily active addresses have reached an all-time high, while daily transaction counts continue to climb. L2 revenue also saw significant growth last month.
RWA
On February 2, 2024, the market capitalization of tokenized real-world assets (RWAs) reached an all-time high of $27.74 billion. Notably, financial assets—including government and corporate bonds, private credit, and real estate—hit a new high of $16.14 billion on February 8, 2024. These figures reflect only the value of RWA tokens on public blockchains—such as Ondo's OUSG and Tether's XAUT—and exclude stablecoins or issuer tokens like ONDO and CFG. Financial asset RWAs, particularly treasury bills and bonds, accounted for 58.1% of the sector, down approximately 110 basis points from their peak as of February 26, 2024.
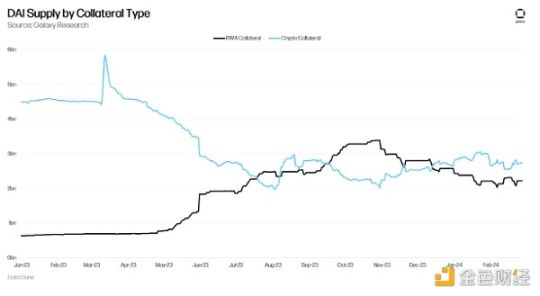
Despite the rising on-chain market cap of RWA tokens, the dominance and usage of RWAs within on-chain products have been declining. This trend is most evident in DAI collateral, where RWA usage has steadily decreased since late October 2023. This shift signals a growing preference for crypto-native assets over on-chain RWAs—and by extension, increasing demand for cryptocurrencies overall. The recent rise of LST-backed stablecoins further reinforces this trend, indicating strong momentum.
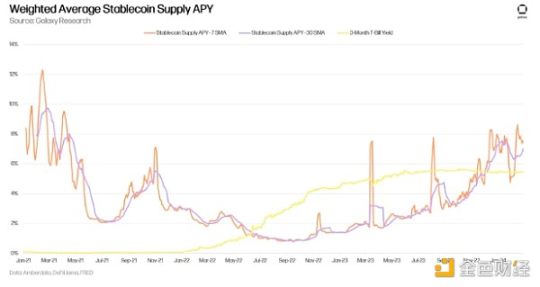
Moreover, the productivity of crypto-native assets has surpassed that of RWAs in several dimensions. We highlighted this in our December 1 newsletter using Maker and DAI as examples, showing that loans backed by crypto assets earn higher stability fees than those backed by RWAs. This dynamic persists and has even intensified as MakerDAO voted to increase stability fees on certain on-chain vaults. Most notably, it raised the fee for minting DAI against its stETH vault by 191 basis points. A similar trend exists in the annualized yield supplied by major stablecoins compared to Treasury bill yields. The chart below shows the weighted average supply APY for USDT, USDC, DAI, and FRAX borrow amounts on Aave v2/v3 and Compound v2/v3. Since late October 2023 / early November 2023—just before DAI’s RWA collateral began declining—stablecoin yields have consistently exceeded 3-month Treasury bill yields.
DeFi Users and Retention
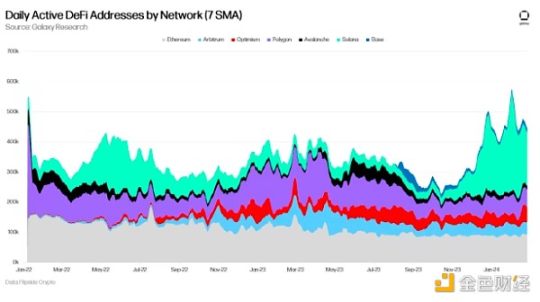
Based on 7-day SMA data, the number of daily active addresses (DAA) using DeFi across major L1s and L2s hit a two-year high of 576,000 on February 1. Solana has consistently led in daily active DeFi addresses, peaking at 330,000 on February 1 (the day after Jupiter’s airdrop), and standing at 196,000 as of February 20, 2024. In contrast, Ethereum has experienced ongoing DeFi user attrition over the past year, down 24% from 120,000 addresses on February 20, 2023. The next section provides more detail on Ethereum’s activity and user metrics.
DEXs have become a key entry point for users joining DeFi across the seven chains mentioned above. For reference, the “financial applications” category in the chart below includes lending platforms and yield aggregators. Since September 2023, nearly 60% of all new DeFi users on these seven chains began with a DEX—a pattern consistent with the wave of DeFi-related airdrops and speculation over the past six months. Additionally, note the growing importance of NFTs in attracting new users into DeFi over the past three months.

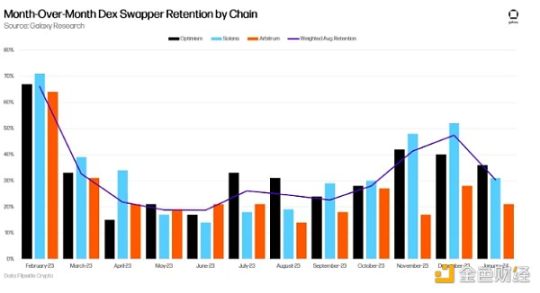
DEX user retention was notably strong over the three months ending in January. Among the chains observed over the past five months, Solana showed the highest DEX user retention rate, largely due to the Jupiter airdrop. The chart below tracks monthly retention rates (percentage of users who joined in month x and continued trading in month x+1) for DEX users on Solana, Arbitrum, and Optimism—the top three chains in DEX retention. Prior to a drop in January 2024, these rates had risen consecutively for four months (six months for Solana). The weighted average retention is based on new monthly DEX users.
Ethereum and Layer 2
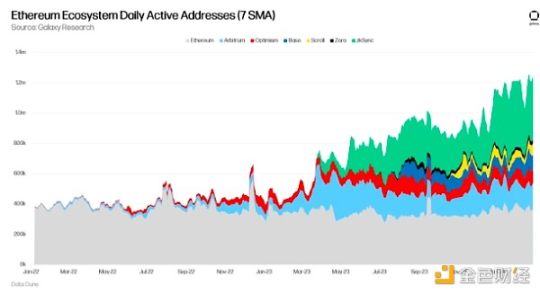
Ethereum has faced criticism for declining user numbers and reduced overall activity on crypto Twitter. While daily active addresses and activity metrics such as transaction counts have indeed plateaued or slightly declined over much of the past two years, evaluating Ethereum solely through its L1 fails to account for the promise of a rollup-centric future. When including some top L2s, user growth and activity are approaching all-time highs.
The chart below shows the combined network-wide daily active addresses across Ethereum L1 and several leading L2s. As of February 21, the total exceeded 1.2 million daily active addresses, with Ethereum L1 accounting for only 360,000. Note that this chart includes only a subset of all Ethereum L2s.
Transaction counts across Ethereum and the same L2s show similarly elevated levels. Despite sluggishness on Ethereum L1, the L2 ecosystem averaged 3.14 million transactions per day over the 30 days ending February 26, 2024.

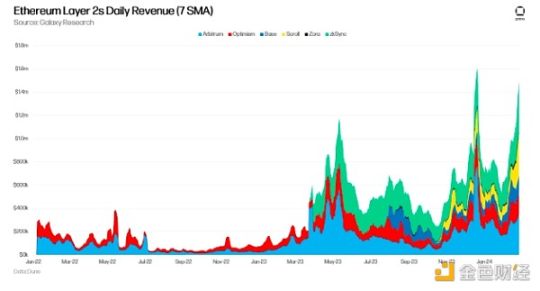
Consistent with strong transaction volume, revenue has also grown. As of February 26, 2024, Arbitrum, Optimism, Base, Scroll, Zora, and zkSync generated $1.5 million in daily revenue using a 7-day SMA (fees paid by users to rollup sequencers). February 26, 2024 also marked the second-highest recorded daily combined revenue across these chains.
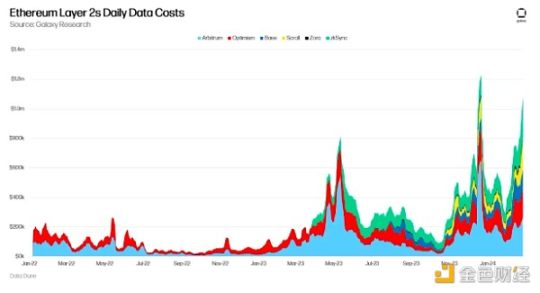
Over the 30 days ending February 26, 2024, these L2s also paid over $21.6 million in data costs to Ethereum L1. This figure will grow increasingly important as activities previously executed on Ethereum L1 are now being conducted on rollups.
Summary
Below are some key signals provided by the data above:
-
Persistent demand in DeFi for crypto-native assets to replace RWAs.
-
Despite the end of large-scale airdrops, users continue to enter DeFi, though DEX retention declined in January—indicating some user attrition or capitulation in this segment.
-
While Ethereum’s activity and user counts have drawn attention for declining, its L2 ecosystem remains vibrant, with transaction volumes nearing all-time highs.
Join TechFlow official community to stay tuned
Telegram:https://t.me/TechFlowDaily
X (Twitter):https://x.com/TechFlowPost
X (Twitter) EN:https://x.com/BlockFlow_News
 @galaxyhq









