









Glassnode Weekly on-chain report: Digesting the impact of GBTC's excess supply
TechFlow Selected TechFlow Selected
Glassnode Weekly on-chain report: Digesting the impact of GBTC's excess supply
With ETF approvals, capital inflows have accelerated, and on-chain exchange traffic has reached bull market peak levels.
 Navigating Web3 tides with focused insights
Authors: Ding HAN, UkuriaOC
Summary
-
Bitcoin's price performance since the 2022 lows has been strikingly similar to previous cycles, showing slightly slower recovery but greater resilience.
-
Although old coin selling has slightly increased following ETF approval, most long-term Bitcoin investors remain reluctant to sell at current prices.
-
In terms of entities, network activity remains low, but on-chain transferred value—especially transfers to exchanges—remains strong, resembling prior bull markets.
Cycle Positioning
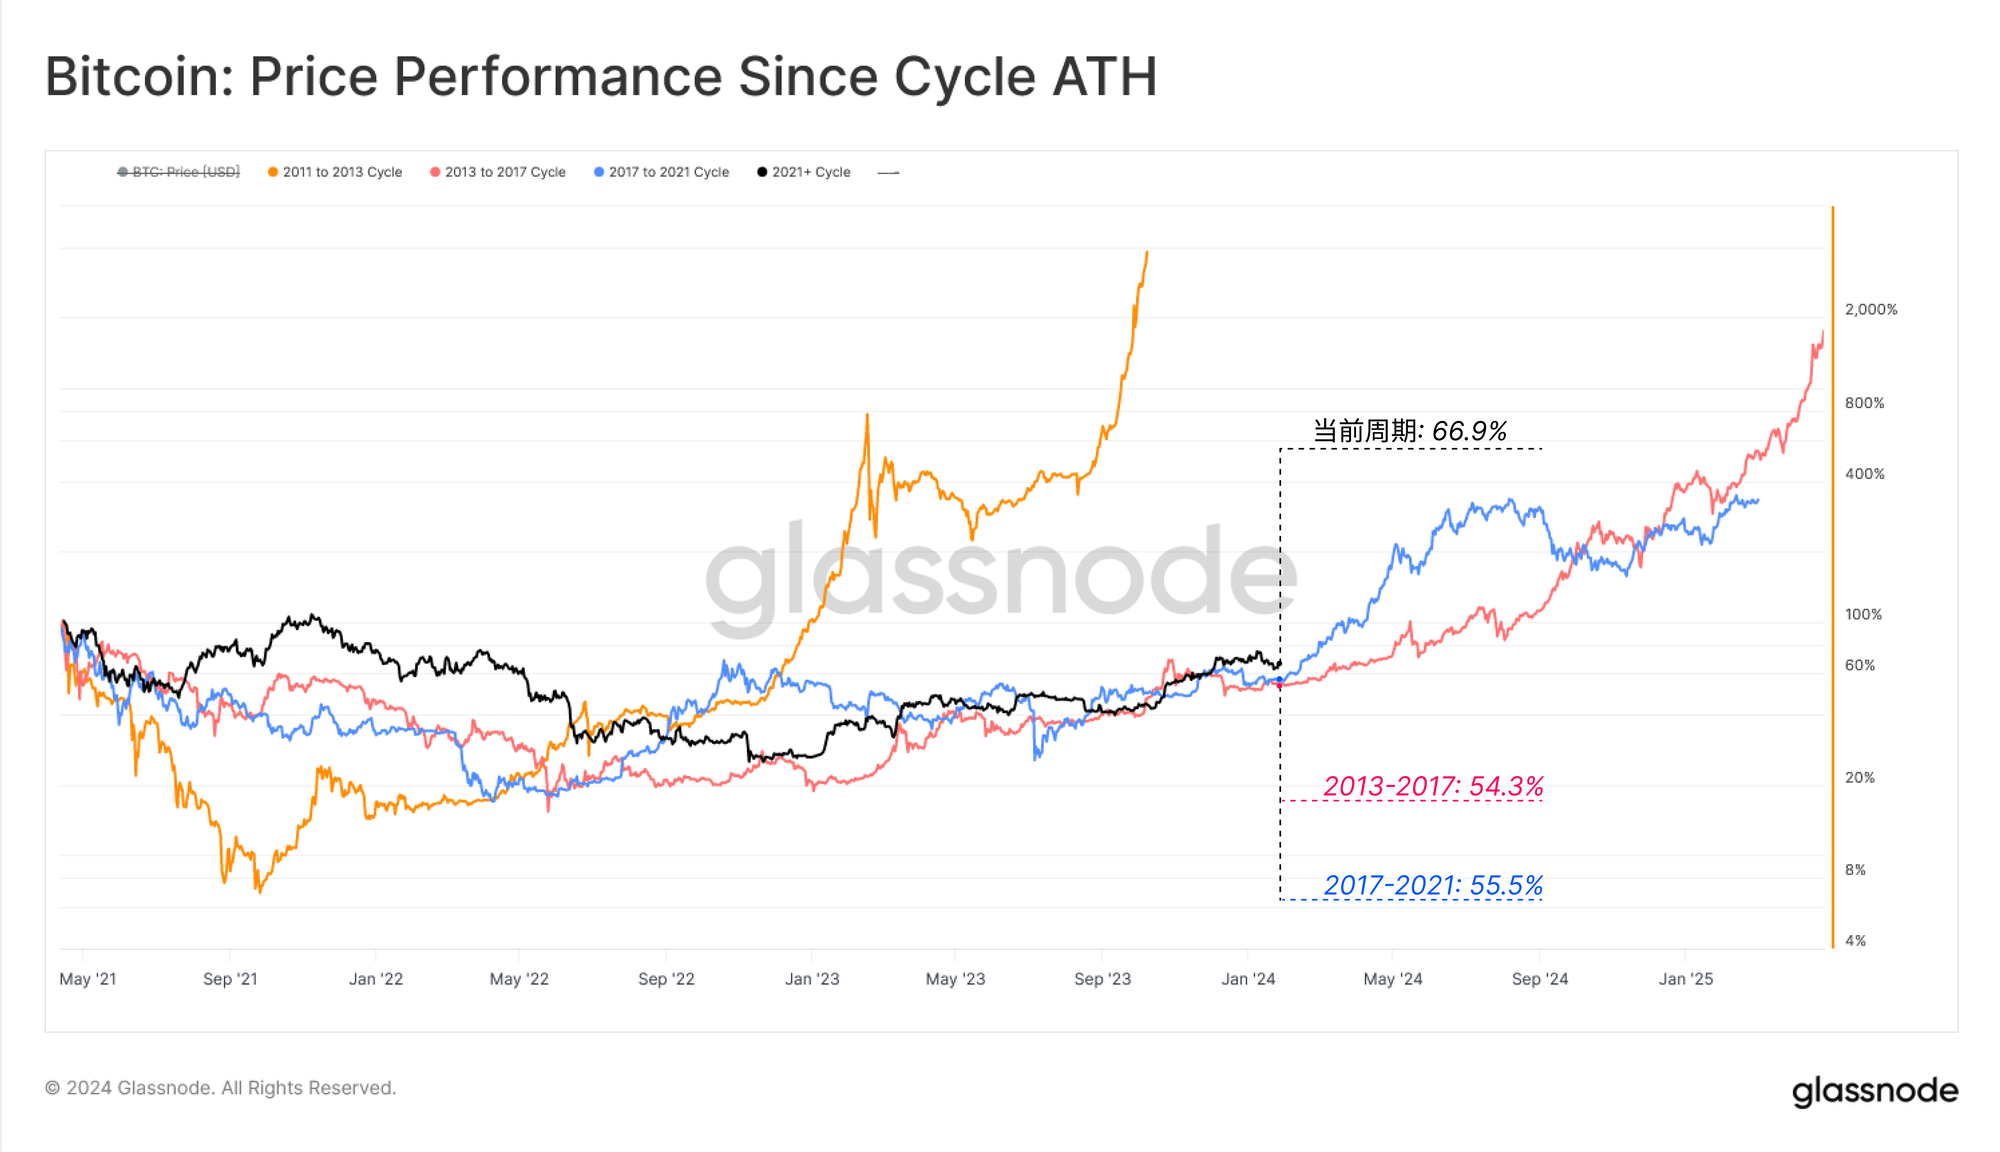
The first chart evaluates BTC's price performance since the last all-time high. Here, we treat April 2021 (Coinbase direct listing) as the peak for better duration interpretation, as we believe that marked the height of investor sentiment.
History rhymes remarkably—Bitcoin’s behavior across the past three cycles has been extremely similar. Our current cycle is still slightly ahead of the 2016–17 and 2019–20 cycles, partly due to 2023 being an exceptionally strong year.
🔴 Cycle 2: 45.7% below previous all-time high
🔵 Cycle 3: 43.6% below previous all-time high
⚫ Current cycle: 37.3% below previous all-time high
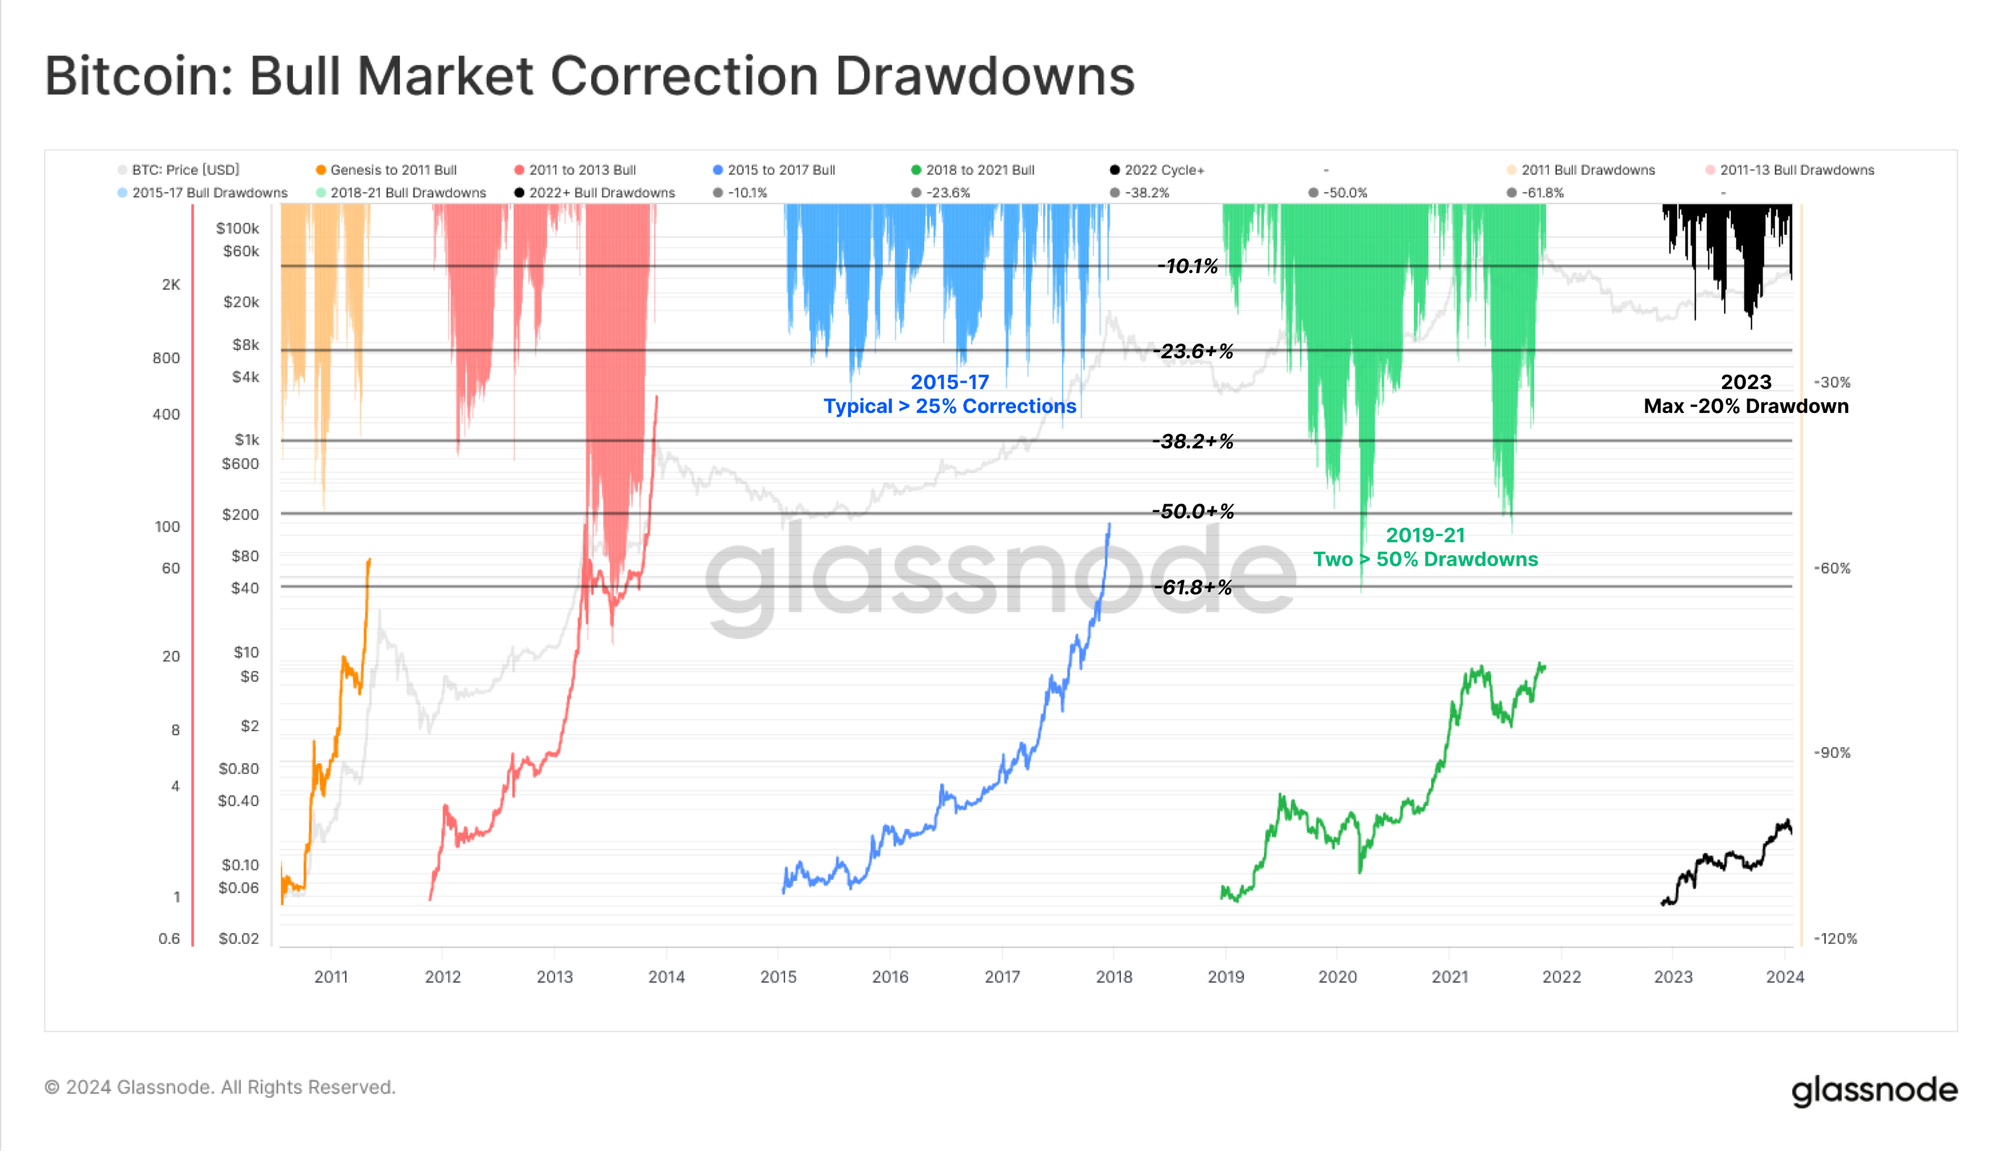
However, in our current cycle, a higher level of resilience is observable, with corrections from local highs remaining relatively shallow. The largest drawdown so far was -20.1% in August 2023.
This insight becomes even clearer when comparing the proportion of days spent trading in deep correction:
🟠 Genesis to 2011: 164 out of 294 days (55.7%)
🔴 2011 to 2013: 352 out of 741 days (47.5%)
🔵 2015 to 2017: 222 out of 1066 days (20.8%)
🟢 2018 to 2021: 514 out of 1056 days (48.7%)
Nonetheless, recent weeks have seen downward price momentum as the market digests the new dynamics of spot ETFs.
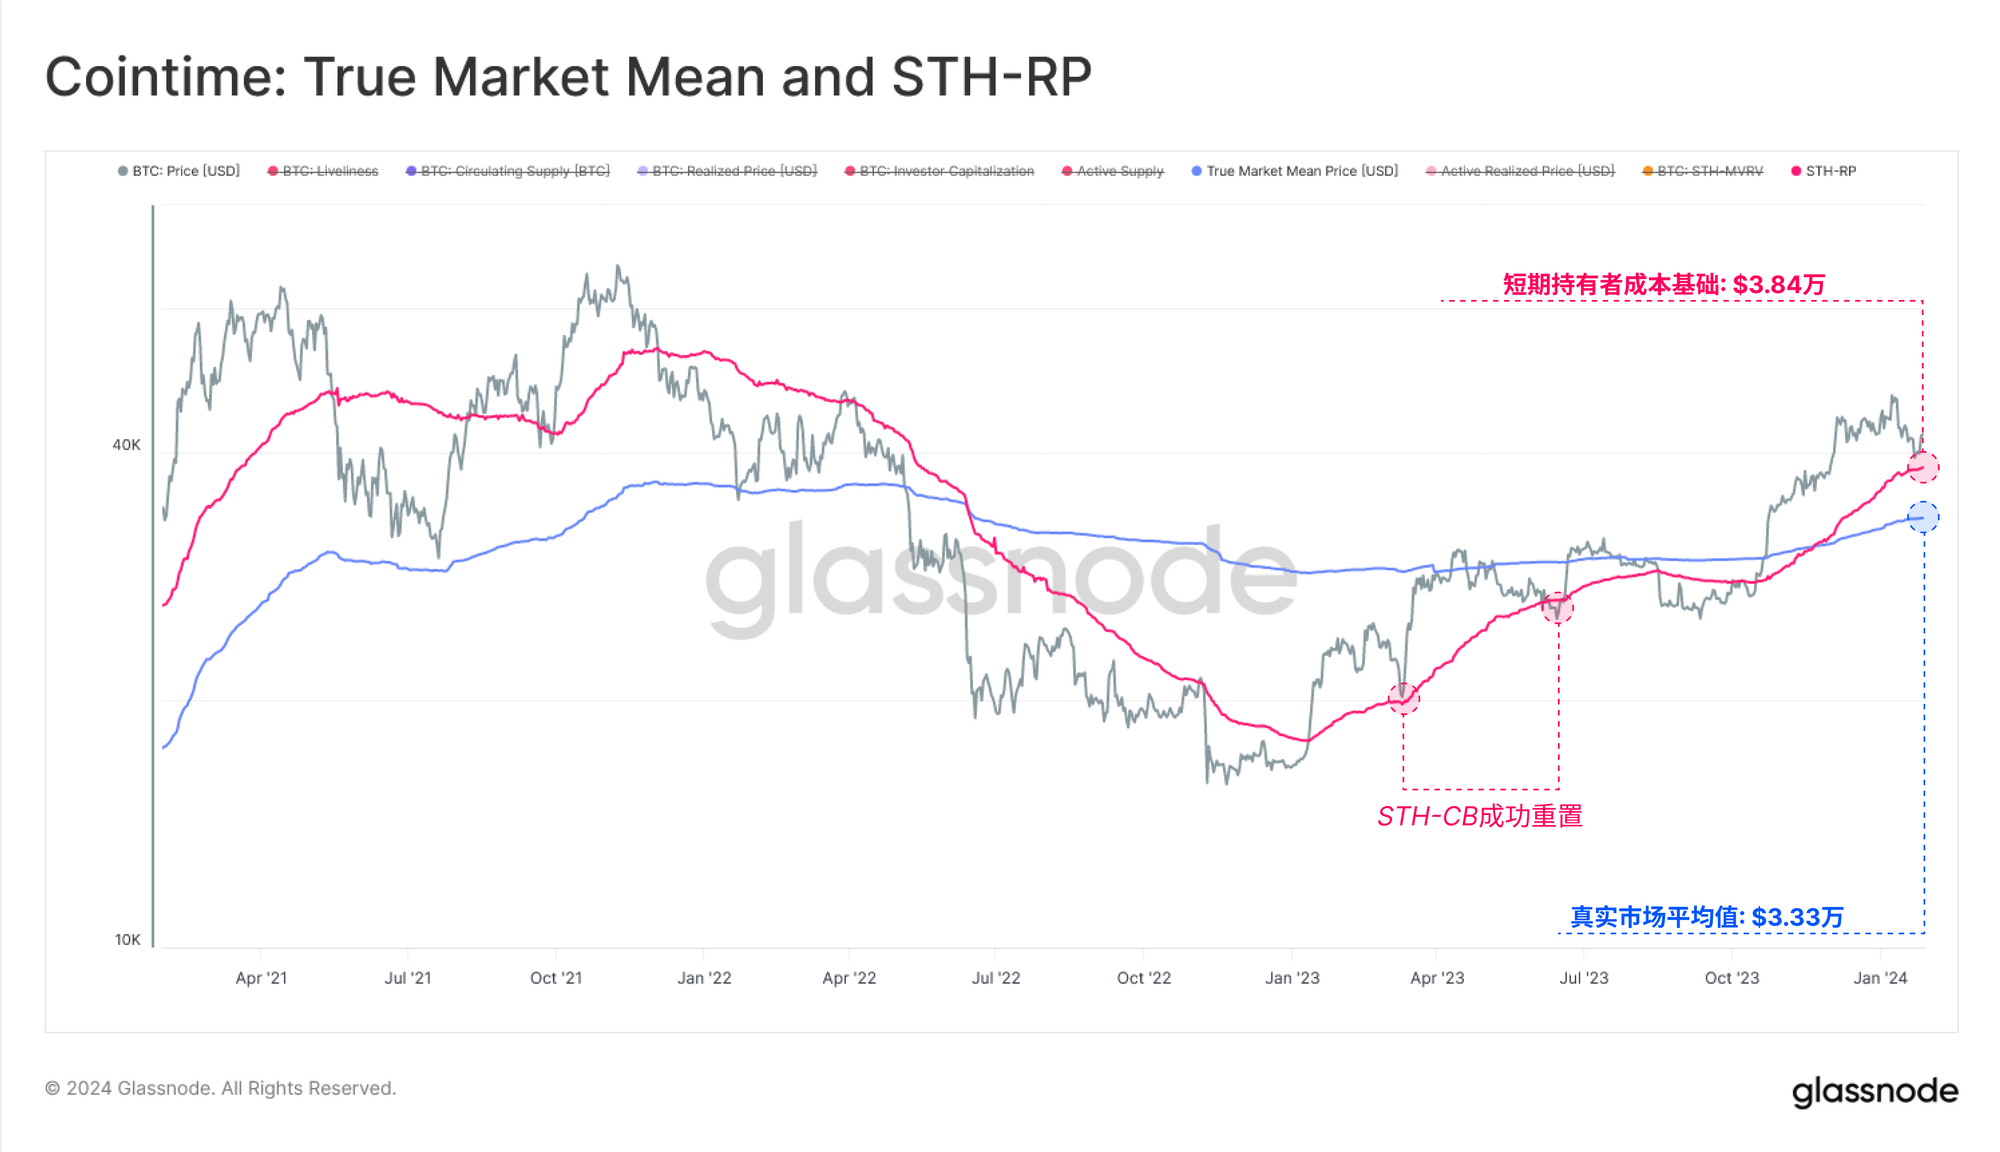
Here, we reference two key on-chain price levels:
🔴 Short-Term Holder Cost Basis ($38,300), representing the average acquisition price of new demand.
🔵 True Market Average Price ($33,300), a cost basis model for active investors.
During upward trends, the market typically retests the Short-Term Holder Cost Basis as support. However, if this level breaks decisively, attention shifts to the True Market Average Price. This metric serves as a central pivot point in the Bitcoin market and often distinguishes bull from bear regimes.
Recovery Faces Excess Supply from GBTC
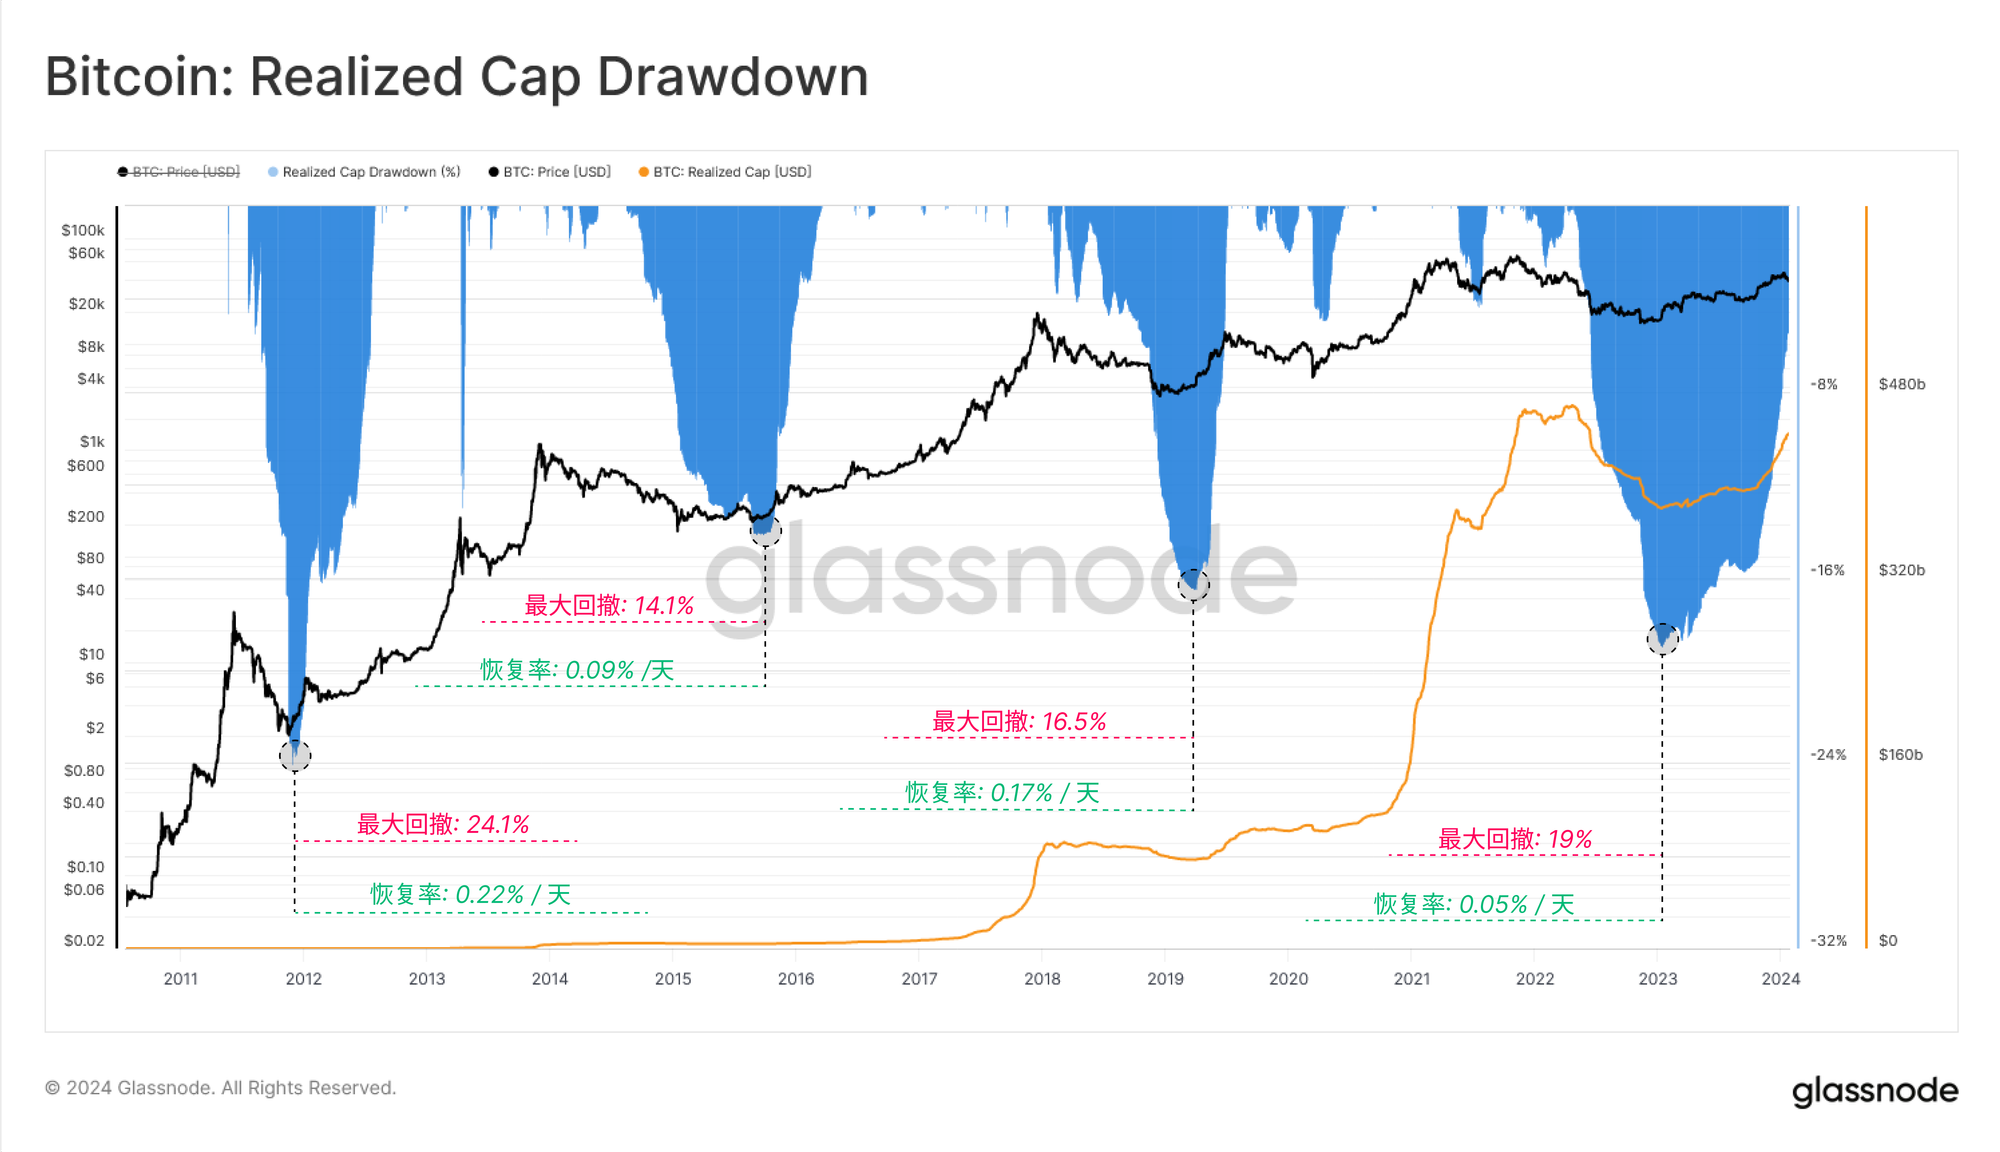
We can use the basic "Realized Market Cap" metric to assess the severity of capital outflows across cycles and the duration of recovery.
Currently, Realized Market Cap is only 5.4% below its previous all-time high of $467 billion and is experiencing strong capital inflows. Nevertheless, compared to prior cycles, the pace of recovery has been notably slower—likely due to challenging trades like GBTC arbitrage creating significant supply overhang.
In this cycle, the recovery of Realized Market Cap is the slowest on record:
🥇 2012–13 cycle: 0.22% per day
🥉 2015–16 cycle: 0.09% per day
🥈 2019–20 cycle: 0.17% per day
🐢 2023–24 cycle: 0.05% per day
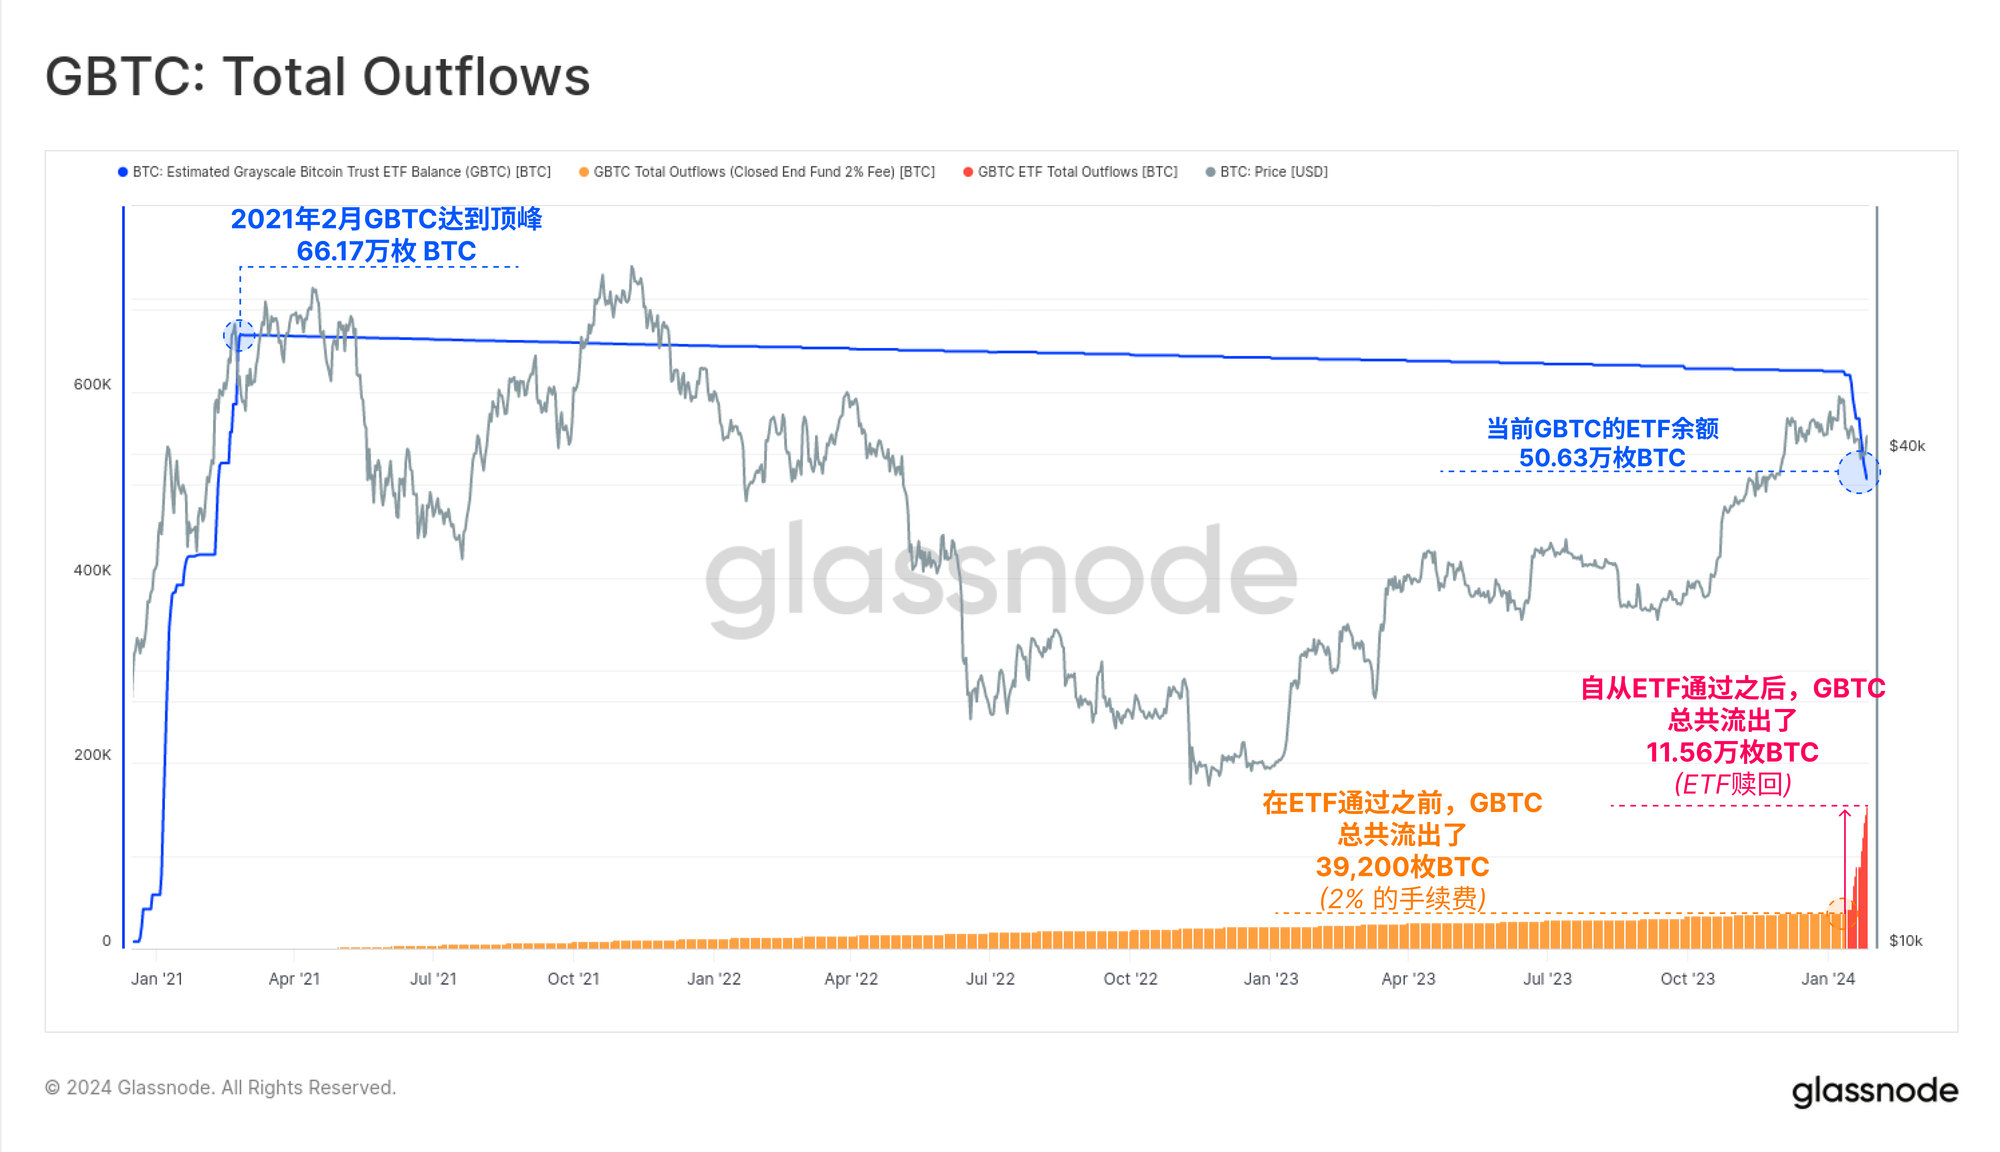
This phenomenon is partly attributed to massive redemptions from Grayscale’s GBTC product. As a closed-end trust, GBTC accumulated an extraordinary 661,700 BTC by early 2021, driven by traders seeking to close NAV premium arbitrage opportunities.
After years of trading at steep NAV discounts (with a 2% management fee considered very high), conversion into a spot ETF triggered a major rebalancing event. Since ETF approval, approximately 115,600 BTC have been redeemed from GBTC, creating a significant headwind for the market.
ETF Hodlers Show No Signs of Letting Go
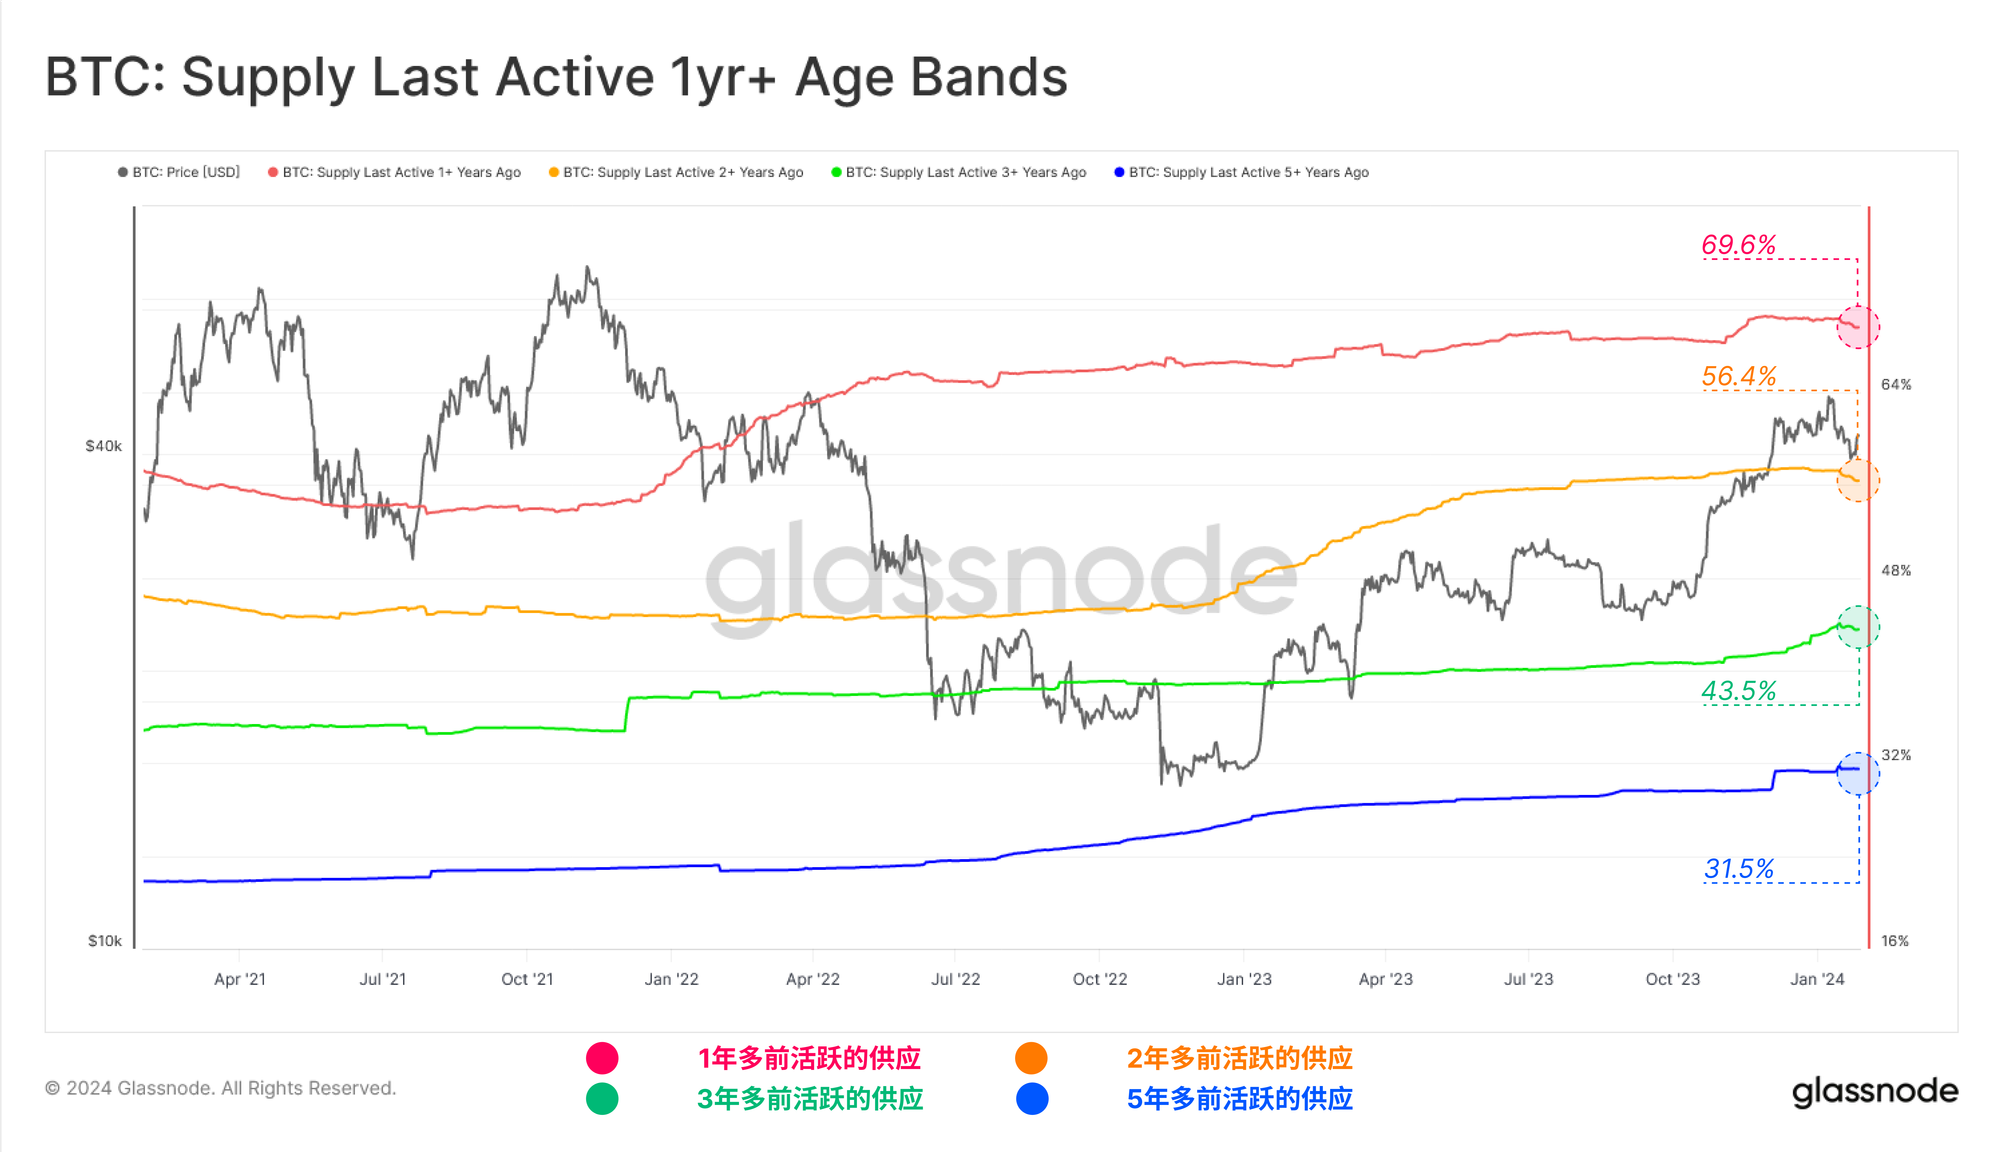
Amid strong rebounds, sell-off news events, and dynamic markets, the vast majority of hodlers appear calm and steady. This set of "Last Active Supply" metrics measures the proportion of circulating supply held for multiple years.
We observe slight declines in 1-year and 2-year supply turnover, much of which relates to GBTC—but not all. This indicates a notable amount of old supply has recently become mobile.
However, in absolute terms, the vast majority of BTC holders remain stable, with holding proportions across multiple age cohorts only slightly below all-time highs:
🔴 Over 1 year ago: 69.9%
🟠 Over 2 years ago: 56.7%
🟢 Over 3 years ago: 43.8%
🔵 Over 5 years ago: 31.5%
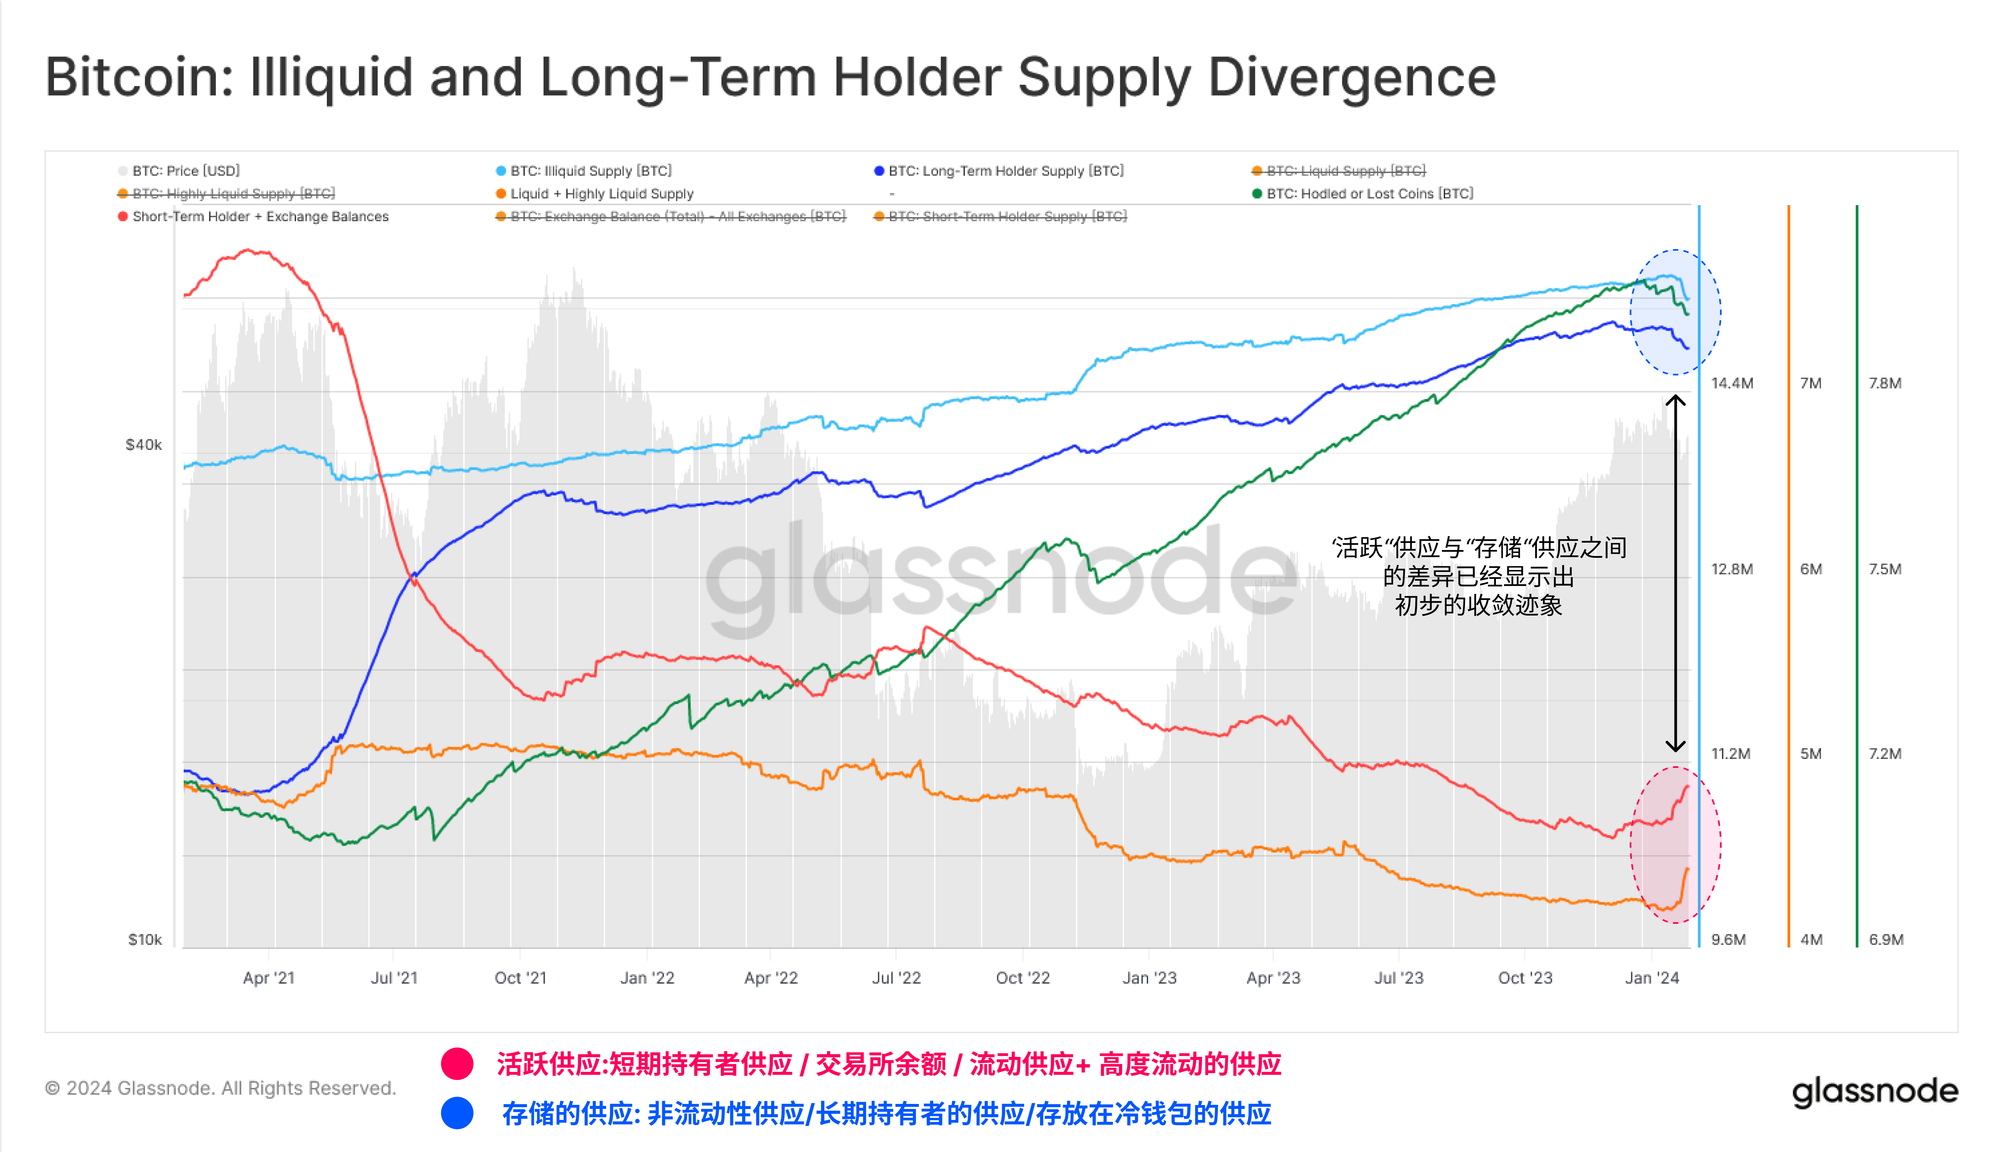
In our Week 46 report of 2023, we introduced and compared several measures of "dormant supply" versus "active supply." At the time, we noted a large divergence, with dormant, inactive, and illiquid Bitcoin dominating.
This year, we see early signs that this gap may be narrowing, with all indicators of "active supply" increasing significantly. This aligns with the aforementioned rise in old coin selling.
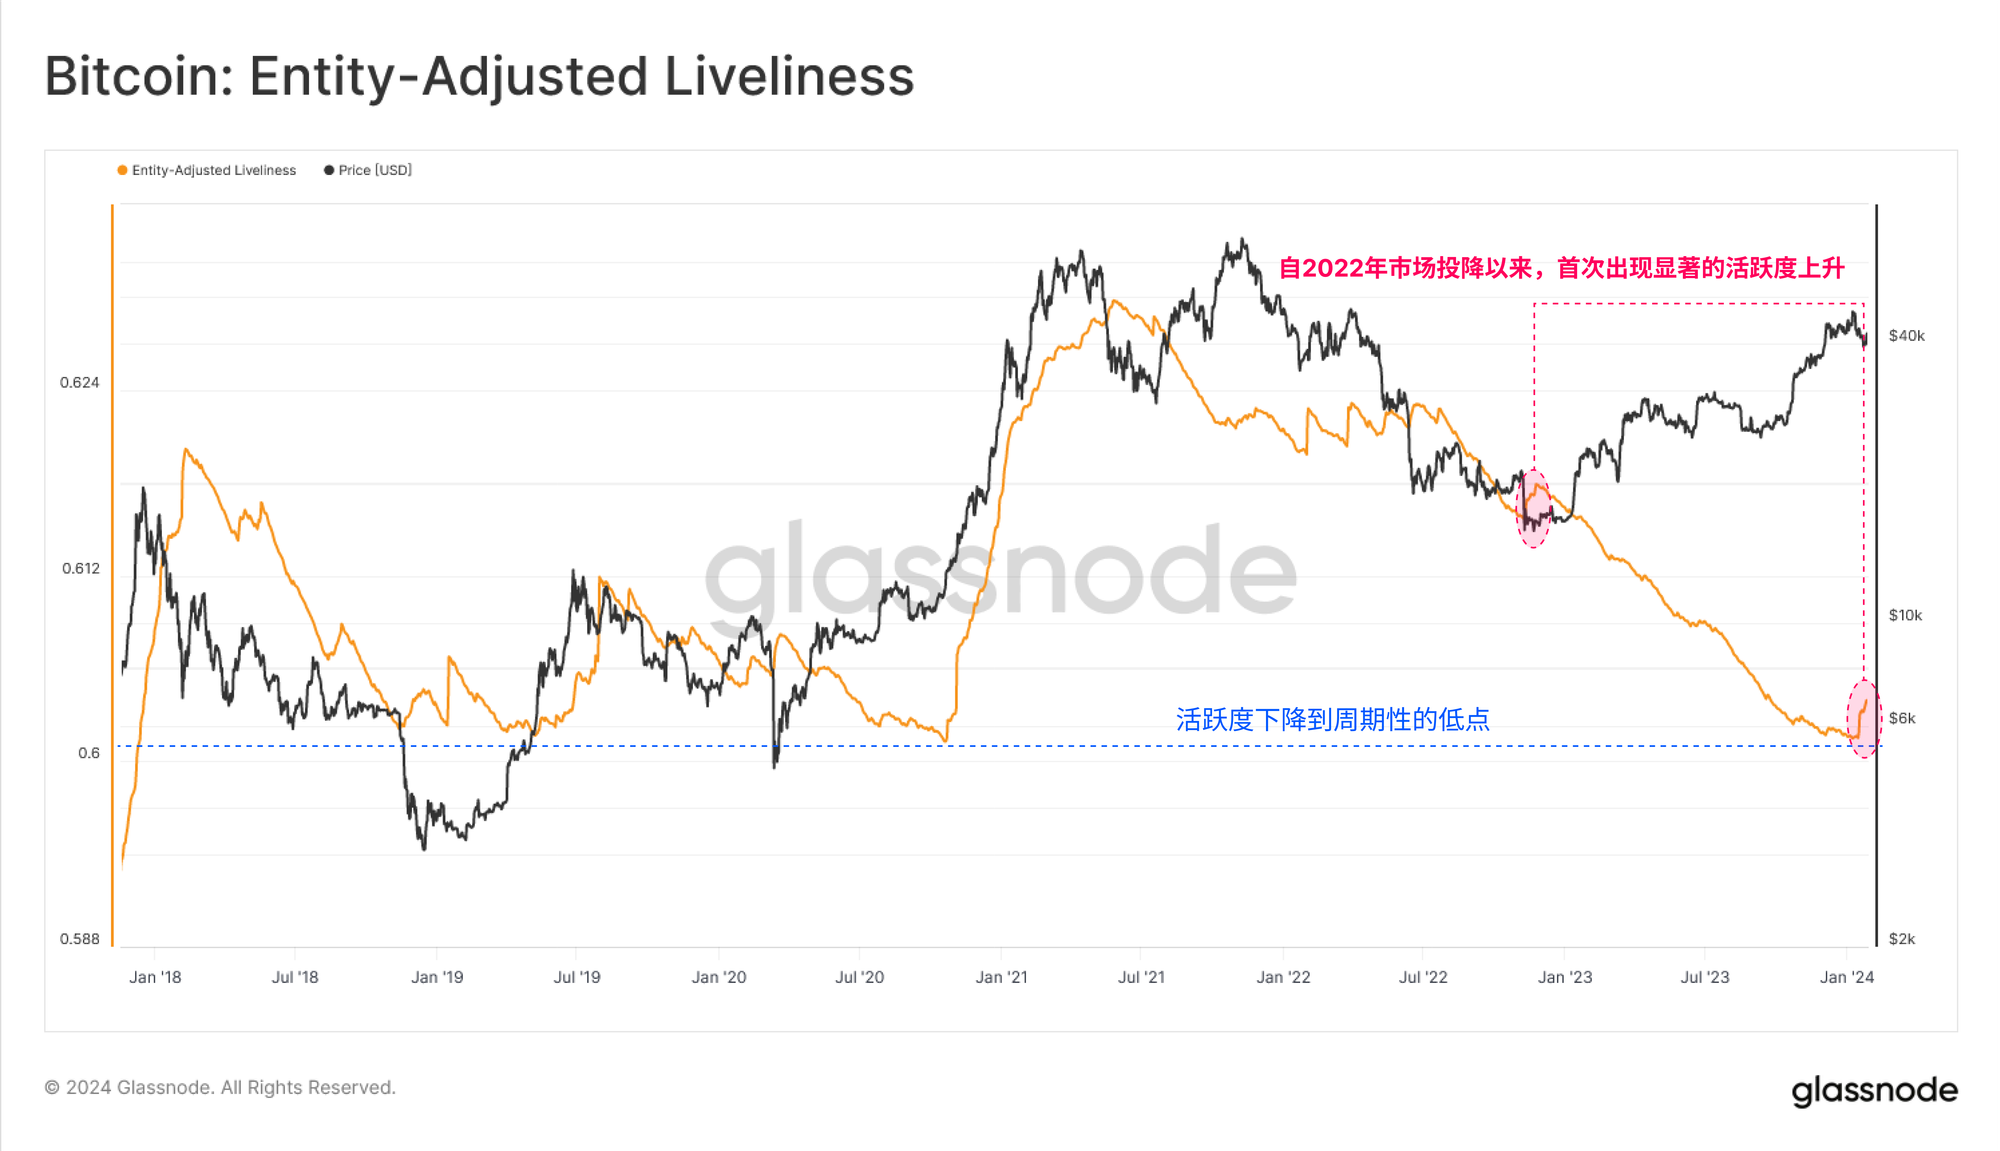
This has triggered the largest surge in network activity since the capitulation event in December 2022. Once again, this supports the earlier analysis, indicating increased Coin Days Destroyed as some investors liquidate portions of their long-held Bitcoin.
However, from a macro perspective, activity remains near multi-year lows, suggesting the vast majority of supply remains tightly held—perhaps waiting for higher spot prices or motivated by increasing volatility.
On-Chain and Exchange Activity
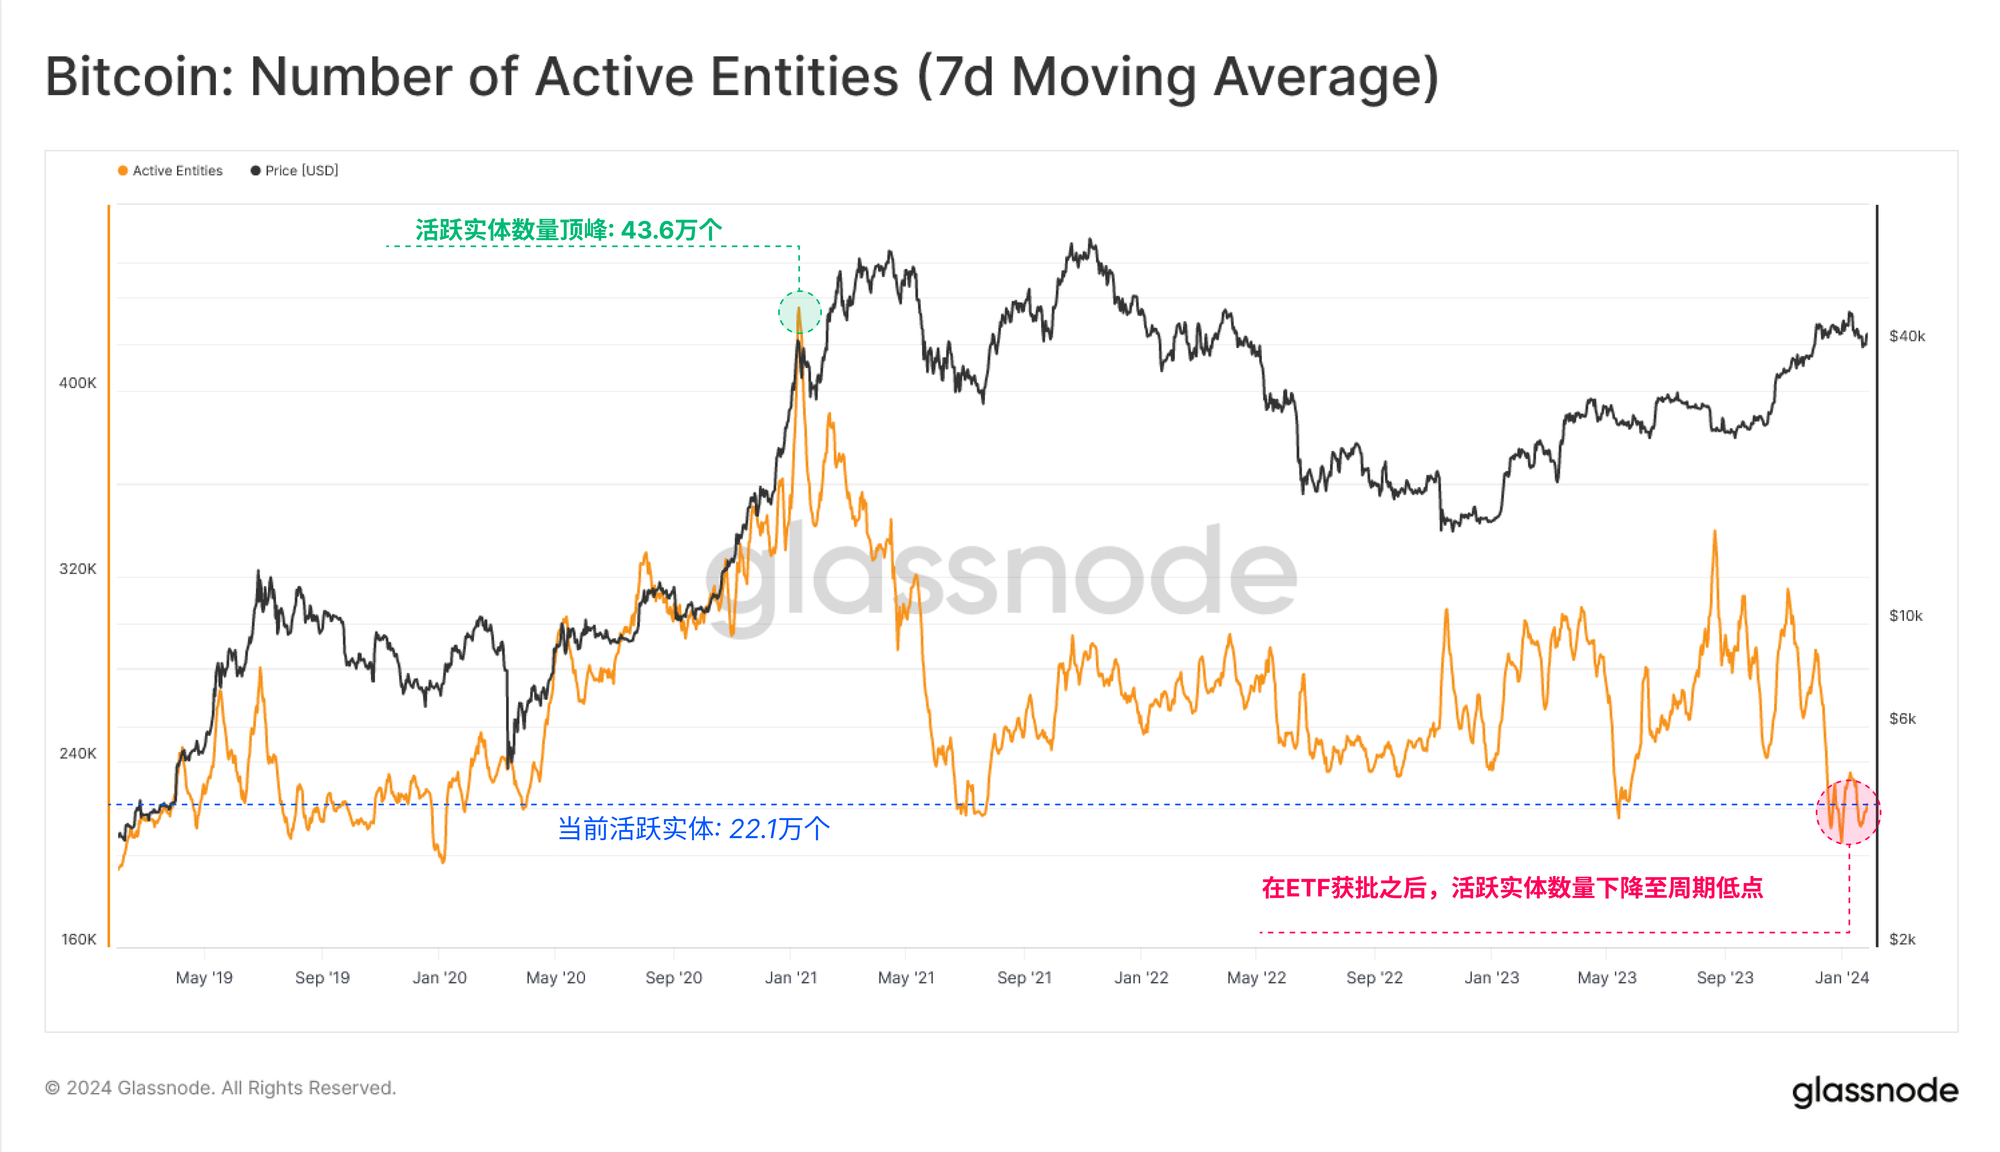
Assessing Bitcoin's on-chain activity provides valuable insights into network health, adoption, and growth. However, despite strong price performance, there is a counterintuitive trend: the number of active entities has dropped to a cycle low of 219,000 per day.
At first glance, this might suggest that user growth has not kept pace with Bitcoin’s price rally.
This is primarily due to increased activity related to ordinals and inscriptions, where many participants reuse Bitcoin addresses, thereby reducing the count of unique "active entities."
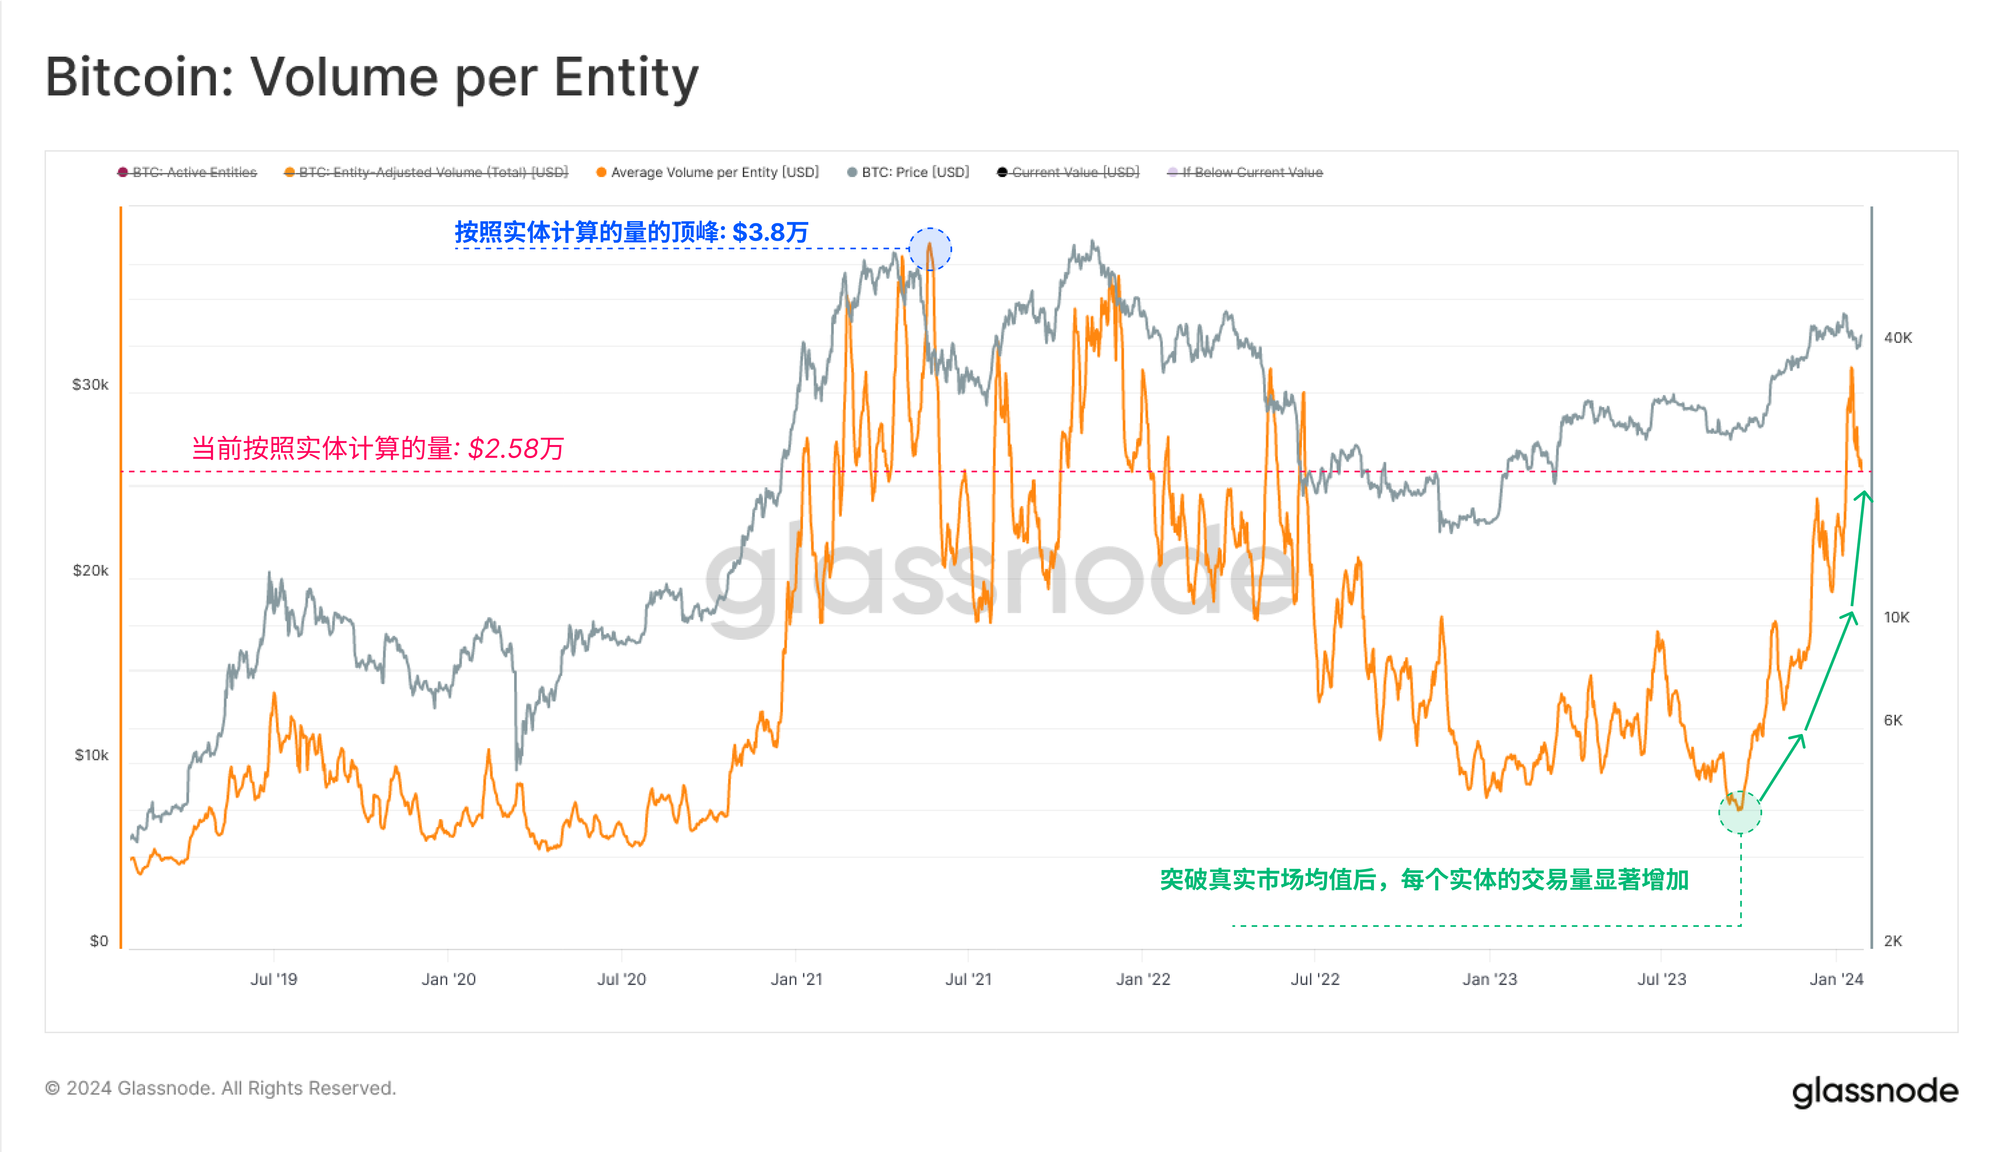
On the other hand, transfer volume remains very strong, processing around $7.7 billion in economic transactions daily. The divergence between declining active entities and rising transfer volume highlights a growing presence of large market participants, with average transaction size surging to $263,000 per transaction.
This suggests increasing institutional participation and capital flows.
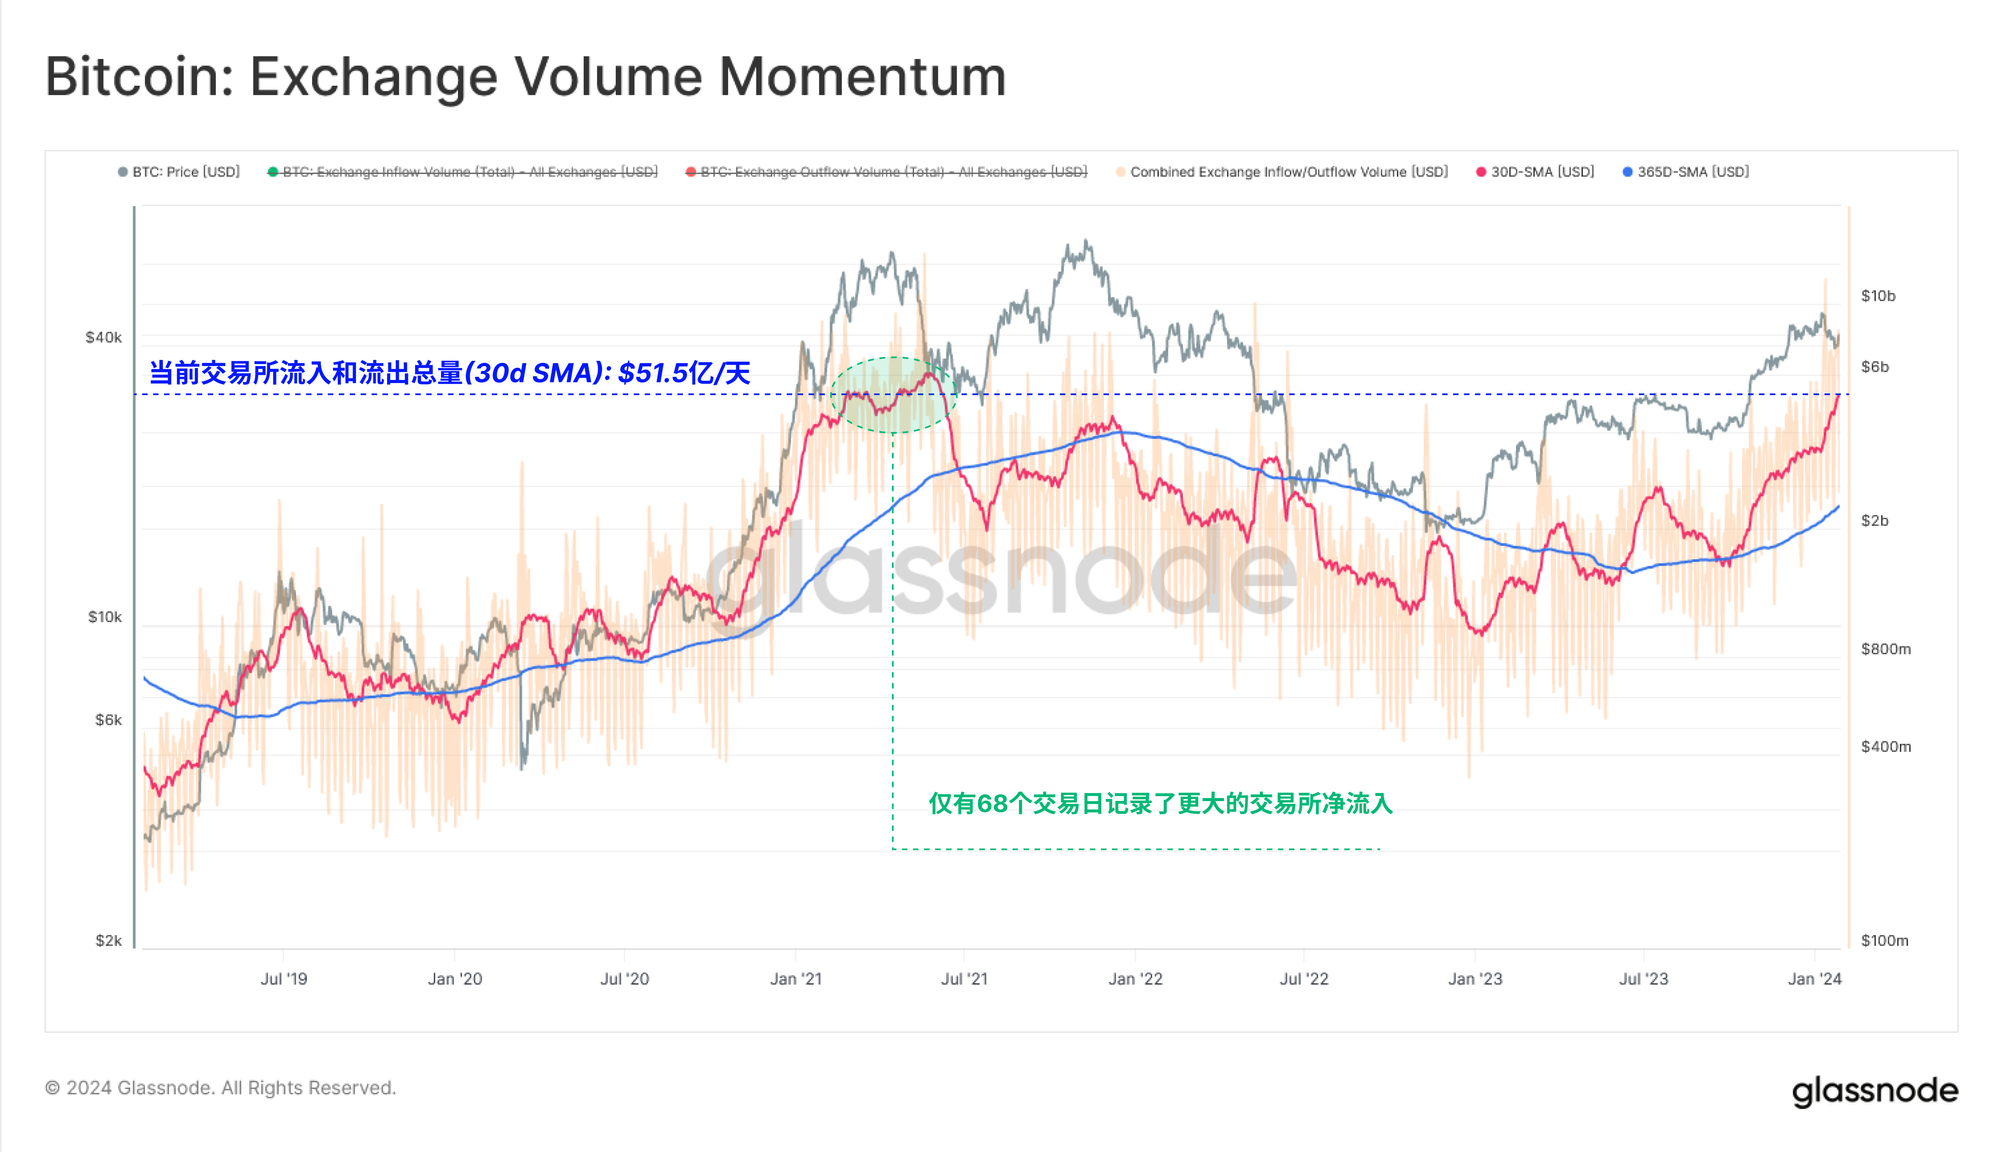
Exchanges remain the primary venues for trading activity, with deposit and withdrawal volumes spiking to $6.8 billion per day. Currently, exchange-related deposit and withdrawal activity accounts for approximately 88% of all on-chain transaction volume.
Current exchange inflow and outflow volumes are comparable to peaks seen during the 2021 bull run, with only 68 trading days (1.5%) exceeding this level based on 30-day SMA.
This further underscores the expanding interest among market participants in Bitcoin.
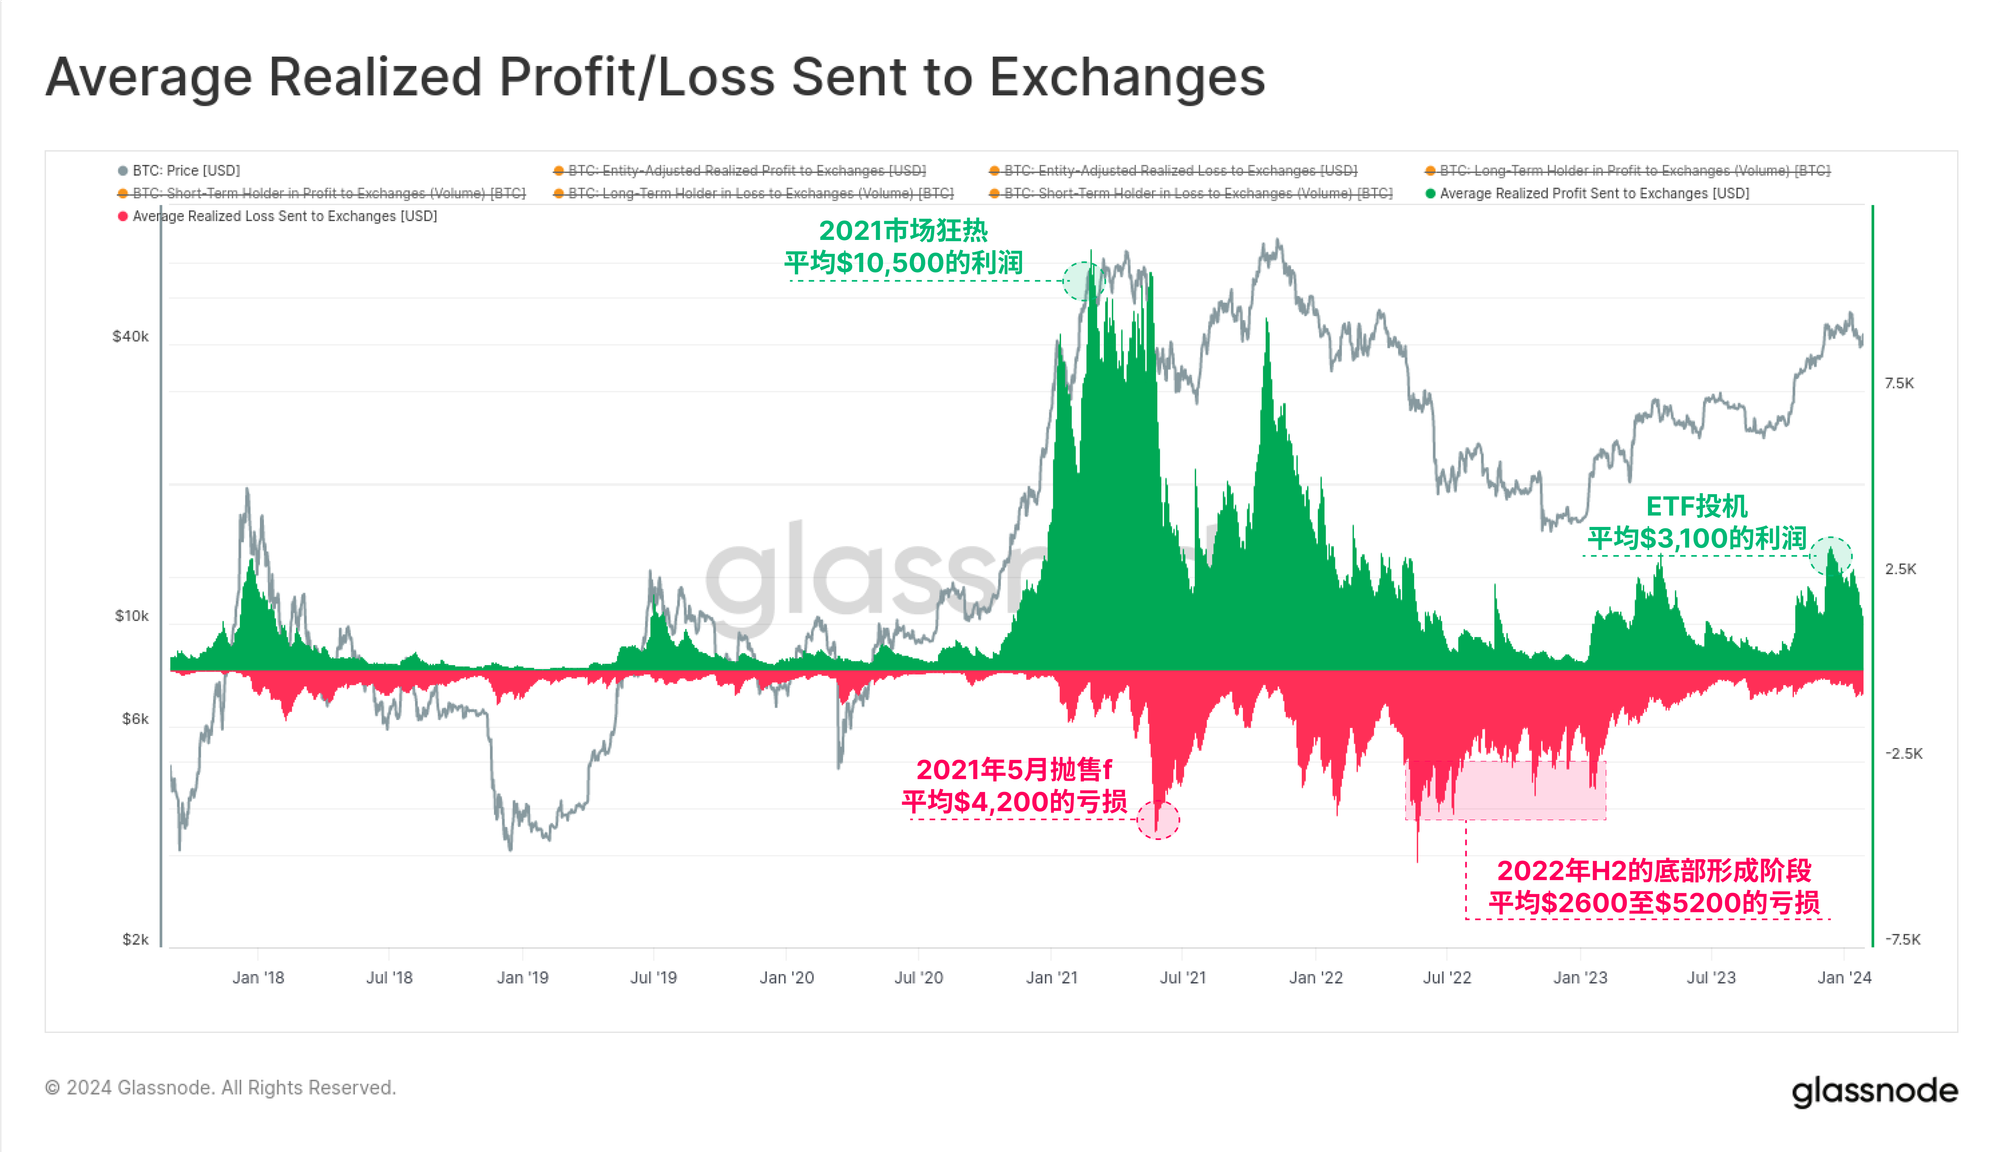
Alongside rising exchange flows, profit-taking has also occurred. The chart below shows the average profit (or loss) per coin moved to exchanges.
At the peak of ETF speculation, this metric reached an average profit of $3,100—matching levels seen during the rebound high in April 2023. This remains far below the $10,500 average profit observed at the peak of the 2021 bull market and has begun to meaningfully cool.
Conclusion
The approval of nine spot Bitcoin ETFs marks a milestone for digital assets, with institutional capital now flowing openly into this asset class. Despite significant supply overhang, capital inflows are accelerating as investors rebalance away from the long-contested GBTC ETF product.
The value of on-chain exchange flows has reached levels seen at the peak of the 2021 bull market, while the average size of transferred value increasingly reflects the presence of institutions and large-scale capital investors.
Join TechFlow official community to stay tuned
Telegram:https://t.me/TechFlowDaily
X (Twitter):https://x.com/TechFlowPost
X (Twitter) EN:https://x.com/BlockFlow_News
 @glassnode









