









Coinbase出品,机构投资者必备:一季度加密市场指南解析
TechFlow Selected TechFlow Selected
Coinbase出品,机构投资者必备:一季度加密市场指南解析
In 2023, the total market capitalization of cryptocurrencies increased by over 108%, driven by strong performances from Bitcoin and Ethereum.
 Navigating Web3 tides with focused insights
Source: Coinbase & Glassnode
Translation: Yanan, Bitpush News
This guide is a research report jointly developed by Coinbase Institutional and Glassnode, offering institutional investors an in-depth analysis of the most critical cryptocurrency market indicators and trends.
Market Overview
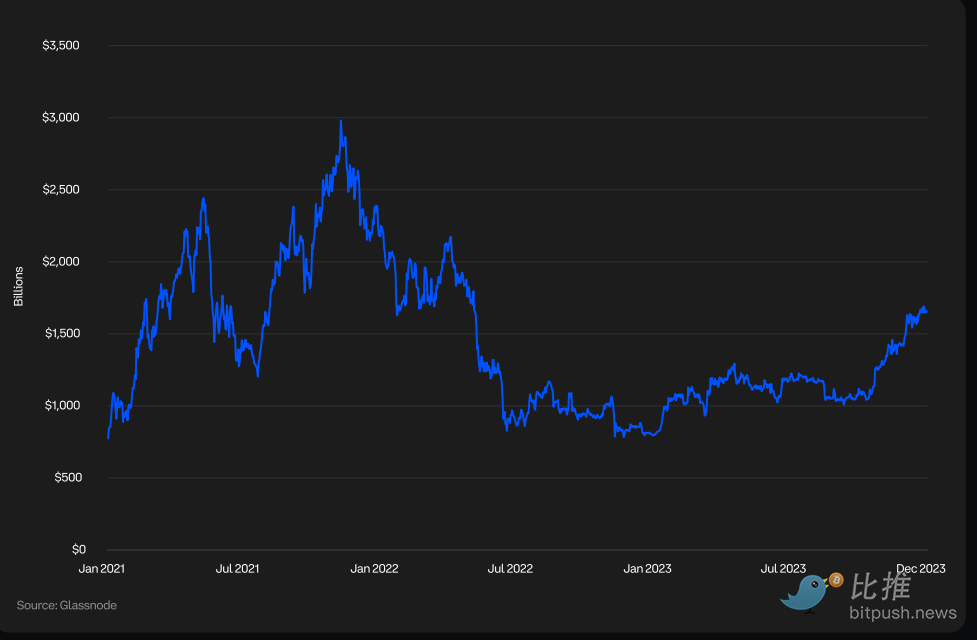
Total Cryptocurrency Market Capitalization
Total cryptocurrency market capitalization is a key metric reflecting the global digital asset market value, encompassing Bitcoin (BTC), Ethereum (ETH), tokens, stablecoins, and more. In 2023, driven by strong performance from Bitcoin and Ethereum, total crypto market cap grew over 108%.
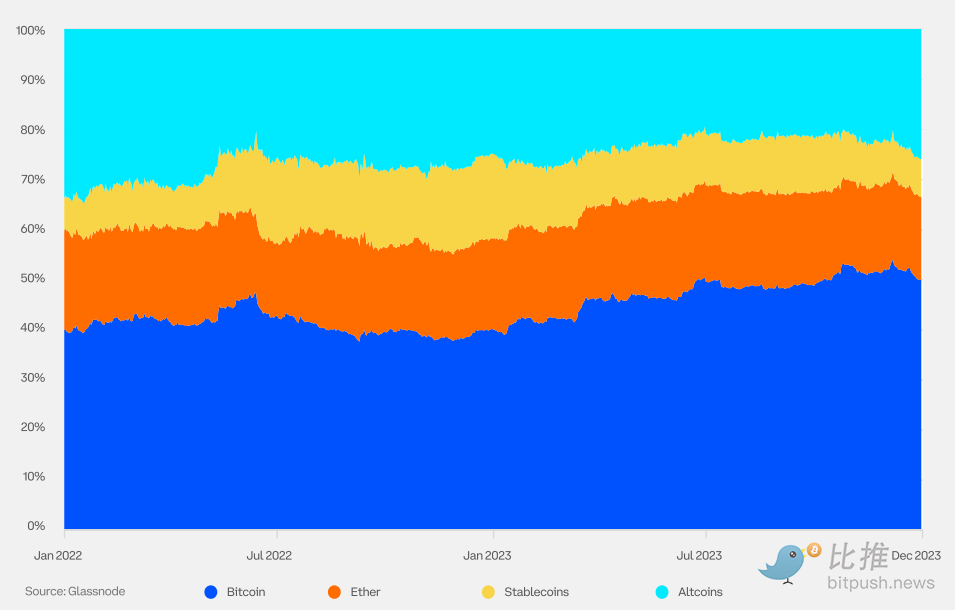
Cryptocurrency Dominance
Cryptocurrency dominance measures the percentage of a specific cryptocurrency’s market cap relative to the total market cap of all cryptocurrencies. In 2023, Bitcoin's dominance increased amid growing optimism around the approval prospects for spot Bitcoin ETFs and a shift of capital toward higher-quality assets. Some market participants also view the upcoming Bitcoin halving in April 2024 as a potential price catalyst.
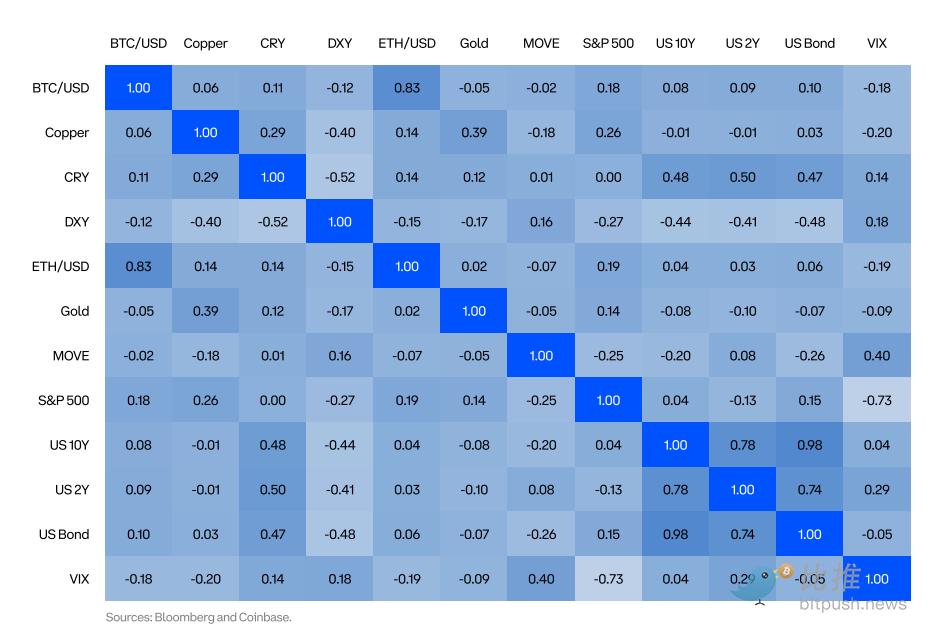
Correlation
Historically, cryptocurrencies have exhibited low correlation with traditional asset classes. 2022 was an exception when nearly all asset classes declined simultaneously, but in 2023 markets reverted to historical norms, suggesting that crypto remains a source of non-systematic risk.
Portfolio Diversification
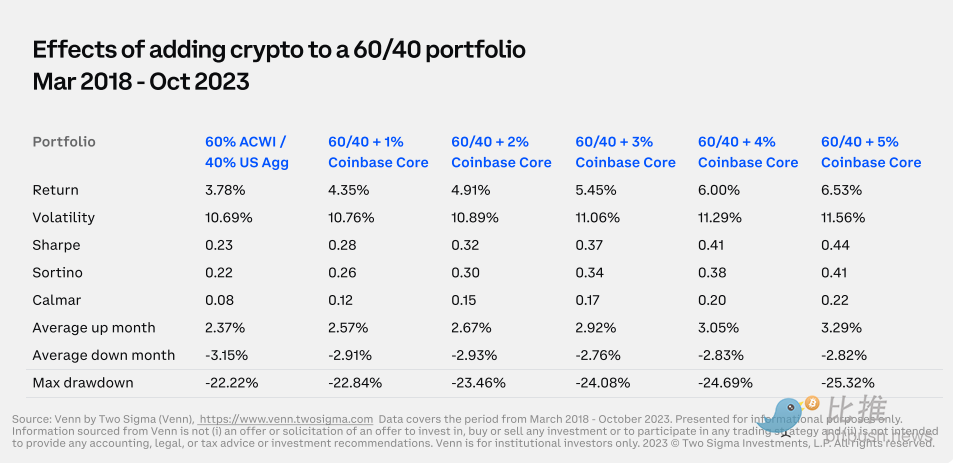
Allocating to cryptocurrencies can enhance diversification and improve returns in traditional portfolios. In this table, we analyze the impact of adding a small allocation to the Coinbase Core Index (COINCORE) into a portfolio composed of 60% MSCI ACWI (note: MSCI ACWI is the Morgan Stanley Capital International All Country World Index) and 40% US Agg (note: Bloomberg Barclays US Aggregate Bond Index). COINCORE is a market-cap-weighted crypto index rebalanced quarterly, with Bitcoin and Ethereum accounting for 65.3% and 28.7% respectively—nearly 94% combined. The analysis covers the period from March 2018 to October 2023, spanning two major crypto market cycles. Results show that adding COINCORE improves both absolute and risk-adjusted portfolio returns.
Stablecoin Circulating Supply
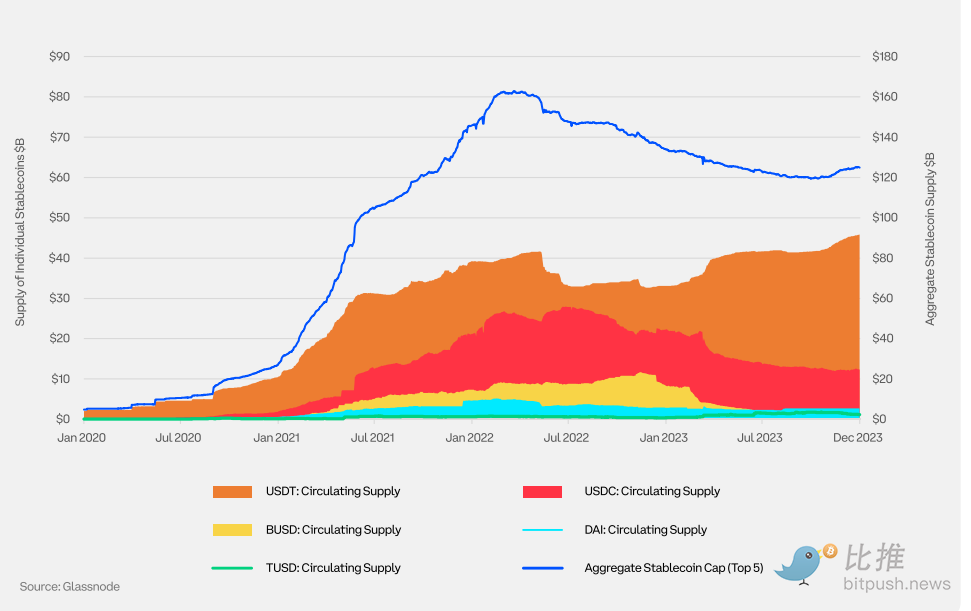
Stablecoins are digital currencies designed to maintain stable value, typically pegged at a 1:1 ratio to the U.S. dollar or other fiat currencies and backed by equivalent reserve assets. Fiat-backed stablecoins dominate the stablecoin market. When evaluating stablecoins, market participants should closely examine the quantity and type of underlying reserves.
Bitcoin
BTC Price and Market Cap
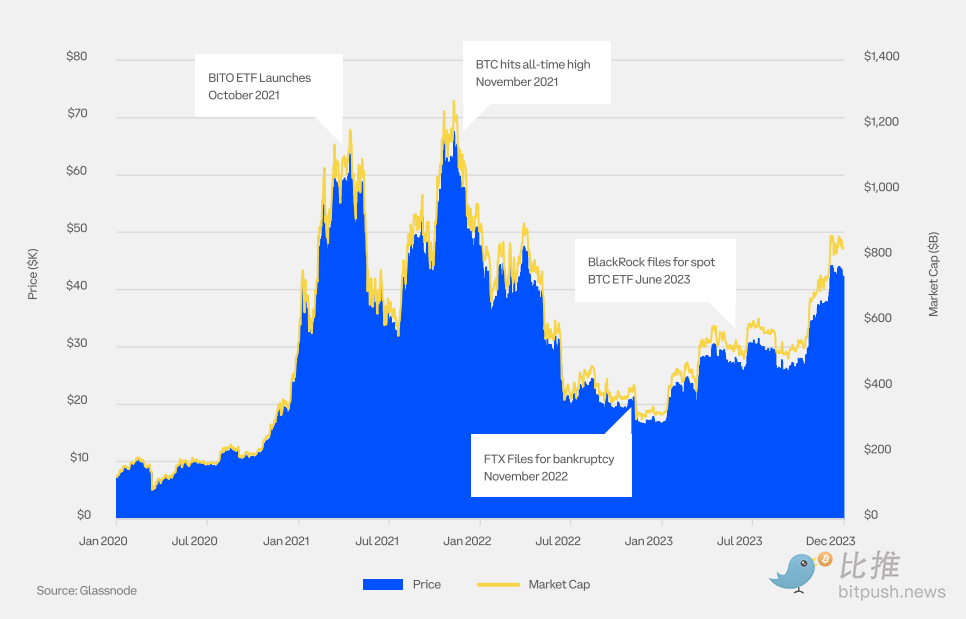
In 2023, Bitcoin’s price rose over 155%. Market participants were encouraged by multiple factors, including slowing inflation and increasing likelihood of approval for spot cryptocurrency exchange-traded funds (ETFs).
BTC Price Performance Since Cycle Low
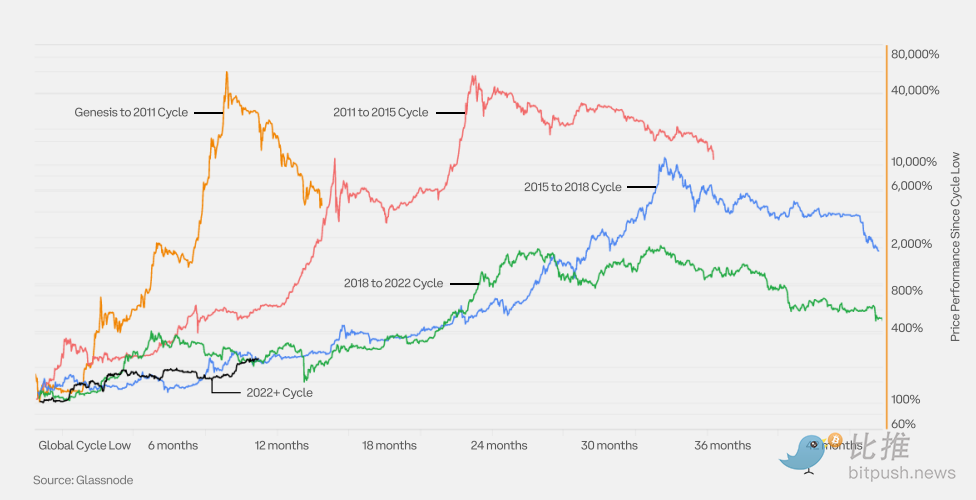
Bitcoin has completed four full bull-bear cycles. This chart compares the current market cycle, which began in 2022, with previous cycles.
Bitcoin Entity-Adjusted Net Unrealized Profit/Loss (NUPL)
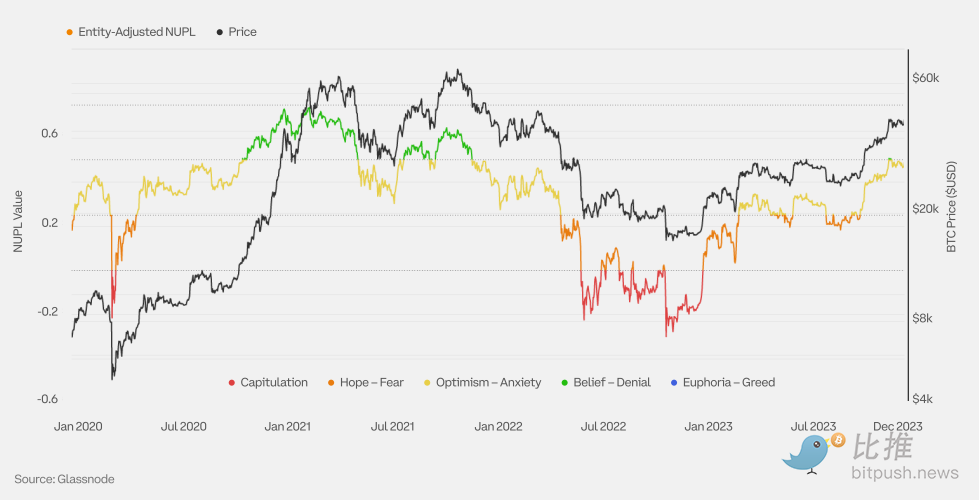
Net Unrealized Profit/Loss (NUPL) represents the difference between relative unrealized profits and relative unrealized losses. The entity-adjusted NUPL excludes transactions between addresses within the same entity ("internal" transfers), providing a more accurate measure of actual economic activity and delivering a refined market signal compared to unadjusted NUPL.
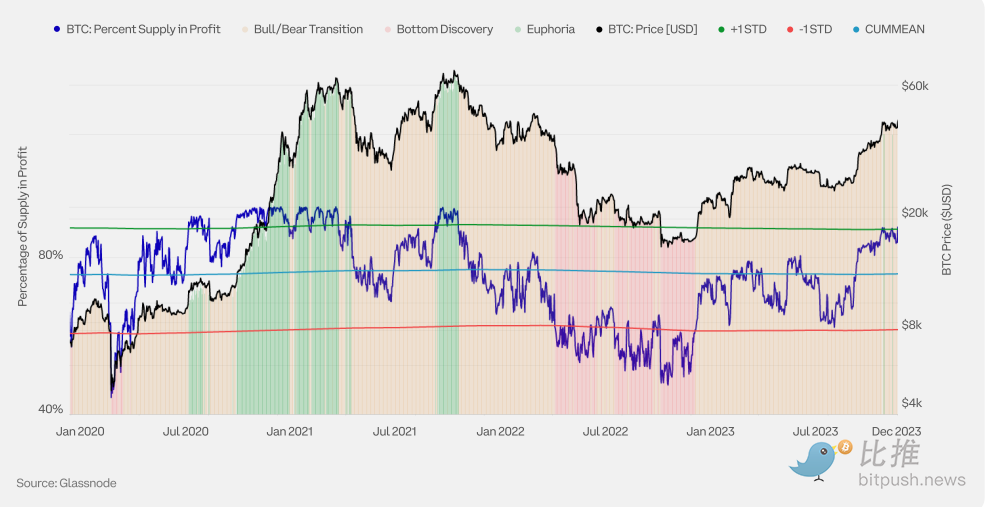
BTC Supply Profitability
The circulating supply of a cryptocurrency consists of loss-making supply (coins acquired above the current spot price) and profit-making supply (coins acquired below the current spot price). Observing supply profitability helps reveal where prices stand within the current market cycle. Past crypto market cycles have exhibited three distinct phases:
Bottom discovery phase: Occurs in the final stage of a bear market when prolonged price depreciation leads to a rising proportion of loss-making supply (profitable supply < 55%).
Frenzy phase: During a bull market, when prices rise parabolically, profit-making supply dominates (profitable supply > 95%).
Bull-bear transition phase: A transitional period between bottom discovery and frenzy, where supply profitability approaches equilibrium (profitable supply between 55% and 95%).
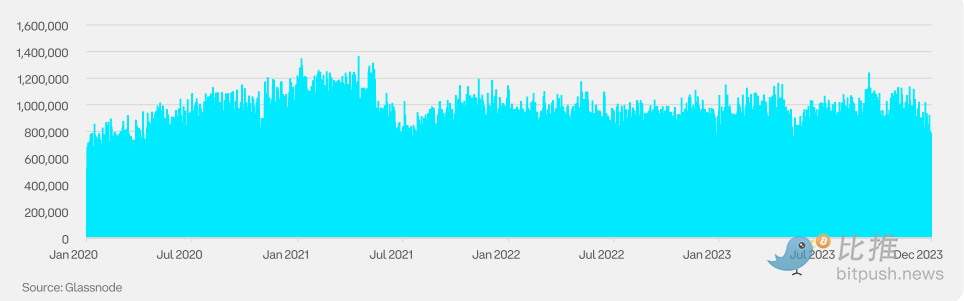
BTC Daily Active Addresses
The number of active addresses refers to the count of unique addresses acting as senders or receivers on the network. This metric is crucial for measuring user adoption, network health, and economic activity.
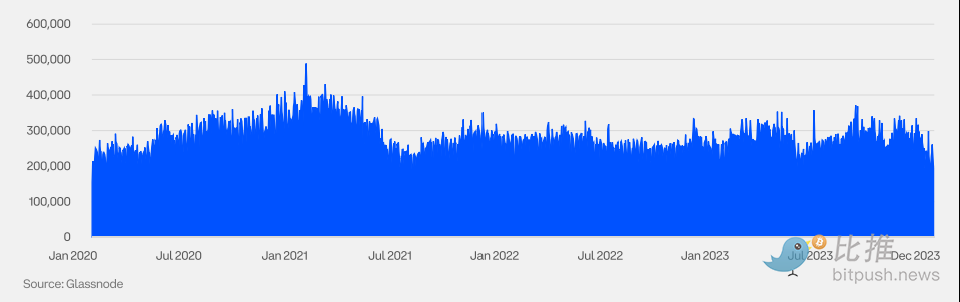
BTC Daily Active Entities
While active address count is important, a single entity may control multiple addresses. Therefore, tracking the number of active entities is also essential. An entity is defined as a cluster of addresses controlled by the same network participant, estimated using advanced heuristics and Glassnode’s proprietary clustering algorithms. Here, “advanced heuristics” refers to sophisticated methods based on experience, knowledge, and observed patterns used to estimate or make decisions under incomplete information.
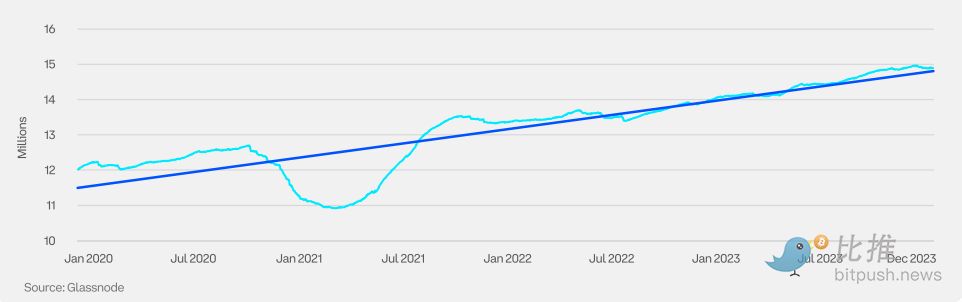
BTC Long-Term Holder Supply
Glassnode defines long-term holders (LTHs) as investors who have held their cryptocurrency for at least 155 days. This holding period generally implies a significantly reduced likelihood of selling. Thus, analyzing LTH behavior serves as an effective indicator for predicting cyclical market movements and identifying potential peaks and troughs.
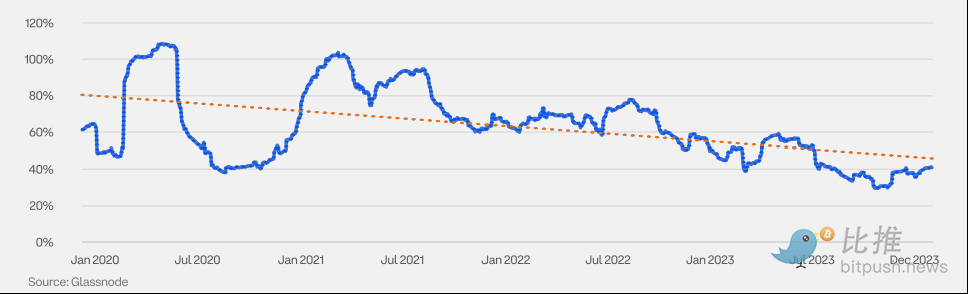
BTC Annualized 3-Month Volatility
As cryptocurrencies mature as an asset class and institutional participation grows, volatility has shown a steady decline.
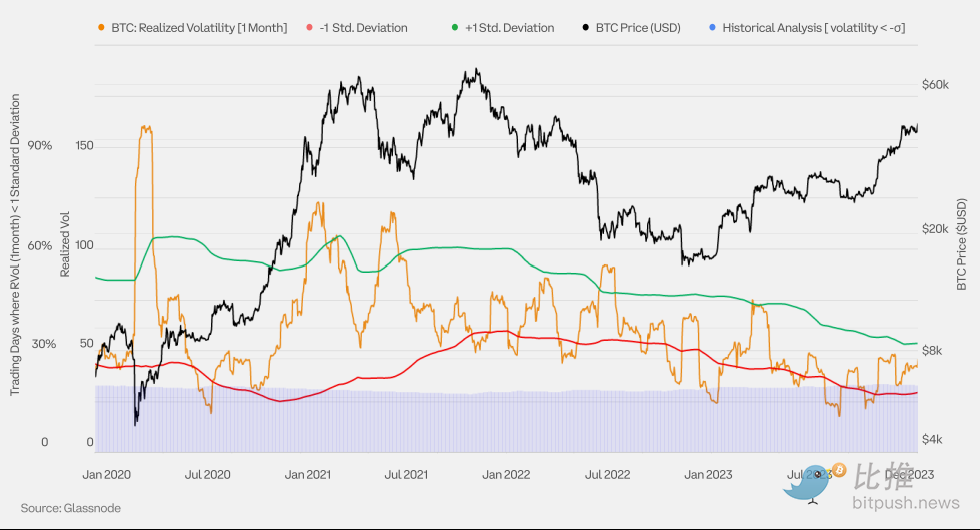
BTC Monthly Realized Volatility Bands
This chart applies Bollinger Bands to one month of realized volatility to identify potential volatility turning points. When volatility deviates from its one-month average by more than one standard deviation, a reversal becomes more likely.
BTC Realized Price and MVRV
Realized price refers to the average acquisition price of the cryptocurrency supply, calculated based on the on-chain transaction value of each coin the last time it moved. It is often considered the on-chain cost basis of the market. MVRV stands for Market Value to Realized Value—the ratio of market value (spot price) to realized value (realized price).
An MVRV of 2.0 means the current price is twice the average cost basis (average holder has doubled their investment).
An MVRV of 1.0 means the current price equals the average cost basis (average holder is at breakeven).
An MVRV of 0.50 means the current price is 50% below the average cost basis (average holder has lost 50%).
Extreme MVRV values can signal periods of market overheating or undervaluation, and times when investor profitability is far above or below average (i.e., realized price).

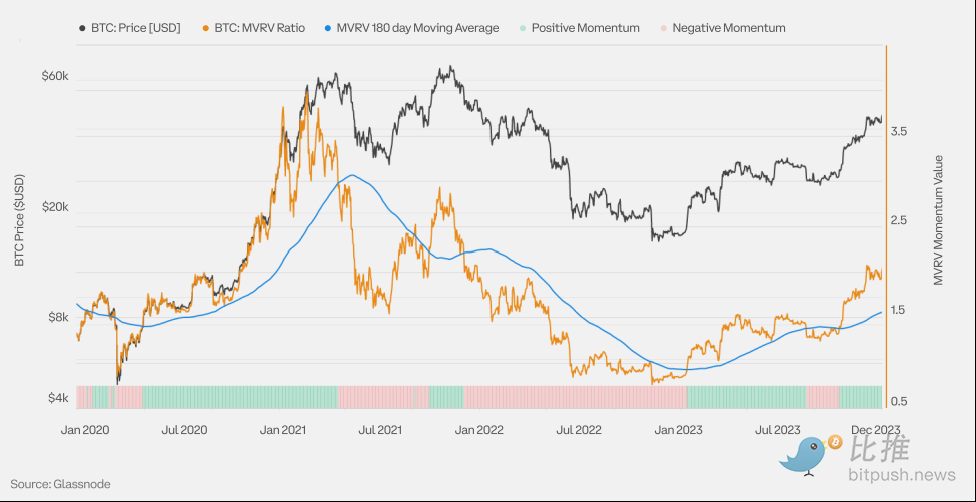
BTC MVRV Momentum
This chart shows the MVRV ratio along with a six-month simple moving average (SMA) used as a momentum indicator. Periods when MVRV is above the six-month SMA typically reflect an uptrend in the macro market, while periods below suggest a downtrend.
Cycle turning points often manifest as strong breaks above or below the six-month SMA. A sharp breakout above suggests large amounts of BTC were acquired below current prices, while a strong break below indicates significant BTC was acquired above current prices.
BTC Derivatives
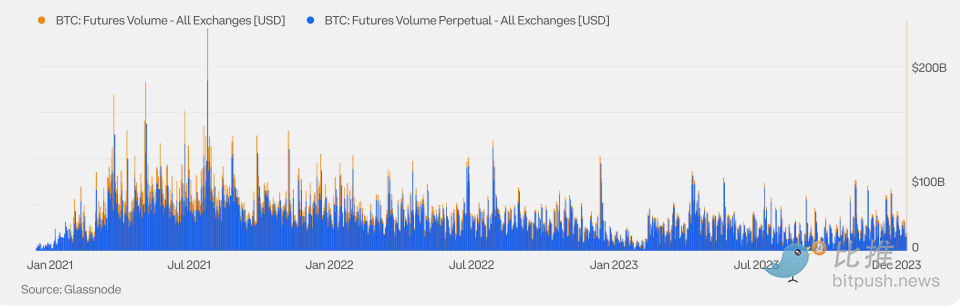
BTC Futures Volume
Crypto futures volume is divided into traditional futures (also called calendar or fixed-date futures) and perpetual futures ("perps"), which are unique to crypto. Perpetual futures have no expiry date, so holders do not need to roll positions.
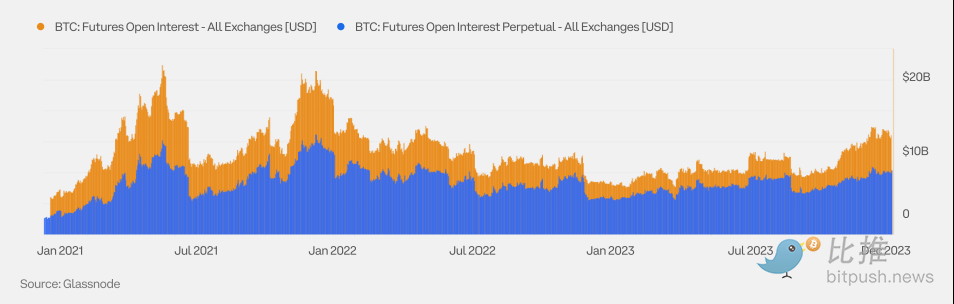
BTC Futures Open Interest
While perpetual futures dominate BTC futures trading volume, traditional futures remain significant in open interest due to widespread use in hedging and cash-and-carry arbitrage strategies.
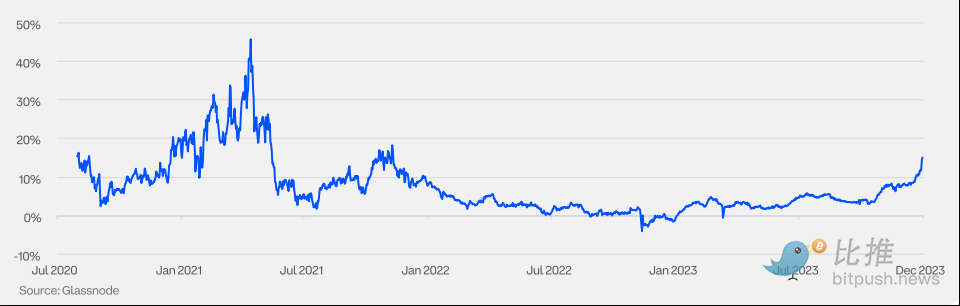
BTC Futures Annualized Roll Basis (3M)
The basis in crypto markets has historically been positive (except during dislocations). Extreme swings in basis, whether positive or negative, are often associated with heightened market sentiment.
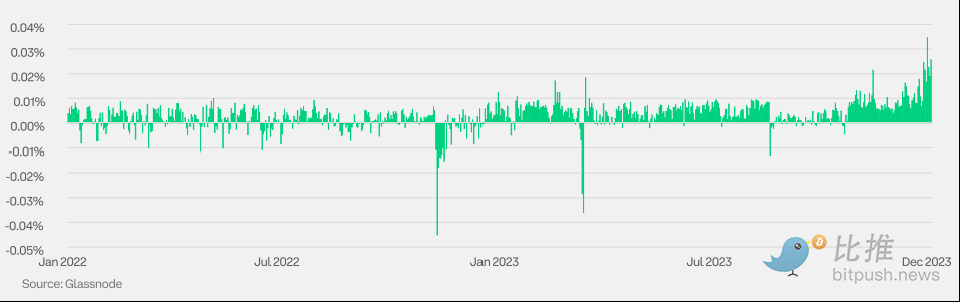
BTC Perpetual Futures Funding Rate
Perpetual futures have no expiry, eliminating the need for position rolling. To keep prices aligned with spot, perpetuals use a funding rate mechanism, where payments transfer periodically between longs and shorts: positive funding means longs pay shorts; negative funding means shorts pay longs.
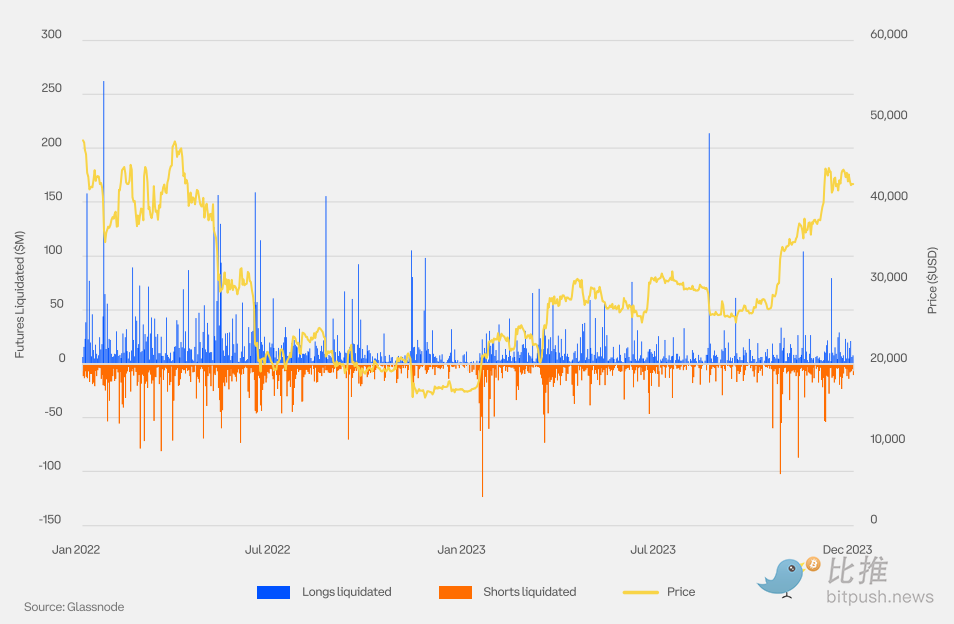
BTC Perpetual Futures Liquidations
Liquidation occurs when an exchange forcibly closes a futures position due to partial or complete loss of initial margin. Large-scale liquidations may signal potential price tops or bottoms amid sharp volatility.
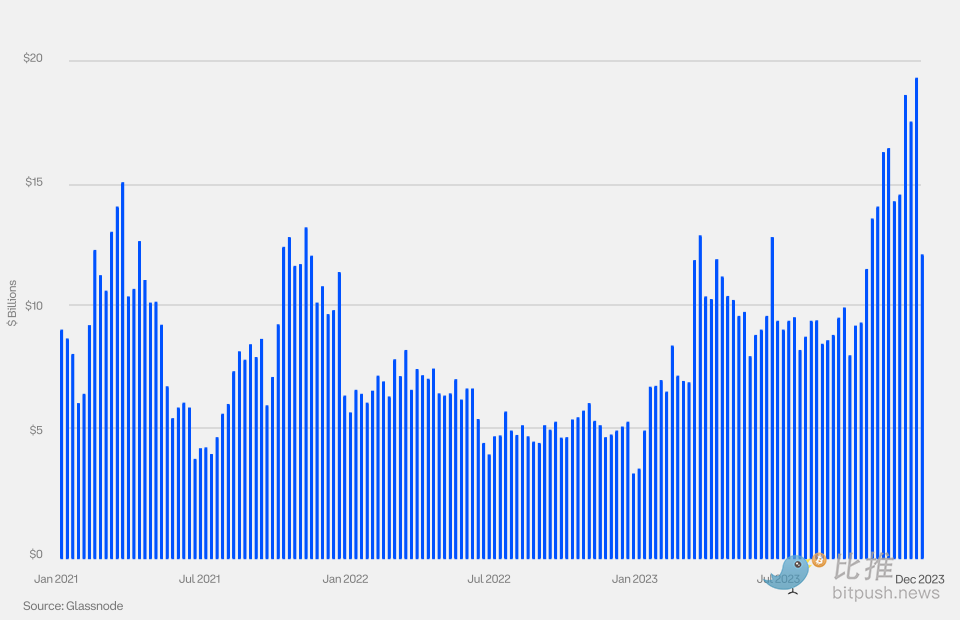
BTC Options Open Interest
With increasing institutional participation, options open interest rose in 2023. In October 2023, BTC options open interest surpassed BTC futures for the first time.
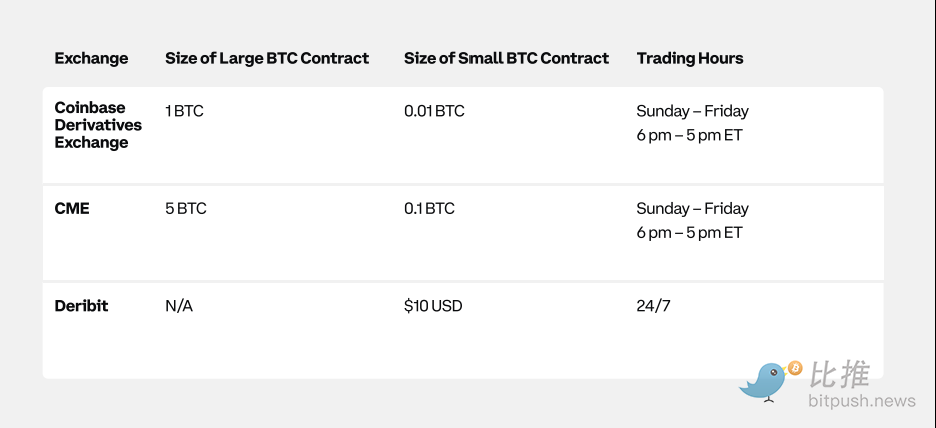
BTC Traditional Futures Specifications
Bitcoin futures are offered by multiple exchanges with varying sizes and denominations.
Upcoming Market Event for BTC: Bitcoin Halving
We anticipate that the upcoming Bitcoin halving in Q2 2024 could boost token performance. However, this relationship remains speculative due to limited supporting evidence. Only three halvings have occurred historically, and no definitive pattern has emerged, especially considering prior events were influenced by various factors such as global liquidity measures.
Ethereum
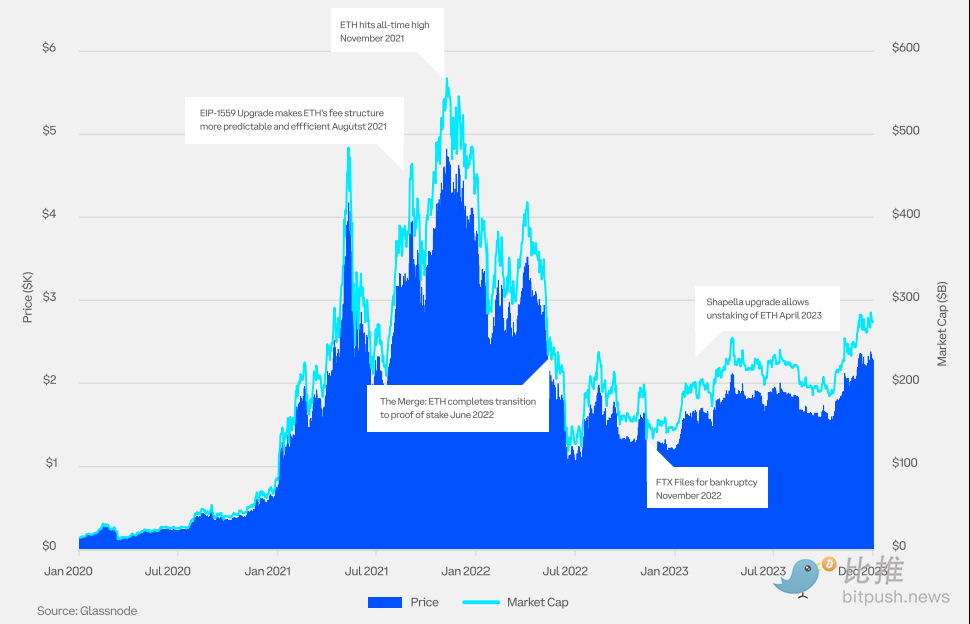
Ethereum (ETH) Price and Market Cap
In 2023, Ethereum (ETH) rose over 90%, buoyed by the successful Shapella upgrade and growing optimism around the approval prospects for spot crypto ETFs.
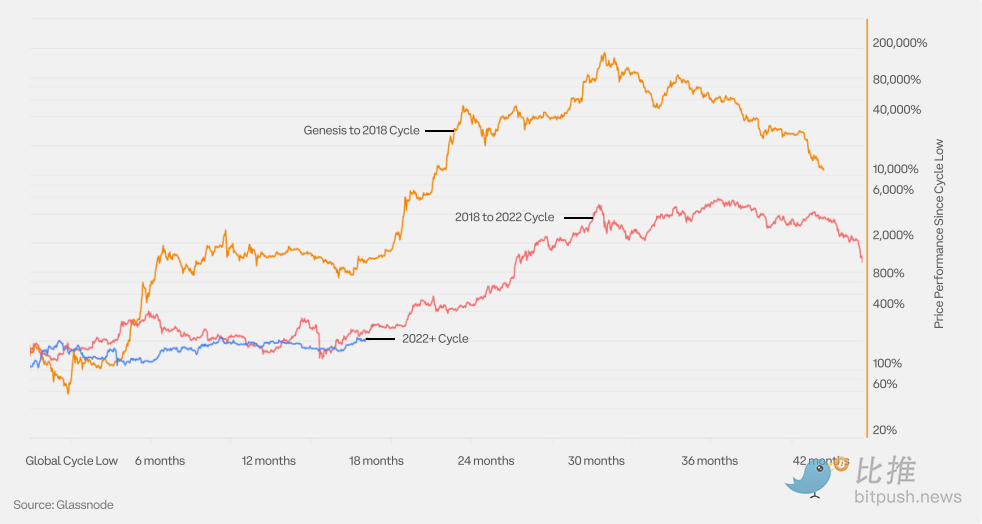
Price Performance Since Cycle Low
Ethereum has completed two full bull-bear cycles. This chart compares the current market cycle, which began in 2022, with prior cycles.
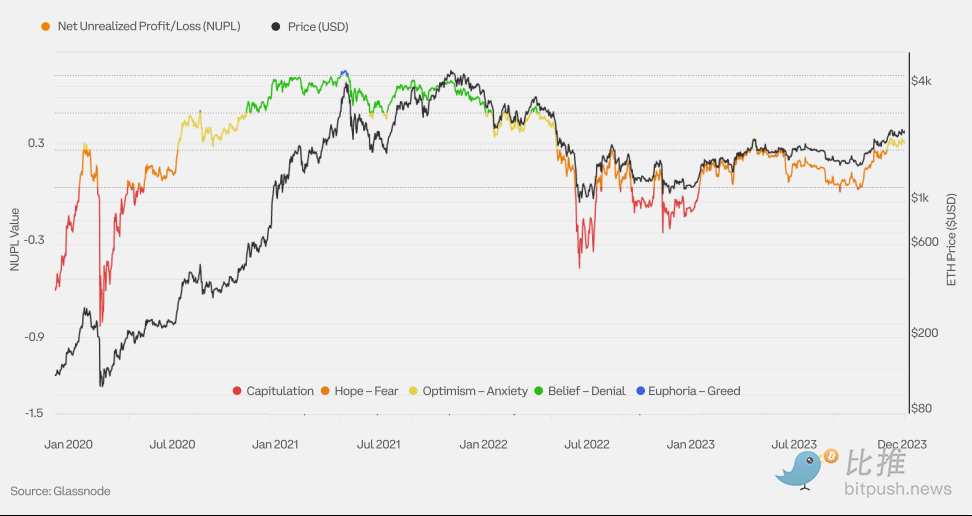
Ethereum Net Unrealized Profit/Loss (NUPL)
Net Unrealized Profit/Loss refers to the difference between relative unrealized profits and relative unrealized losses.
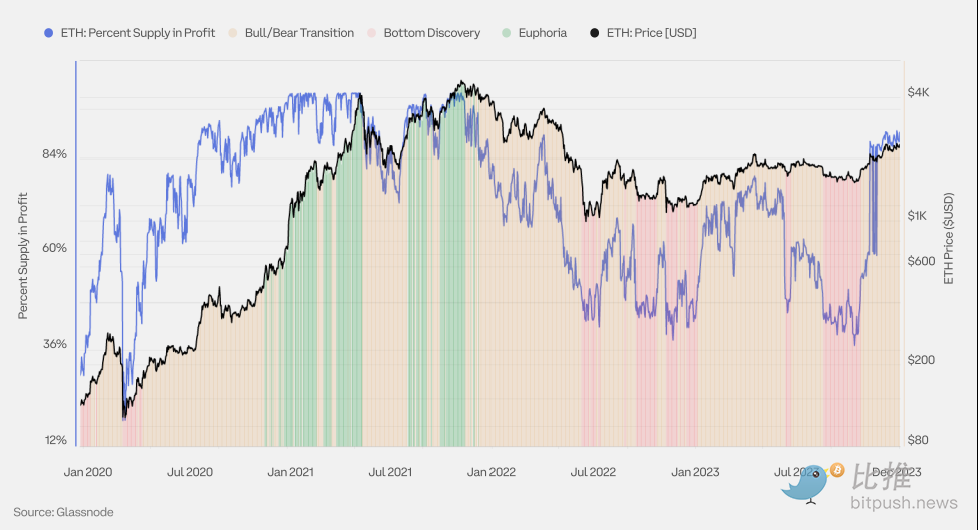
Ethereum (ETH) Supply Profitability
The circulating supply of a cryptocurrency consists of loss-making supply (coins acquired above the current spot price) and profit-making supply (coins acquired below the current spot price). Observing supply profitability helps reveal where prices stand within the current market cycle. Past crypto market cycles exhibit three characteristic phases:
Bottom discovery phase: In the final stage of a bear market, prolonged price depreciation causes the proportion of loss-making supply to rise (profitable supply < 55%).
Frenzy phase: During a bull market with parabolic price growth, profit-making supply dominates (profitable supply > 95%).
Bull-bear transition phase: A transitional period between bottom discovery and frenzy, where profitability nears equilibrium (profitable supply between 55% and 95%).
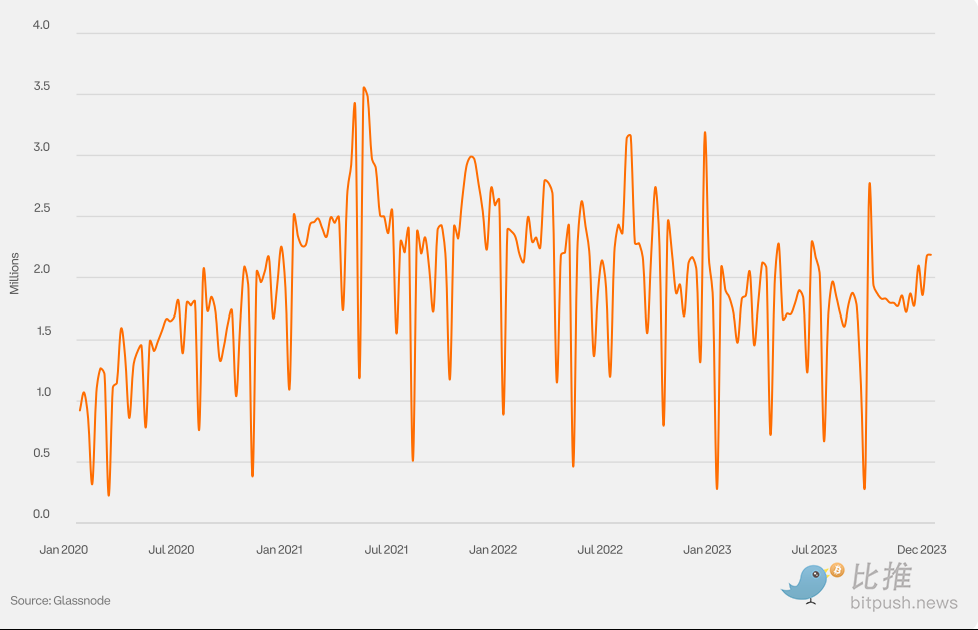
Ethereum (ETH) Weekly Active Addresses
Active address count refers to the number of unique addresses participating as senders or receivers on the network. It is a key metric for gauging user adoption, network health, and economic activity.
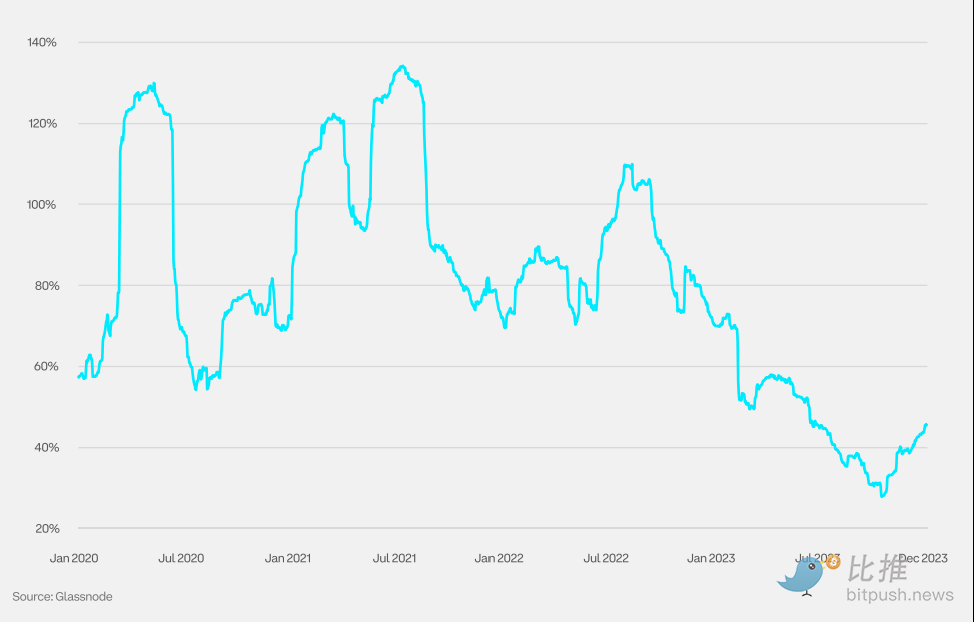
Ethereum Annualized 3-Month Volatility
As cryptocurrencies mature as an asset class and institutional participation increases, volatility shows a steady downward trend.
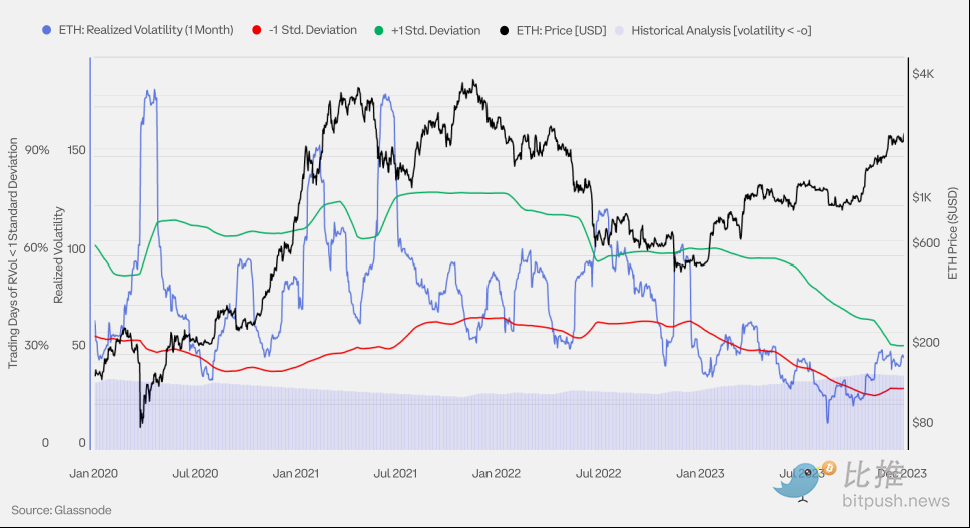
Ethereum Monthly Realized Volatility Bands
This chart uses Bollinger Bands to analyze one month of realized volatility and identify potential turning points. When volatility deviates from its one-month average by more than one standard deviation, a reversal is more likely.
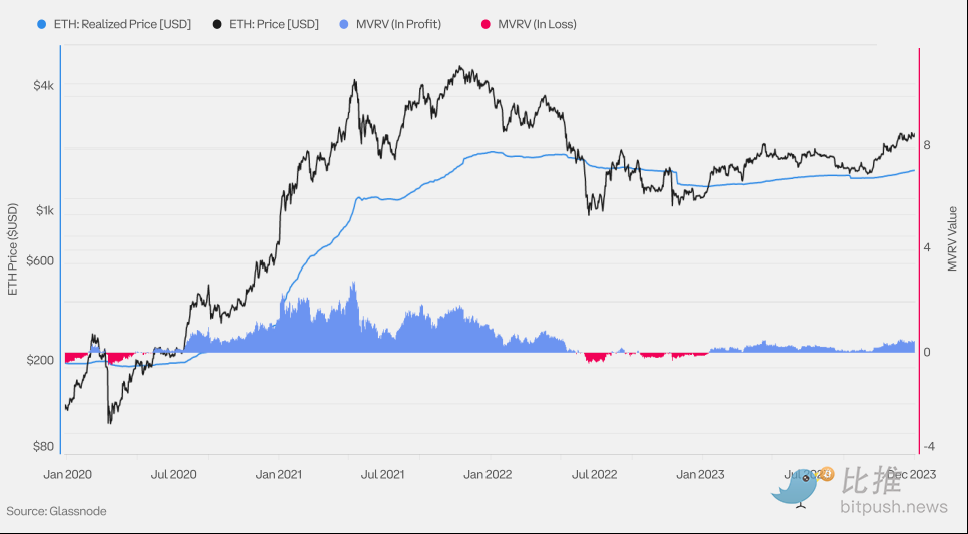
Ethereum (ETH) Realized Price and MVRV
Realized price refers to the average acquisition price of the crypto supply, calculated based on the on-chain value of each coin the last time it moved. It is often seen as the on-chain cost basis. MVRV stands for Market Value to Realized Value—the ratio of market value (spot price) to realized value (realized price).
An MVRV of 2.0 means the current price is double the average cost basis (average holder has doubled their return).
An MVRV of 1.0 means the current price equals the average cost basis (average holder at breakeven).
An MVRV of 0.50 means the current price is 50% below the average cost basis (average holder down 50%).
Extreme MVRV values help identify periods of market overheating or undervaluation, and when investor profitability significantly deviates from the average (realized price).
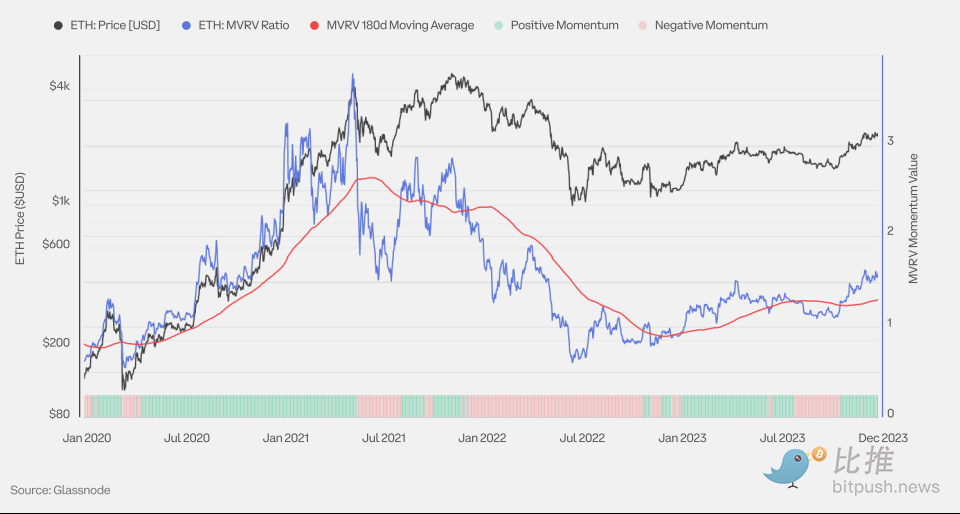
Ethereum (ETH) MVRV Momentum
This chart shows the MVRV ratio and a six-month simple moving average (SMA) used as a momentum indicator. Periods when MVRV is above the six-month SMA typically reflect a macro uptrend, while periods below indicate a downtrend.
Cycle turning points are often marked by strong breaks through the six-month SMA. A sharp breakout above suggests large amounts of ETH were bought below current prices, while a strong break below indicates significant ETH was acquired above current prices.
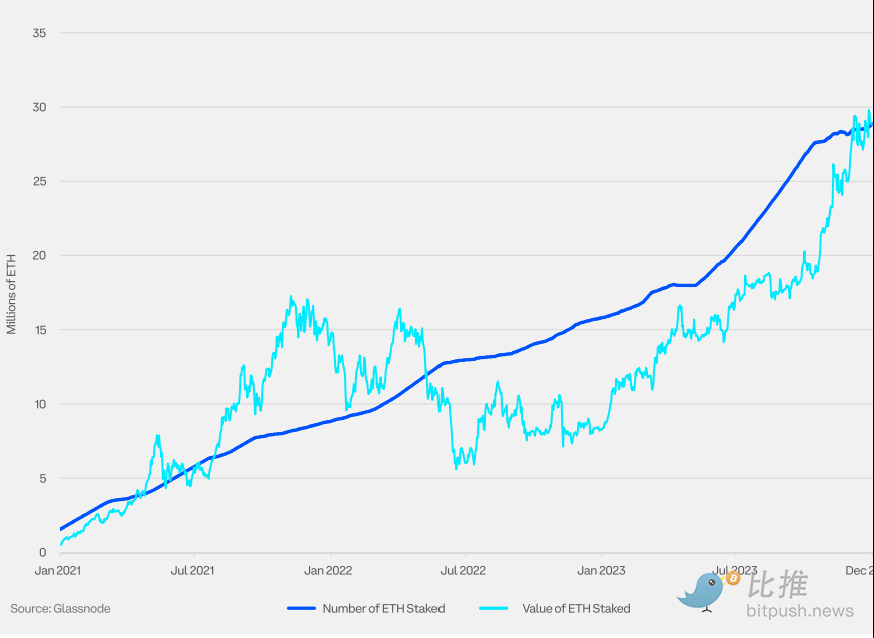
Ethereum (ETH) Total Staked Value
Staking is an investment method on proof-of-stake (PoS) blockchains, where token holders secure the network by locking up assets and earn additional tokens as rewards. To stake ETH, users must lock at least 32 ETH and run a validator node.
Ethereum (ETH) Total Value Locked in DeFi
Total Value Locked (TVL) refers to the aggregate value of assets locked in smart contracts or deposited in decentralized applications on the Ethereum blockchain, including ETH, stablecoins, and various tokens. It is a key metric for assessing financial activity and liquidity within the Ethereum ecosystem.
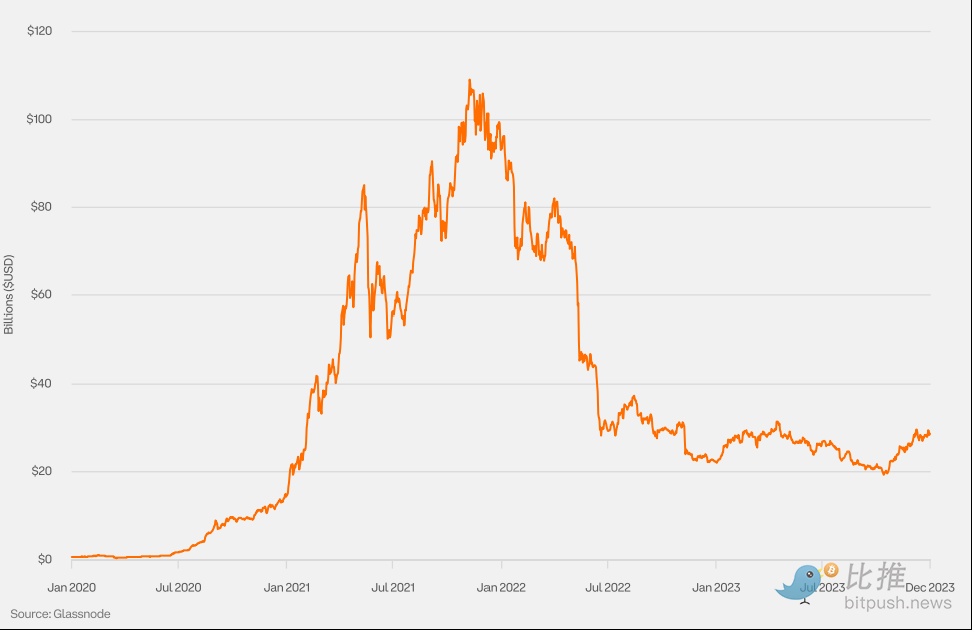
Ethereum (ETH) Derivatives
Ethereum Perpetual Futures Volume
Crypto futures volume is split into traditional futures (also known as fixed or calendar futures) and perpetual futures ("perps"), which are unique to crypto. Perpetuals have no expiry, so holders don’t need to roll. Ethereum futures trading is dominated by perpetuals.
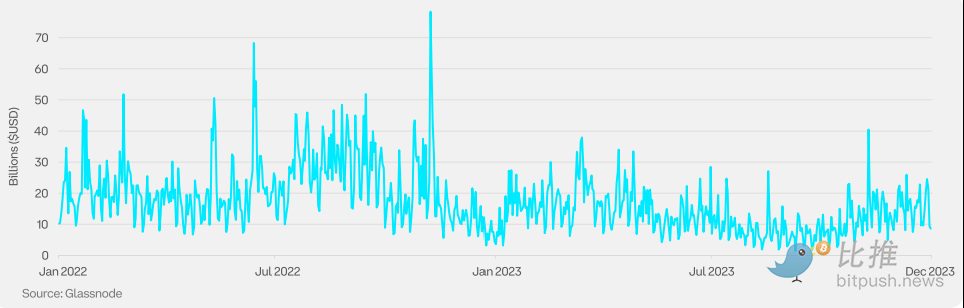
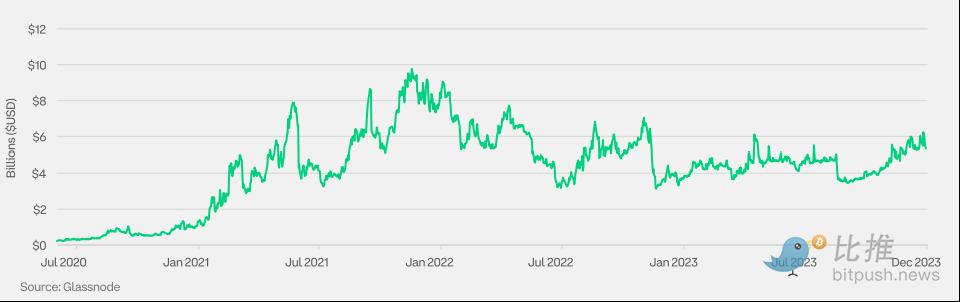
Ethereum Perpetual Futures Open Interest
Ethereum futures open interest is concentrated in perpetuals, with traditional futures representing a smaller share.
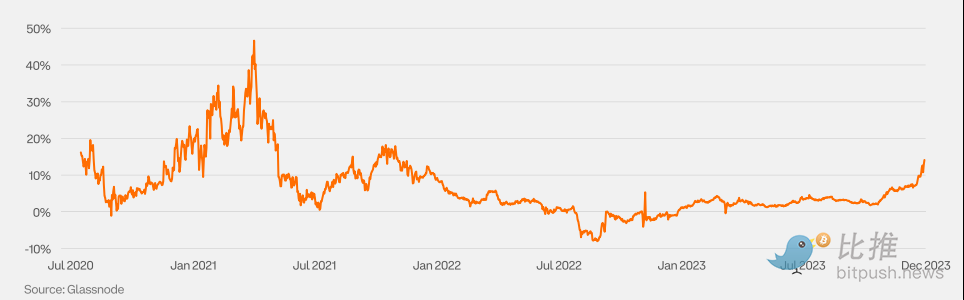
Ethereum Futures Annualized Roll Basis (3M)
The basis in crypto markets is typically positive. Its extreme fluctuations, whether positive or negative, are closely tied to sharp shifts in market sentiment.
Ethereum Perpetual Futures Funding Rate
To maintain alignment between futures and spot prices, perpetual futures employ a funding rate mechanism. Payments transfer periodically between longs and shorts: positive funding means longs pay shorts; negative funding means shorts pay longs.

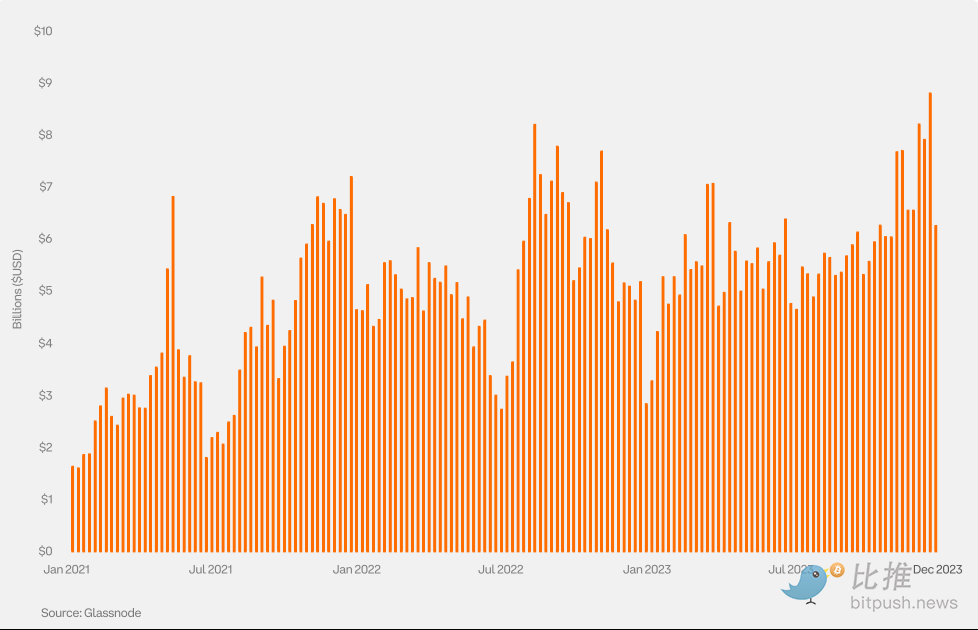
Ethereum (ETH) Options Open Interest (Weekly)
With growing optimism among market participants regarding spot ETF prospects and Ethereum developments in 2024, Ethereum options open interest reached record highs in Q4 2023.
Ethereum (ETH) Traditional Futures Specifications
Ethereum futures are offered by multiple exchanges with different sizes and denominations.

Upcoming Market Events for Ethereum (ETH)
Following the successful completion of the Shapella upgrade, the Ethereum community now eagerly anticipates the upcoming Cancun (“Dencun”) upgrade, expected in Q1 2024. The Cancun upgrade will primarily enhance Ethereum’s scalability and security by introducing Proto-Danksharding. Proto-Danksharding aims to drastically reduce Layer 2 transaction fees and significantly increase Ethereum’s transactions per second capacity.
Join TechFlow official community to stay tuned
Telegram:https://t.me/TechFlowDaily
X (Twitter):https://x.com/TechFlowPost
X (Twitter) EN:https://x.com/BlockFlow_News










