








New York Fed President: How the Onion Theory of U.S. Inflation Guides Future Policy?
TechFlow Selected TechFlow Selected
New York Fed President: How the Onion Theory of U.S. Inflation Guides Future Policy?
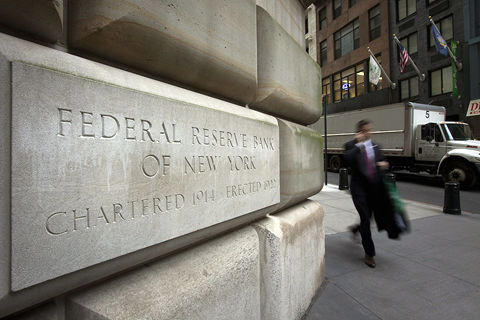
This is the remarks delivered by New York Fed President John C. Williams at the "Exploring Central Bank Innovation" conference hosted jointly by the Federal Reserve Bank of New York and the Bretton Woods Committee.
 Navigating Web3 tides with focused insights
By John C. Williams, President and CEO of the Federal Reserve Bank of New York
Translation: GaryMa, WuShuo Blockchain
Published on November 30; some data may be outdated
Introduction
Good morning, everyone. Welcome to the Federal Reserve Bank of New York. We are pleased to co-host this symposium with the Bretton Woods Committee.
My remarks today will focus on the U.S. economic outlook, including our monetary policy actions and my own economic projections. Before proceeding, I must provide the standard Federal Reserve disclaimer: the views expressed today are my own and do not necessarily reflect those of the Federal Open Market Committee (FOMC) or other members of the Federal Reserve System.
Dual Mandate
The Federal Reserve System has a dual mandate from Congress: to achieve maximum employment and price stability. We are performing well on the employment side of our mandate. Unemployment has remained below 4% for the past 21 months—the longest stretch since the 1960s—and is consistent with my estimate of the longer-run unemployment rate at around 3-3/4%.
However, supply-demand imbalances that began during the pandemic have led to unacceptably high inflation. In June last year, inflation—as measured by the Personal Consumption Expenditures (PCE) price index—surged above 7%, the highest level in 40 years. Since then, we’ve seen inflation decline to 3%. This is a significant and welcome improvement. Nevertheless, inflation remains too high.
Price stability is the foundation of economic prosperity and essential for achieving maximum employment over the long run. The FOMC is committed to returning inflation to its 2% longer-term goal on a sustained basis.
The "Onion" of Inflation
To understand why inflation rose so sharply and how it’s now moderating, I’ve used an “onion” analogy over the past year. Each layer represents a different sector of the economy.
The outermost layer of the inflation onion represents globally traded commodities. Inflation surged as demand for commodities spiked early in the pandemic and rose again following Russia’s invasion of Ukraine. By late June last year, food price inflation had exceeded 10%, while energy price inflation soared above 40%.
Over the past year, tighter monetary policies implemented by central banks worldwide have better aligned global demand with supply. Commodity price inflation has declined significantly. Food price inflation has fallen to about 2.5%, and even the cost of Thanksgiving dinner is lower than a year ago. Energy prices have been declining over the past year, pulling down overall inflation rather than pushing it up.
The second layer consists of core goods excluding food and energy. Here, we’ve also seen the effects of rebalancing supply and demand. Pandemic-era global supply chain bottlenecks, which triggered widespread shortages of goods, are largely behind us. According to the Federal Reserve Bank of New York’s Global Supply Chain Pressure Index—a measure of supply chain disruptions—the index reached its most favorable reading in October, the best level on record since 1998.
As supply and demand rebalance and supply chain pressures ease, core goods inflation is now around 0.25% and appears to be returning toward pre-pandemic levels.
Although the outer layers of our onion have improved the most and fastest, progress is also being made on the inner layers. Core services inflation, which peaked at around 5-3/4% earlier this year, is now about 4-1/2%, with recent readings suggesting further slowing in this category.
A major driver of elevated core services inflation has been the sharp rise in housing prices. During and after the pandemic, strong demand and limited supply pushed up housing price inflation. Recently, rent increases on newly signed leases have returned to rates close to pre-pandemic levels. As these data flow into official statistics, housing inflation should continue to decline. Inflation for services excluding housing and energy has also begun moving in the right direction. Over the past six months, inflation in this category has slowed to about 4%, well below the peak of 5-1/4% reached in December 2021.
Forward-Looking Indicators
This summarizes the state of the various layers of the onion. But what does it imply for the future path of inflation?
Inflation expectations are a key indicator of future inflation. Long-term inflation expectations remain consistent with the FOMC’s 2% objective. According to the New York Fed’s monthly Survey of Consumer Expectations, medium-term expectations, which rose during 2021 and 2022, have now fully reverted to pre-pandemic levels.
Meanwhile, one-year-ahead inflation expectations have declined sharply from a peak near 7% in June last year. They now stand only about three-tenths of a percentage point above the average level observed between 2014 and 2019.
Another useful gauge of underlying inflation trends is the New York Fed’s Multivariate Core Trend (MCT) inflation measure. After peaking near 5-1/2% in June last year, MCT inflation was 2.9% as of September. Other measures of underlying inflation similarly show substantial declines since last year.
Labor Market
Now let me turn to the other side of our dual mandate: employment.
Following the recovery from the pandemic recession, the labor market became exceptionally hot. Demand far outpaced supply. This imbalance contributed to rapid wage growth and higher inflation.
Multiple indicators suggest a gradual rebalancing is underway. Job openings have continued to decline. Quit and hiring rates have returned to pre-pandemic levels, as have perceptions of job availability and hiring difficulty. Although still relatively high, wage growth has slowed significantly.
We’ve also made notable progress on the labor supply side. Labor force participation has increased substantially, and immigration rates have rebounded to pre-pandemic levels. However, there are limits to how much supply can expand, and further reduction in demand will likely be needed to fully restore balance in the labor market.
Restrictive Monetary Policy Stance
The FOMC has achieved a restrictive monetary policy stance. This helps align demand with supply and brings inflation back toward our 2% longer-term goal. Earlier this month, the FOMC kept the target range for the federal funds rate unchanged at 5-1/4 to 5-1/2%.
Beyond our policy actions, financial conditions have tightened, partly due to rising long-term Treasury yields since this summer. While statistical models of Treasury yields typically attribute much of the rise to increases in term premiums, market participants hold diverse views on any single explanation, with no consensus. Rising yields and volatility likely reflect heightened uncertainty about the economic outlook and future interest rates.
Given the tightening of financial and credit conditions, I expect GDP growth to slow to about 1-1/4% next year and the unemployment rate to rise to around 4-1/4%.
I anticipate inflation will continue to decline toward our 2% longer-term target. As previously mentioned, base effects should help push inflation lower. Moreover, based on New York Fed research showing a strong relationship between the Global Supply Chain Pressure Index and goods price inflation, I expect additional disinflationary pressure in this sector. My forecast is for overall PCE inflation to be about 3% in 2023, decline to around 2-1/4% next year, and approach 2% in 2025.
Nonetheless, the outlook remains highly uncertain, and our decisions will remain data-dependent. Risks are two-sided: persistent stubborn inflation versus risks of economic and labor market weakness.
In weighing these risks, based on current information, I assess that we may have already reached—or are very close to—the peak level of the target range for the federal funds rate. Models estimating the policy stance relative to the longer-run neutral rate, incorporating current-quarter projections, indicate that monetary policy is quite restrictive—in fact, among the most restrictive in 25 years. I expect we will maintain a restrictive stance for some time to fully restore balance and return inflation sustainably to our 2% longer-term goal.
I will continue to closely monitor all data to assess whether the current policy stance is sufficient to achieve our inflation objective. If pricing pressures and imbalances persist beyond my expectations, further policy firming may be necessary.
Before concluding, a brief note on our balance sheet. At our most recent meeting, the FOMC indicated it would continue reducing its holdings of Treasury securities, agency debt, and agency mortgage-backed securities according to the framework announced in 2022. We have reduced our securities holdings by over $1 trillion, with no signs of adverse effects on market functioning.
Commitment to Our Goals
Since I first introduced the inflation onion a year ago, we have made significant progress in reducing inflation and restoring economic balance.
But our work is far from done. I am committed to achieving our 2% longer-term inflation goal and laying a solid foundation for the future of our economy.
Join TechFlow official community to stay tuned
Telegram:https://t.me/TechFlowDaily
X (Twitter):https://x.com/TechFlowPost
X (Twitter) EN:https://x.com/BlockFlow_News
 @NewYorkFed









