

In-Depth Analysis of Grayscale Trust: Why Can You Buy Ethereum at Half the Price?
TechFlow Selected TechFlow Selected
In-Depth Analysis of Grayscale Trust: Why Can You Buy Ethereum at Half the Price?
Discuss how to build an index enhancement strategy for ETHE.
Author: LD Capital
Grayscale Ethereum Trust (ETHE), as the largest U.S.-listed equity product tracking Ethereum, holds a substantial 3 million ETH. However, its secondary market trading price currently trades at a nearly 50% discount to its net asset value (NAV). In our previous report, we analyzed the causes behind this premium/discount dynamic and discussed potential scenarios for narrowing the discount. Additionally, based on cyclical trends, we argued that if one is positioning for a potential bull market, ETHE may offer greater leverage compared to direct ETH spot exposure.
However, historical data analysis also reveals that ETHE exhibits suboptimal risk-return metrics—underperforming ETH/USD across risk-adjusted returns, maximum drawdown, and volatility. This suggests that long-term holders of ETHE may need to implement targeted return-enhancement strategies; otherwise, if a bull market does not materialize quickly, ETHE could underperform the broader market.
As the second installment in this series, this report explores how to construct an index enhancement strategy for ETHE—capturing long-term beta while incorporating active management to generate alpha, thereby improving the long-term holding experience for investors.
Overview of Grayscale ETHE Statistical Characteristics (Risk and Return Overview of Grayscale ETHE)
First, let's analyze the core characteristics of Grayscale ETHE, the central instrument of this strategy:
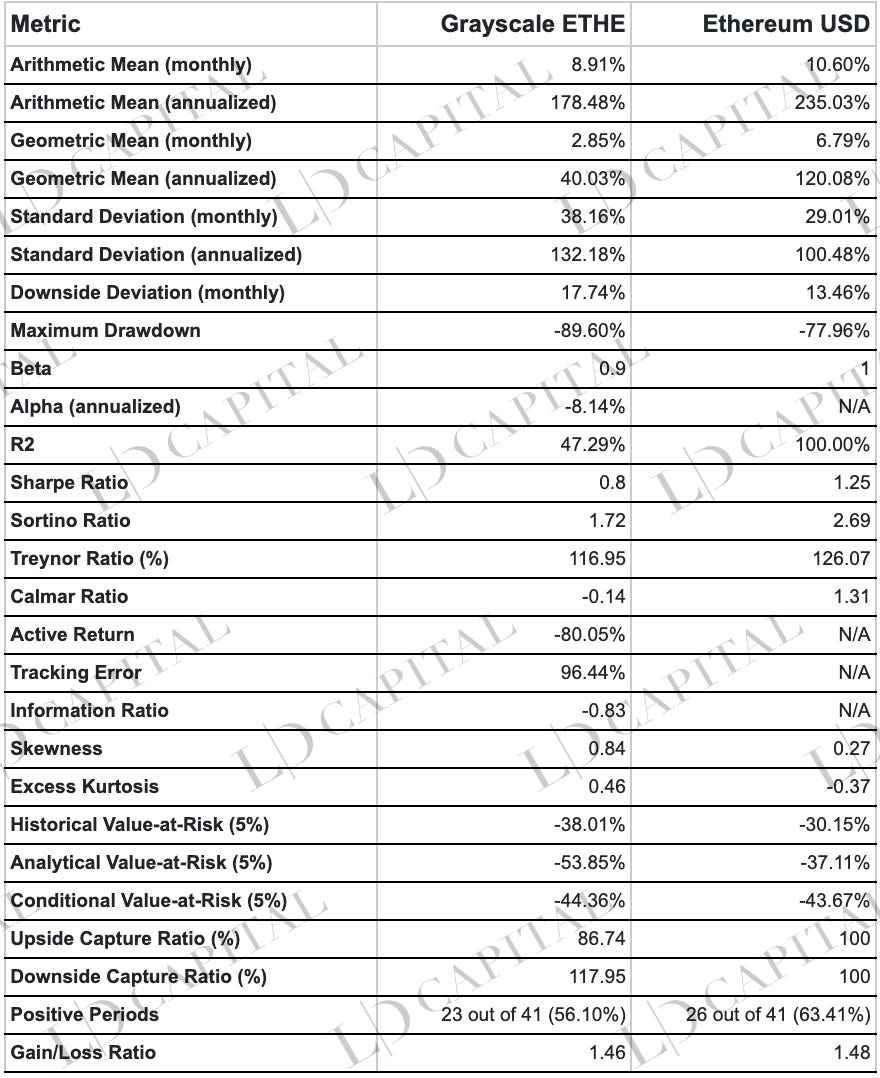
The above table presents performance statistics for ETHE and ETH-USD from January 1, 2020, to April 30, 2023, based on monthly returns. Across key risk metrics—including alpha coefficient, maximum drawdown, value-at-risk, and risk-adjusted returns—ETHE underperforms ETH spot. However, its return distribution exhibits positive skewness and fat tails, indicating greater potential for upside volatility.
-
Return Performance: The arithmetic average monthly return for Grayscale ETHE is 8.91%, with an annualized return of 178.48%. In comparison, ETH spot has an arithmetic average monthly return of 10.60% and an annualized return of 235.03%. On these measures, ETH spot outperforms ETHE. Geometric mean annualized returns further highlight this gap: 40.03% for ETHE versus 120.08% for ETH spot, underscoring ETH’s superior long-term investment performance.
-
Risk Profile: ETHE’s monthly and annualized standard deviations are 38.16% and 132.18%, respectively—higher than ETH spot’s 29.01% and 100.48%, indicating higher price volatility and risk. Furthermore, ETHE’s maximum drawdown is -89.60%, worse than ETH spot’s -77.96%, reinforcing its elevated risk profile.
-
Risk-Adjusted Returns: The Sharpe Ratio and Sortino Ratio measure risk-adjusted returns. ETHE’s Sharpe Ratio is 0.8 versus ETH spot’s 1.25; its Sortino Ratio is 1.72 versus ETH spot’s 2.69. These figures confirm that, after adjusting for risk, ETH spot delivers better returns.
-
Market Correlation: ETHE’s beta coefficient is 0.9, suggesting high systematic risk relative to ETH. However, its alpha is -8.14% annually, indicating that after accounting for market risk, ETHE failed to generate positive excess returns over the observed period.
-
Profit-Loss Ratio: ETHE’s profit-loss ratio is 1.46, slightly below ETH spot’s 1.48, showing minimal difference in profitability patterns.
-
Winning/Losing Periods: Over 41 periods, ETHE posted positive returns in 23 (56.10%), while ETH spot achieved gains in 26 (63.41%). This indicates ETH spot had more frequent winning cycles.
-
Value-at-Risk (VaR): ETHE’s historical VaR (5%) is -38.01%, and analytical VaR (5%) is -53.85%, compared to ETH spot’s -30.15% and -37.11%, respectively. This implies ETHE faces higher potential losses under the same confidence level.
-
Conditional Value-at-Risk (CVaR): ETHE’s CVaR (5%) is -44.36%, marginally higher than ETH spot’s -43.67%, suggesting similar tail loss magnitudes during extreme downside events.
-
Upside and Downside Capture Ratios: ETHE’s upside capture ratio is 86.74%, and downside capture ratio is 117.95%, meaning it captures less of the market’s upward movements but suffers disproportionately during downturns.
-
Return Distribution Shape: ETHE’s excess kurtosis is 0.46 and skewness is 0.84, versus ETH’s -0.37 and 0.27. This indicates ETHE’s return distribution is more peaked and right-skewed, suggesting a higher probability of extreme outcomes (positive or negative). The positive skew implies larger positive extremes, which may indicate higher investment risk but also greater upside potential during favorable volatility.
Why does ETHE, despite being backed by ETH spot, consistently underperform?
This is primarily due to its unique product structure, market dynamics, and shifting macro environment—initially trading at a premium (2019–mid-2021) and later falling into a steep discount (2021–present). The nearly 90% price collapse from peak premium to deep discount has significantly dragged down its overall risk-return metrics.
The root cause of premiums and discounts lies in ETHE’s non-redeemable trust structure. Premiums arose because ETHE offered easier access than holding ETH directly—lower custody costs made it attractive to traditional institutional investors and retail participants. Additional drivers included balance sheet accounting advantages, tax efficiency, and regulatory bypass benefits. Conversely, the emergence of discounts stemmed from four factors: the inability to redeem shares, limited arbitrage mechanisms, opportunity cost discounting, and competitive pressures from newer products.
For further details, see Part One of this series: “Is Buying ETH at a 50% Discount an Opportunity or a Trap? A Deep Dive into Grayscale Trust”.
Principles of Index Enhancement Fund Strategy
Fundamental Concepts and Rationale Behind ETHE Index Enhancement
Index enhancement is a portfolio management approach aiming to amplify returns of a base index or portfolio and outperform it on both absolute and risk-adjusted bases.
The strategy uses ETHE as the core holding, allocating no less than 60% of capital to ETHE spot, with the remainder deployed into cash, fixed-income instruments, U.S./Canadian-listed blockchain and crypto-related equities, and options derivatives on those stocks.
Index enhancement blends active and passive management. Because of the active component, it introduces manager discretion and subjective judgment, adding layers of risk beyond pure market exposure inherent in passive funds.
The primary source of excess return in an ETHE-based portfolio is the bet on convergence between ETHE’s market price and its NAV. However, given ETHE’s historically weak performance metrics, to improve holding experience during the wait, we must:
-
Diversify holdings. Introduce assets with moderate correlation, stable returns, and lower volatility—such as cash, fixed income, blockchain/crypto equities, and their option derivatives—to correct ETHE’s poor risk-return profile.
-
Maintain high ETHE allocation. As prior data suggest ETHE may have strong upside volatility potential, we should maintain a high weighting in ETHE to avoid missing extreme rallies. Unless facing major risks (e.g., Ethereum credibility crisis, Grayscale financial distress), ETHE allocation should not fall below 80%.
-
Enhance via derivatives. When enhancing through equities, using options strategies offers advantages over simple stock ownership. Excess returns come mainly from capturing volatility risk premium in options pricing, supplemented by sophisticated structures tailored to specific market views.
-
Leverage securities lending and borrowing. Margin financing and securities lending can enhance returns in two ways: leveraging long positions when bullish, or earning income by lending shares. If ETHE or selected equities become eligible for margin or lending programs in the future, this would be a viable addition.
-
Participate in new issuances (IPOs/IDOs). As regulations evolve, more traditional brokers are entering crypto trading. It’s conceivable that regulated platforms will offer initial crypto offerings. Historically, ICOs and IDOs have delivered outsized returns. With existing holdings, investors could participate in such events with minimal additional cash.
Implementation Details
Since points 4 and 5 are currently impractical, we focus on implementing points 1–3:
Benchmark Selection
Use ETHE as the primary benchmark index, with ETH/USD as a secondary reference. Since ETHE is a single-asset rather than broad-market index, it represents a concentrated “narrow-basis” exposure. Therefore, active management should prioritize volatility control and drawdown mitigation to add meaningful value.
Capital Allocation
To prevent significant deviation from the benchmark, at least 60% of capital must remain in ETHE. Under normal conditions, ETHE weight should be maintained between 80–90%, with enhancement allocations capped at 10–20%.
Equity Selection for Enhancement
Currently, ETHE trades on the OTCQX market—an over-the-counter (OTC) exchange where securities typically have limited liquidity and no standardized options market. As such, investors cannot use brokerage balances to execute covered call strategies or engage in margin/lending activities. Hence, the primary enhancement focus becomes selective allocation to blockchain and crypto-related equities.
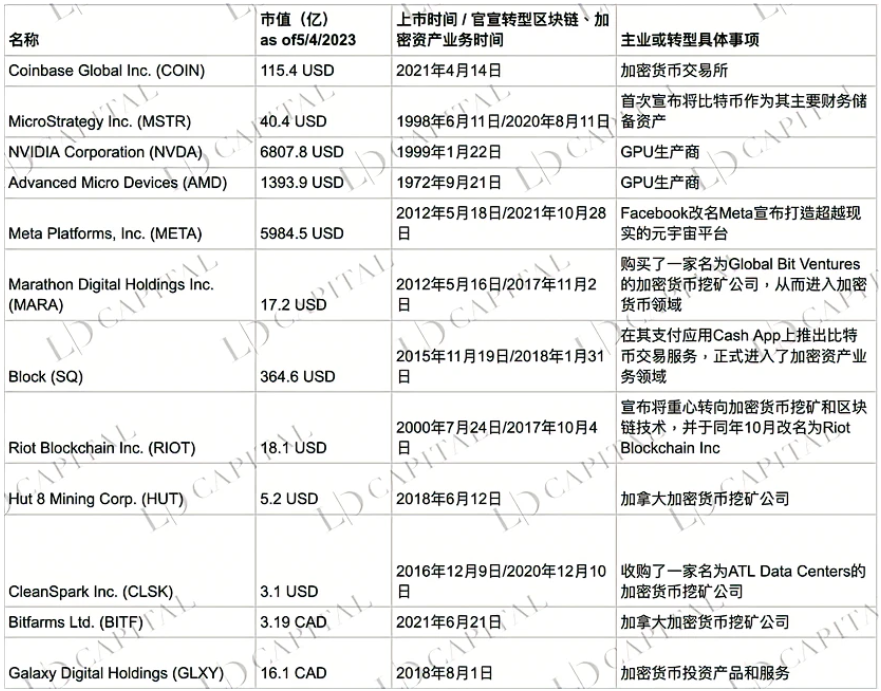
Table 1: Major Blockchain or Crypto-Related Stocks Listed in the U.S. and Canada
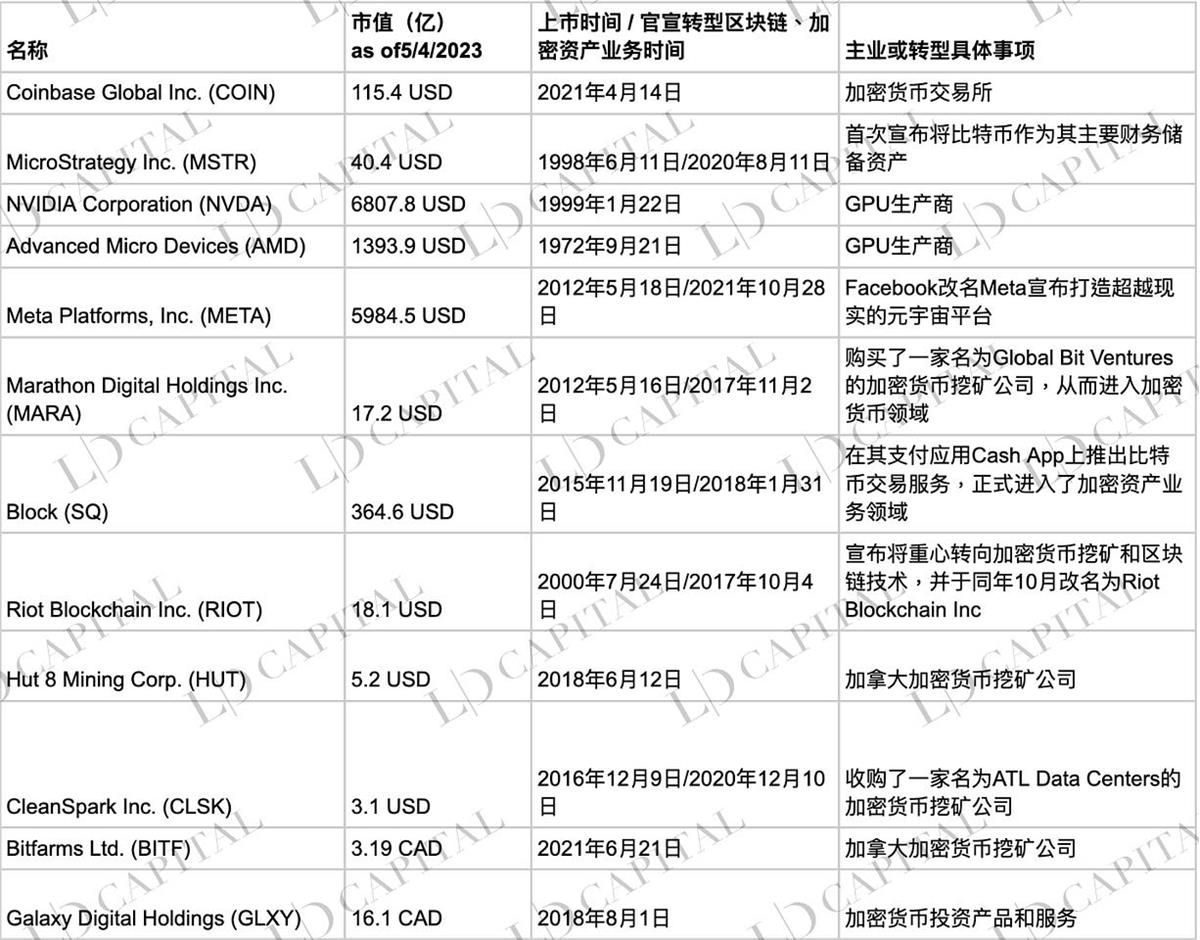
Table 2: Major Blockchain or Crypto-Related ETFs Listed in the U.S. and Canada
Investment selection criteria include:
-
Companies with clear business plans tied to the crypto ecosystem or indirect beneficiaries of industry growth—such as crypto miners, mining equipment/chip suppliers, crypto financial service providers, other institutions serving crypto clients, and metaverse companies;
-
Fund products whose main strategy focuses on cryptocurrency spot or derivatives;
-
Shares of fund products investing in the above two categories.
Why choose crypto equities?
Crypto equities provide moderate correlation with crypto assets, enabling secure, convenient, and compliant exposure to the crypto market.
Correlations between crypto equities and crypto assets typically range from moderate (0.40) to strong (0.90). Historically, many crypto company stocks exhibit beta values greater than 1 relative to cryptocurrencies, offering amplified exposure. This makes them effective tools for gaining leveraged access to crypto price movements. Moreover, beyond ETHE, some crypto funds (e.g., BITW) also trade below NAV due to structural issues, presenting opportunities to bet on discount reversals.
Table: Monthly Return Correlations Among Major Crypto Stocks, ETH, and ETHE (05/01/2021–05/04/2023):
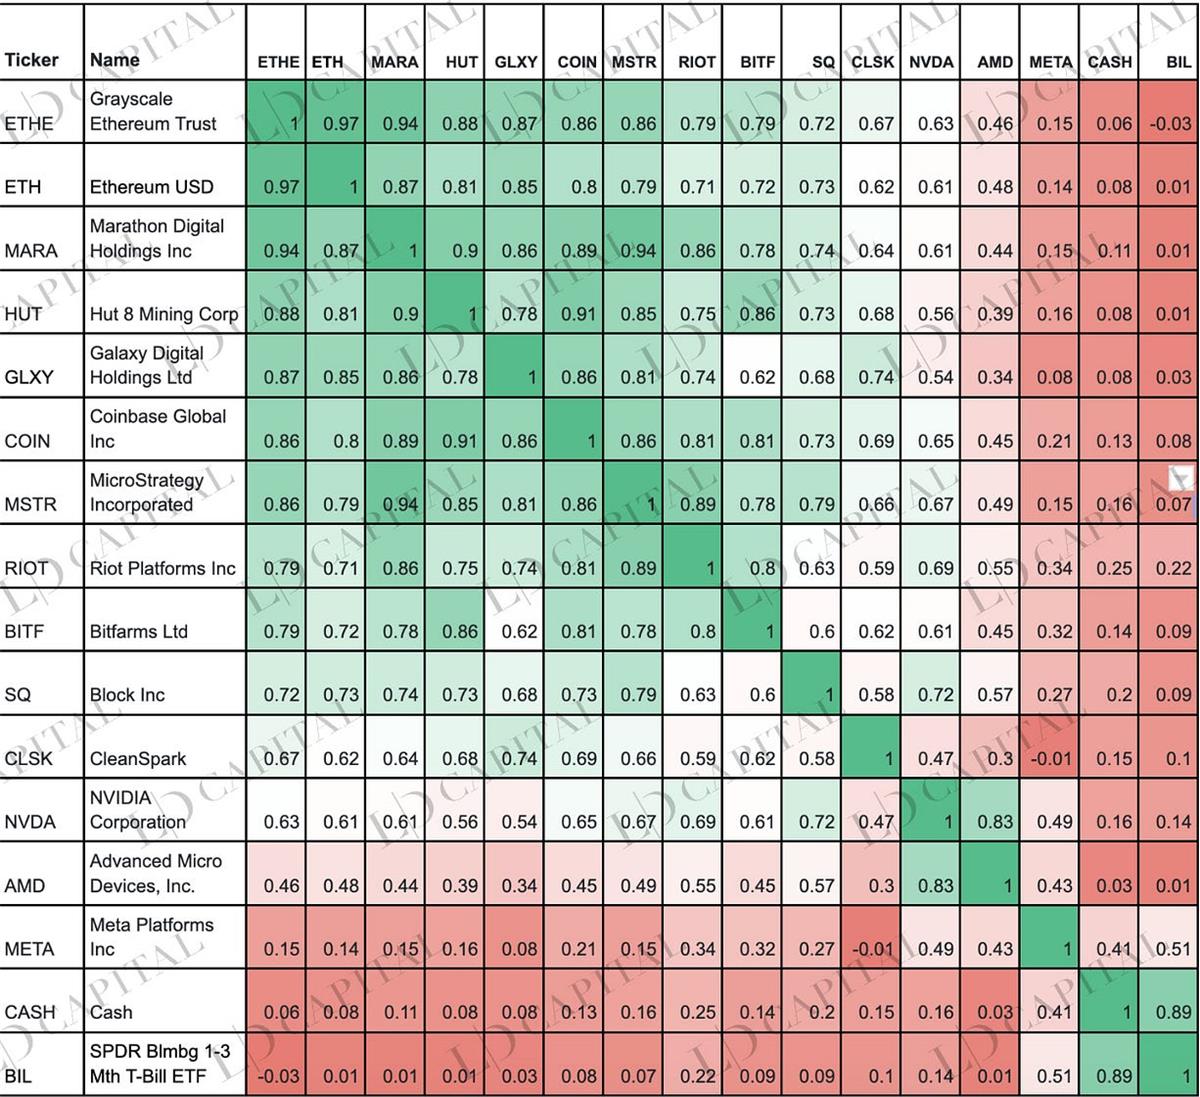
Note: Data limited by COIN stock listing in May 2021; CASH represents cash
Derivatives Enhancement
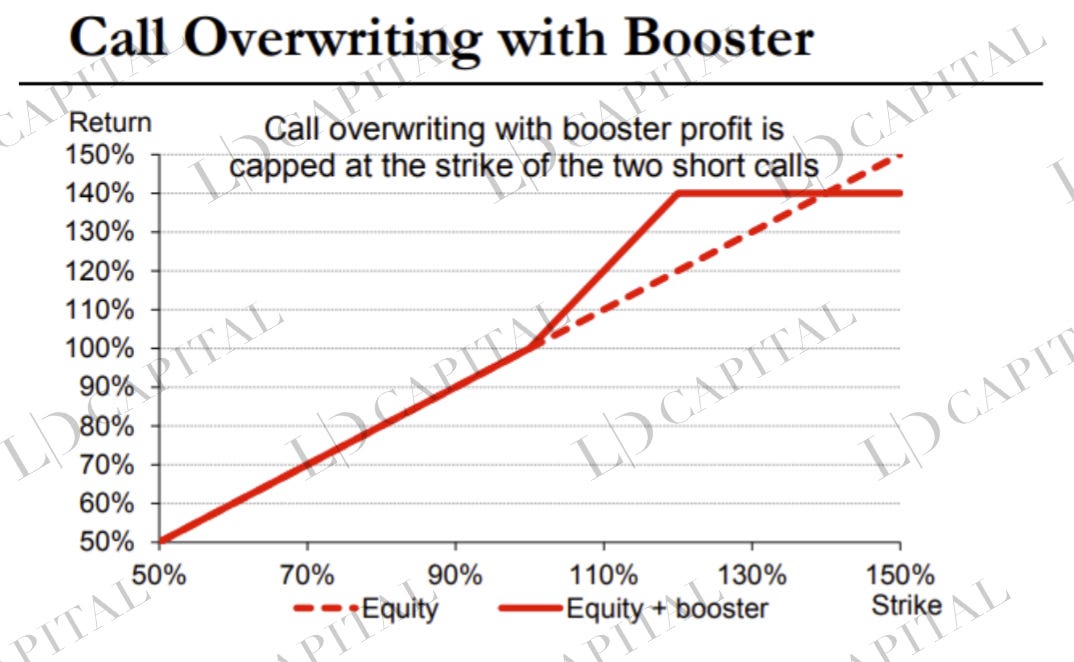
Options enhancement primarily involves covered call writing against owned stock/ETF positions—selling out-of-the-money calls in equal quantity to long holdings. This generates excess returns over spot during sideways or mildly rising markets.
Based on macro, technical, and fundamental assessments, the strategy can be adjusted—e.g., using ratio call spreads or calendar spreads when term structure is favorable.
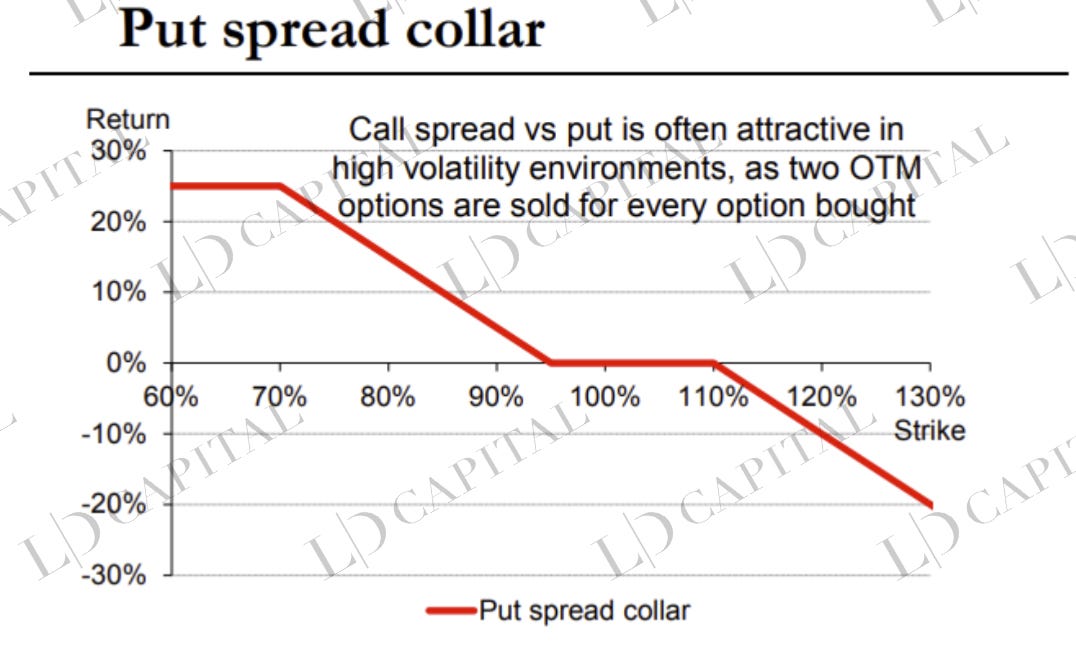
When portfolio protection is needed, option structures can be designed based on implied volatility levels. For instance, when IV is high and wings are steep relative to ATM, a put spread collar may be appropriate.
Example of Options Enhancement Strategy
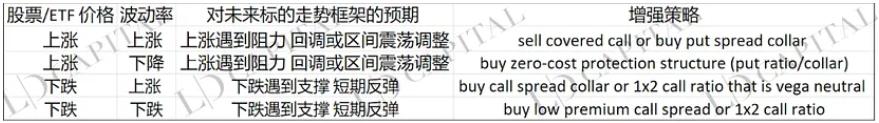
It’s important to note that nuances in volatility—such as skew and term structure—can impact optimal option structuring. These metrics require systematic real-time monitoring. Below are illustrative diagrams of various option structures:
Discretionary Timing
Partial tactical adjustments based on macro, technical, and sector fundamentals can contribute to excess returns. However, as an ETHE enhancement strategy, position timing should play a secondary role.
Specifically:
- Macro timing: Analyze macroeconomic, policy, and business cycle factors to assess the overall direction of the digital asset market.
- Sector timing: Conduct company/project research, event-driven analysis, and multi-factor stock selection.
- Technical timing: Use chart analysis to assess trend persistence and make tactical rebalancing decisions around key support/resistance levels.
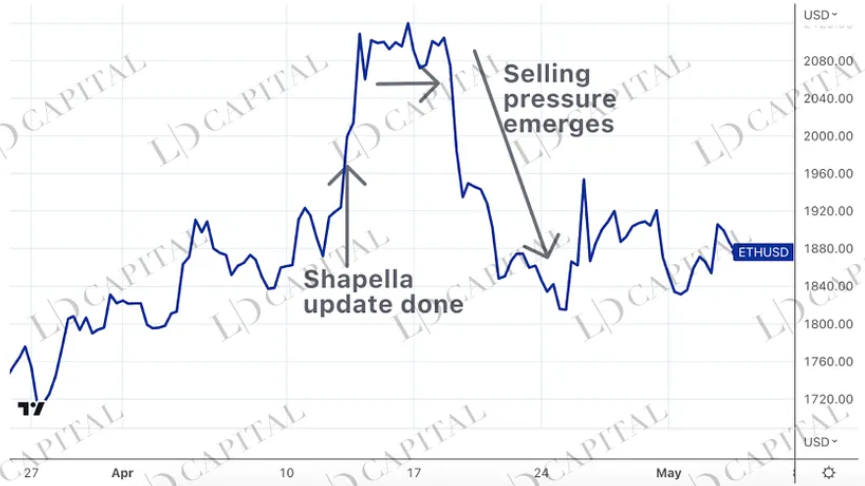
Among these, unquantifiable elements like macro judgment and event-driven insights are where manager skill differentiates performance. For example, Ethereum 2.0's Shapella upgrade concluded on April 13, 2023. Yet, a critical point often overlooked is that large-scale ETH withdrawals wouldn’t appear immediately—settlement could take five or more days. Thus, in the days following the upgrade, if prices rose, it might warrant partial profit-taking or selling upside calls to harvest volatility premium. The chart below shows ETH spot price spiking before April 13, consolidating for five days, then sharply declining.
The objectives of these strategies are:
- Long-term ownership of core crypto assets — ETH is foundational infrastructure for mainstream Web3 applications. Beyond serving as a conduit for fiat liquidity overflow and portfolio diversification like BTC, it offers additional alpha from Web3 ecosystem growth;
- Tactical flexibility without compromising core exposure — timing maneuvers should not reduce ETHE allocation significantly, avoiding missed tail-end rallies;
- Focus on equity alpha — carefully selecting superior companies can yield long-term excess returns above market averages;
- Harvest volatility premium — convert black swan risks and market volatility into long-term "alpha" for a net-long index strategy via options.
Empirical Study
Next, we conduct an empirical analysis of the proposed ETHE-based index enhancement strategy using historical data to evaluate its effectiveness and feasibility.
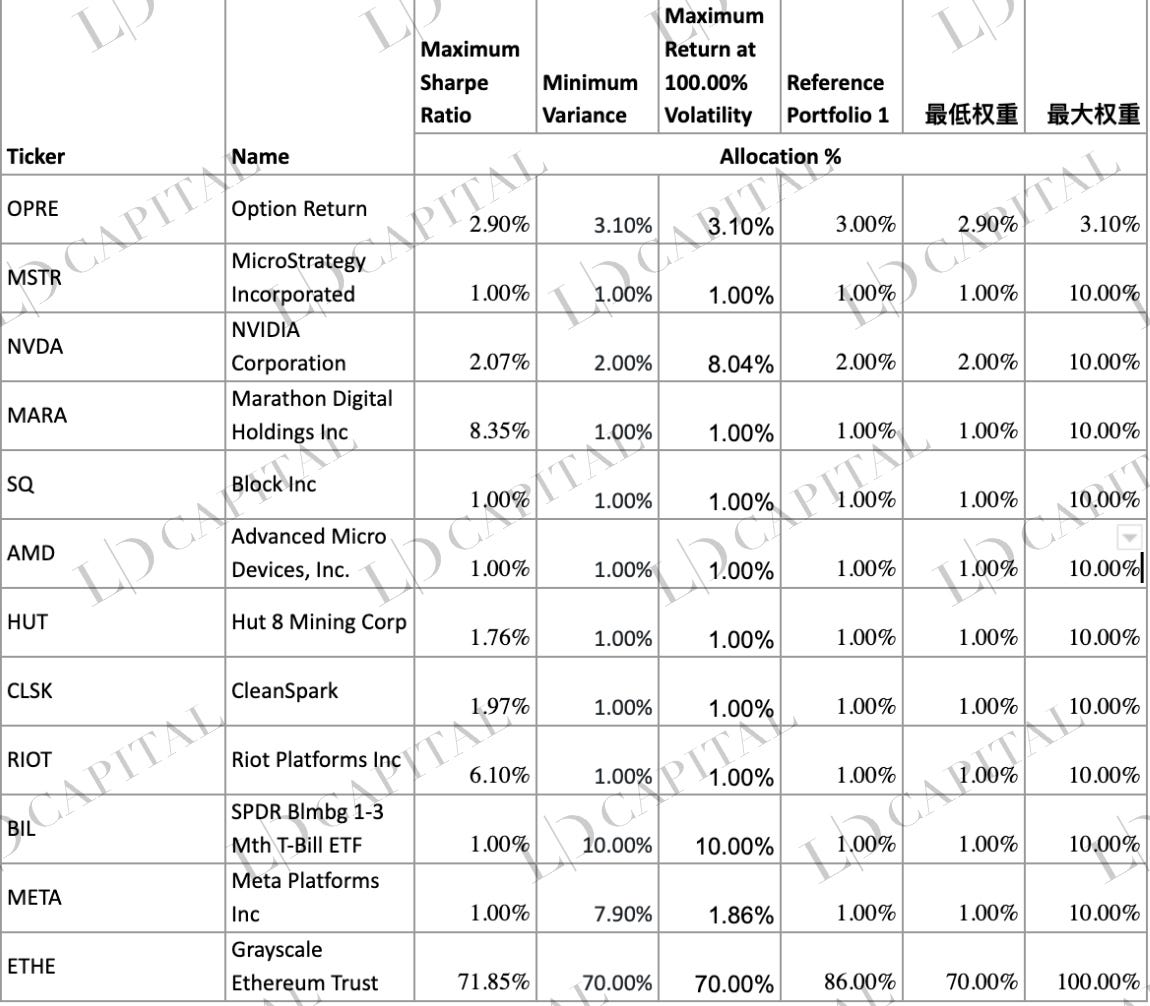
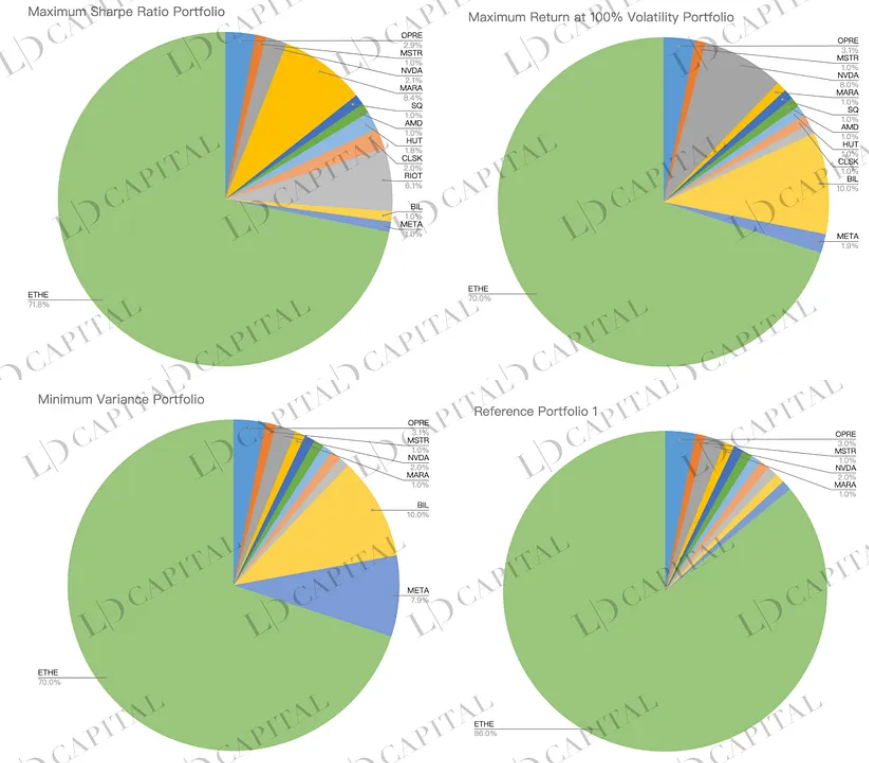
Using historical price data from January 2020 to April 2023 and a set of candidate assets (with OPRE used to simulate options returns), we calculate monthly returns. Subject to constraints on minimum and maximum allocation per asset, three optimization methods are applied to derive optimal portfolio weights:
-
Maximum Sharpe Ratio Optimization — identifies the portfolio on the efficient frontier with the highest risk-adjusted return based on mean-variance analysis;
-
Minimum Variance — finds the portfolio with the lowest possible risk (measured by variance or standard deviation);
-
Maximize Return at 100% Annual Volatility Target — seeks the highest expected return at a given risk level.
The performance of each optimized portfolio is shown below, with the black line (ETHE) and blue line (Reference Portfolio 1, unoptimized) serving as benchmarks:
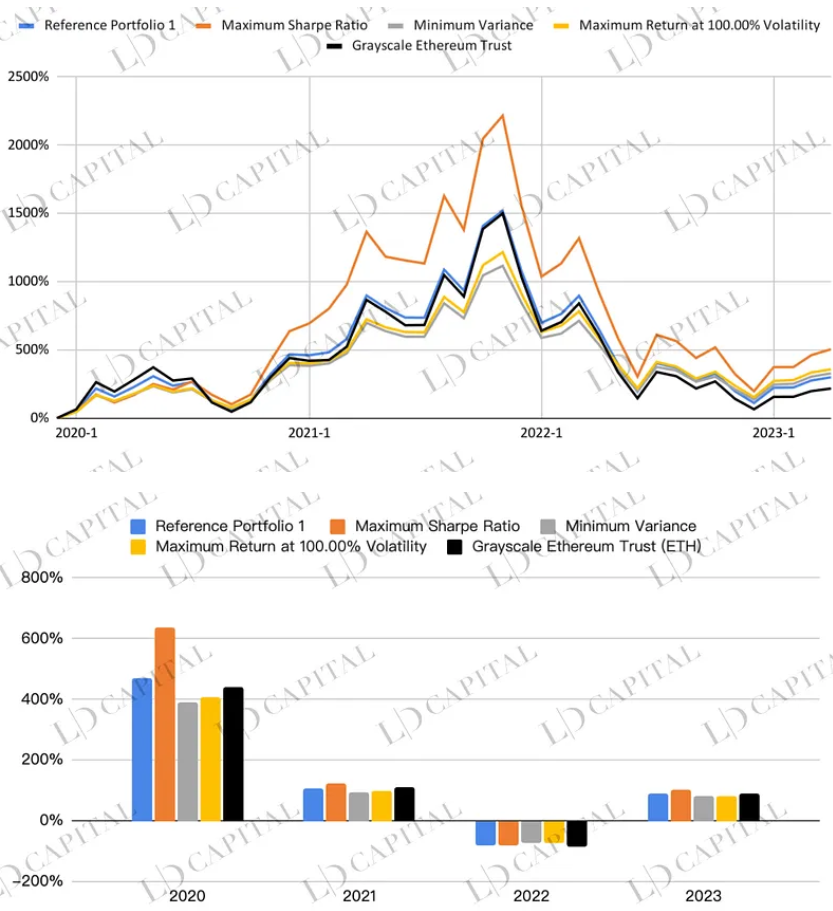
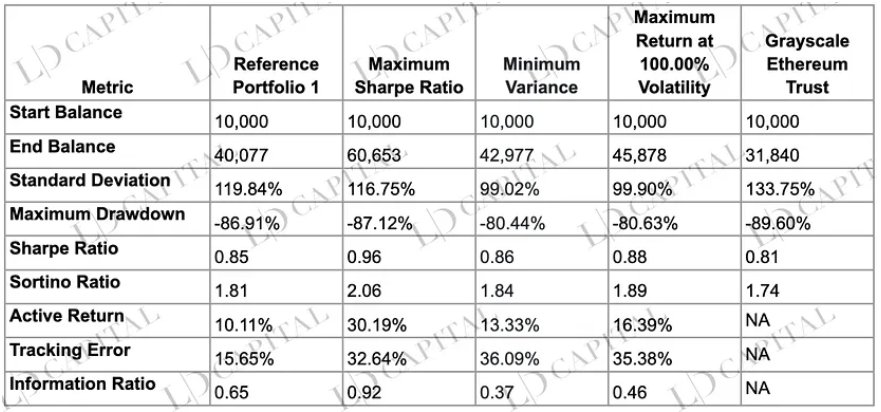
The table below compares the performance of four optimized portfolios—maximum Sharpe ratio, minimum variance, maximum return at 100% volatility—against the single-asset Grayscale Ethereum Trust (baseline). All optimized portfolios outperform holding ETHE alone across nearly all risk-return metrics. Notably, the maximum Sharpe ratio portfolio excels in returns, risk control, and risk-adjusted performance:
Key observations from the data:
-
Returns: Over the period, the maximum Sharpe ratio portfolio achieved a final value of 60,653—the best performer, clearly outpacing others and the baseline. Minimum variance and max-return-at-100%-volatility portfolios ended at 42,977 and 45,878, both exceeding the baseline’s 31,840. This confirms that optimized portfolios deliver superior returns.
-
Risk: Standard deviation is lowest for the minimum variance portfolio (99.02%), while highest for the baseline (133.75%). Maximum drawdowns were -80.44% and -80.63% for the two low-risk portfolios, versus -89.60% for the baseline. Optimized portfolios thus demonstrate better risk control.
-
Risk-Adjusted Returns: Sharpe and Sortino ratios measure return per unit of total and downside risk. The maximum Sharpe ratio portfolio leads with 0.96 and 2.06, respectively—indicating superior performance on a risk-adjusted basis.
-
Relative Performance Metrics: Active return, tracking error, and information ratio measure excess return, risk, and risk-adjusted excess return relative to the benchmark. The maximum Sharpe ratio portfolio again performs best: 30.19% active return, 0.92 information ratio. This shows it achieves meaningful alpha with controlled incremental risk.
Note: Optimization is based on monthly return statistics of selected assets within the specified time window. Results do not guarantee future outperformance. Actual performance of portfolios constructed using optimized weights may differ from targeted outcomes.
Conclusion
In summary, ETHE’s inherently weak risk-return profile can be improved through strategic portfolio enhancements. Simulated portfolios consistently outperform the ETHE benchmark in terms of returns, risk control, and risk-adjusted performance. Investors can select approaches aligned with their risk tolerance and objectives, enhancing holding experience and achieving a better balance between maximizing returns and minimizing risk.
Join TechFlow official community to stay tuned
Telegram:https://t.me/TechFlowDaily
X (Twitter):https://x.com/TechFlowPost
X (Twitter) EN:https://x.com/BlockFlow_News


