
NFT Secondary Market Insights: A Guide to Optimal Strategies for Presales, Public Sales, and Trading Before and After Minting
TechFlow Selected TechFlow Selected
NFT Secondary Market Insights: A Guide to Optimal Strategies for Presales, Public Sales, and Trading Before and After Minting
Wishing everyone great success in the NFT market!
 Navigating Web3 tides with focused insights
Author: leansmith, Founder of NFT Pioneer Team
After a year and a half in the NFT market and hands-on experience with hundreds of projects, I’m sharing my most important insights on NFT secondary market trading—completely transparently.
There are several scenarios when trading on the secondary market:
1. Minting via whitelist and then finding good exit points on the secondary market;
2. Identifying promising projects and looking for ideal entry points;
3. Short-term flipping of trending projects;
4. Reveal farming ("rush-the-reveal");
5. Buying floor items after reveal.
The highest trading volume and best liquidity occur during three key moments: pre-sale, public sale, and reveal. Try to complete your buying and selling around these time windows.
Pre-Sale
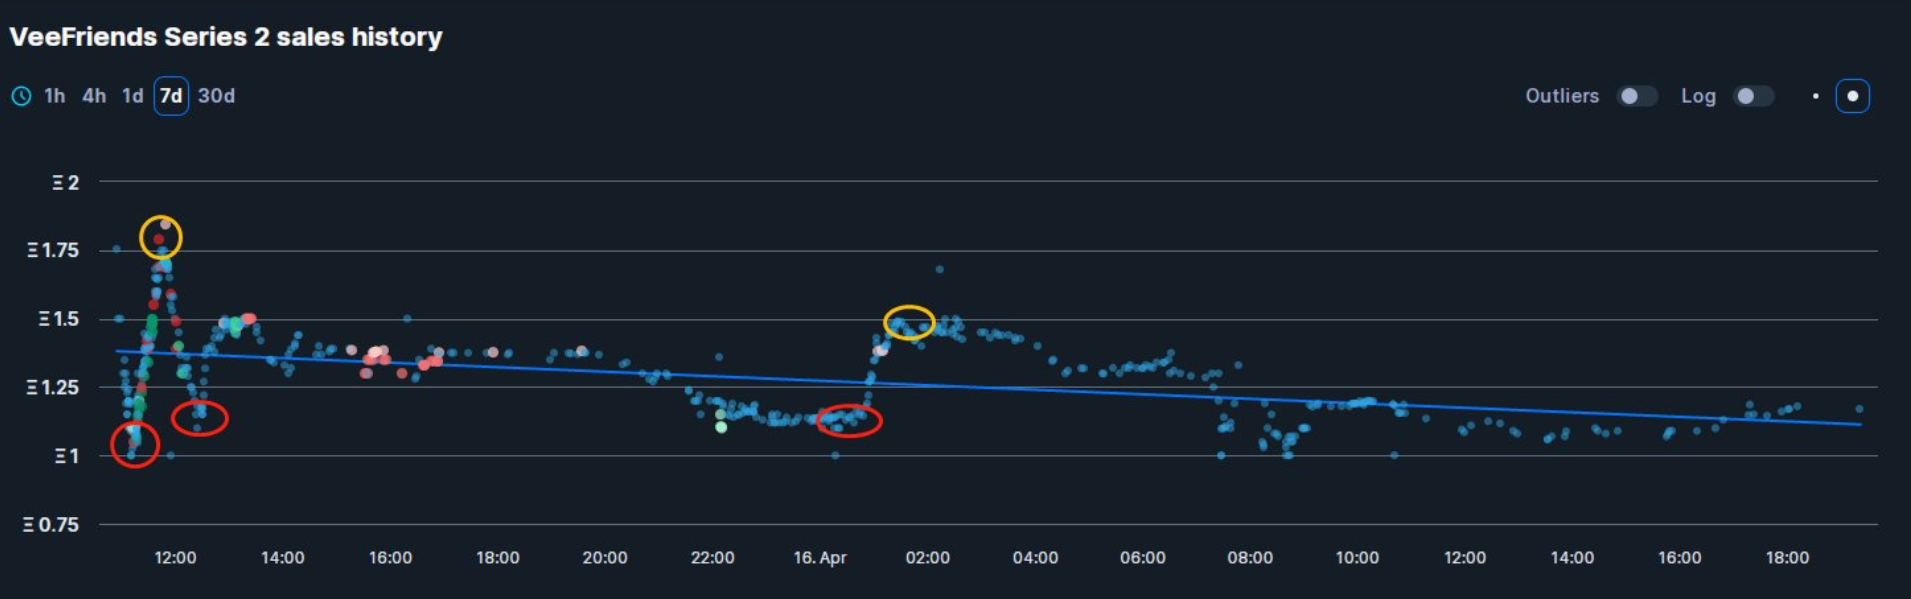
At the beginning of the pre-sale phase, there are usually some exploratory listings and immature bids, but price trends quickly emerge.
Generally, as long as there's profit, studios will be the first to sell off their holdings. Therefore, pre-sale prices typically open high and then decline. Once the curve drops to a certain level (optimal buy point—the first red circle), heavy buying emerges, pushing the price back up toward a peak (ideal early exit point for whitelist mints—the first yellow circle).
Public Sale
During public sale, if remaining supply is limited and demand is high, FOMO (fear of missing out) can easily take over.
Prices often surge rapidly right after public sale ends, reaching a short-term peak—this is usually the best selling opportunity (second yellow circle). After this point, many holders reach their target prices and begin selling, sharply increasing sell-side pressure and causing the price curve to drop quickly.
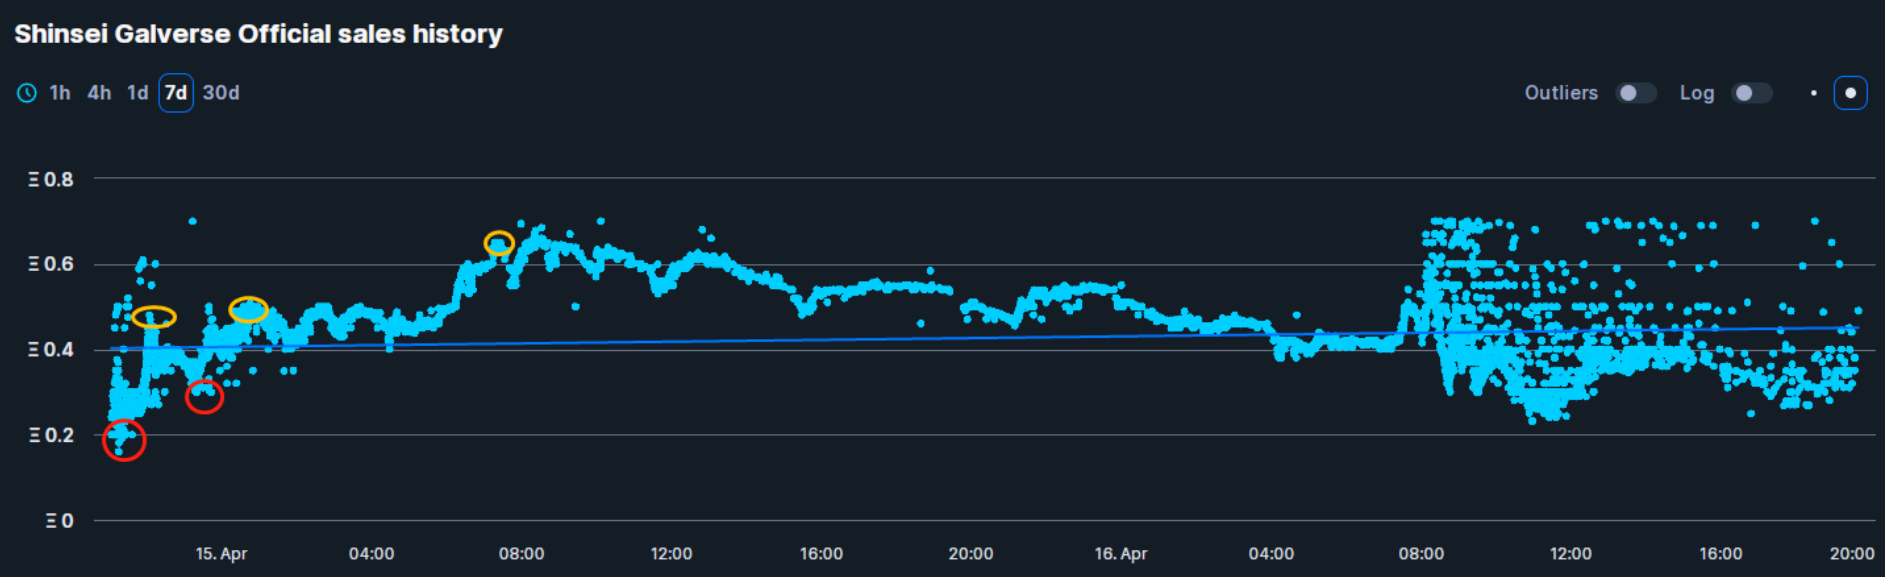
At this stage, everyone tries to list slightly below floor price to sell faster, which continuously drives the floor lower. Eventually, the curve bottoms out—this low point can be an excellent entry for long-term holders. The price may fluctuate mildly afterward, usually with smaller volatility than before, gradually stabilizing. Unless new positive or negative news emerges, the trend tends to drift slightly downward until the reveal.
Reveal
After reveal, blind box NFTs tend to polarize in value—like water spraying from a nozzle.
If prices spray upward, it indicates strong community approval of the project’s design.
If prices spray downward, it suggests poor reception—holders are eager to dump their assets.
If you believe in the project and plan to hold long-term, you can sell at the peak during the blind box phase and rebuy at floor after reveal—this lowers your average cost basis.
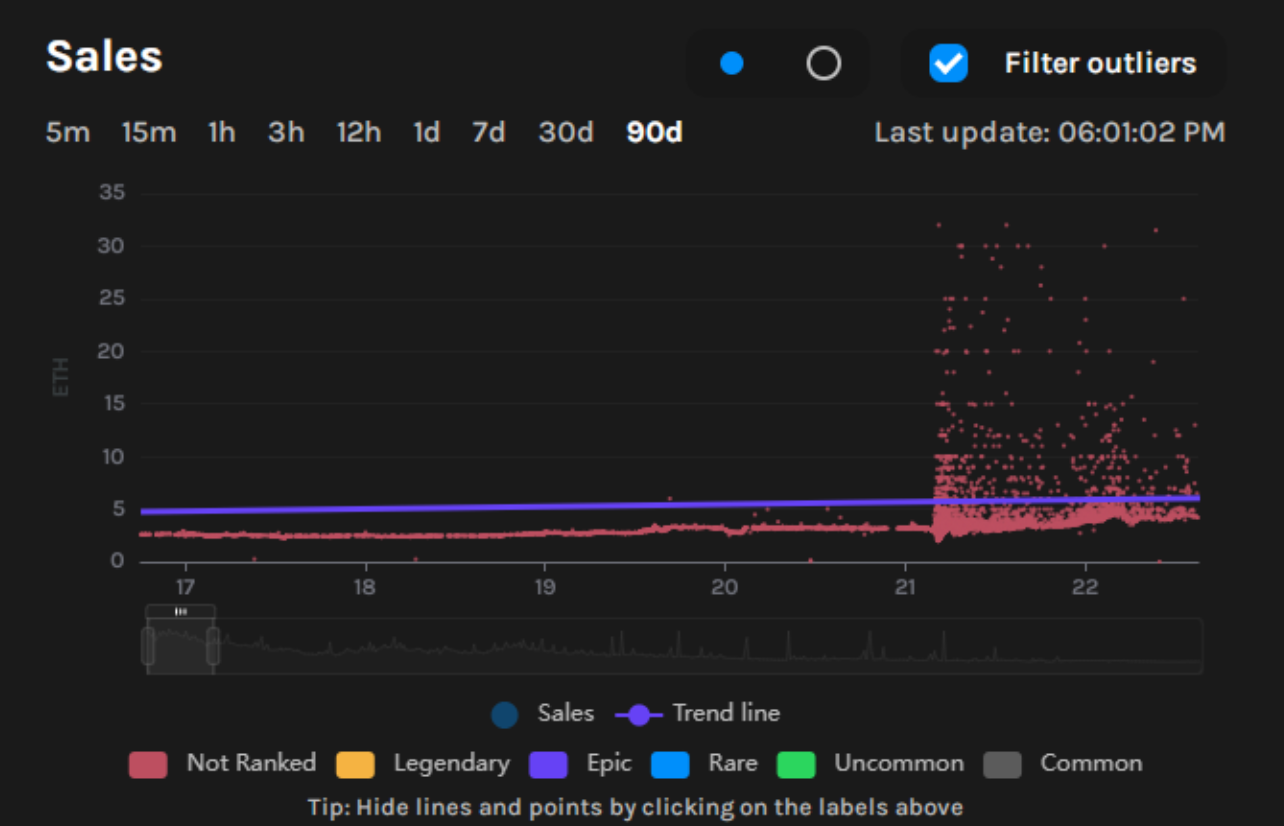
Typically, post-reveal floor prices settle between 40% and 70% of blind box prices. Without strong new catalysts, the floor may continue to decline. Even if you mint a rare trait, it’s advisable to sell immediately—only the top 20% rarest items have real premium potential, and only during periods of high liquidity do they command significant premiums. In fact, for most ordinary projects, opening blind boxes carries a negative mathematical expectation. Do you see why?
Understanding Buy and Sell Pressure
Sell Pressure
Sell pressure refers to the number of listed items for sale. However, listing volume is relative, so we use a metric called “listing rate”: simply, listings / total NFT supply. For example, if 1,000 NFTs were minted and 200 are listed, the listing rate is 20%. This figure changes dynamically and generally reflects the strength of selling pressure—higher sell pressure makes upward momentum harder to sustain.
A listing rate below 5% indicates many diamond-handed holders. Rates between 5%–10% are ideal; 10%–20% are average; above 20% means a large portion of holders are eager to exit.
Buy Pressure
This measures the intensity of buying interest. It’s usually gauged by the number of purchases within one minute:
-
Less than 1: extremely weak buy pressure;
-
Under 5: moderate buy pressure;
-
5–20: solid buy pressure;
-
20–40: strong buy pressure;
-
Over 40: frenzied buy pressure.
Note: This benchmark applies best to collections with ~3,000+ total supply. Adjust proportionally for smaller ones.
When buy pressure weakens—e.g., dropping from 20 to 10, then to 5 or lower—it’s a warning sign that the market may enter consolidation.
Consolidation is a critical moment: it signals strong resistance. If the price fails to break through, it often reverses sharply.
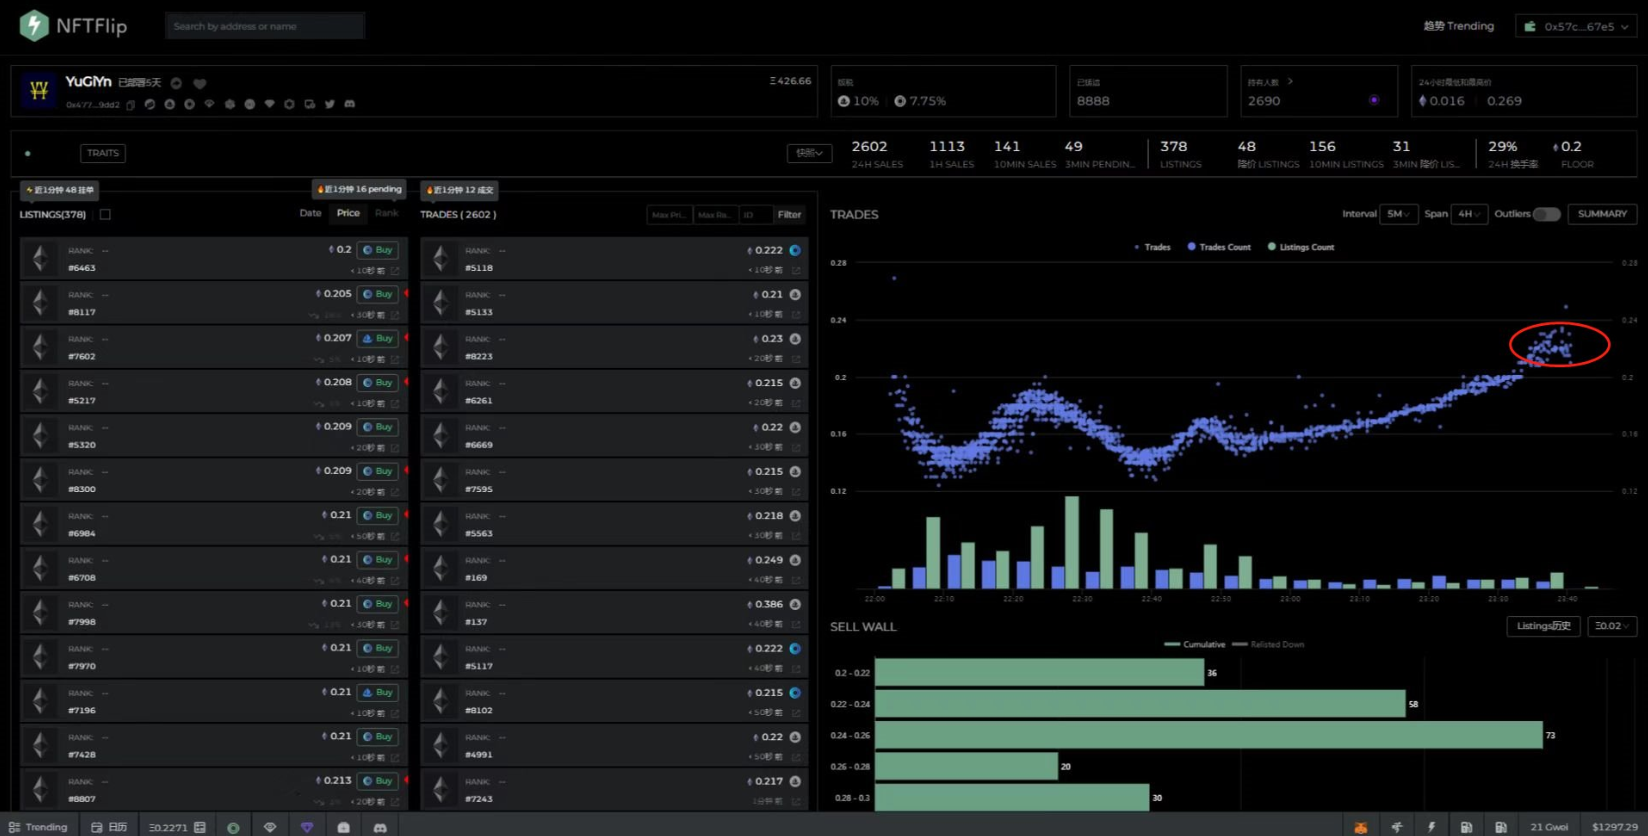
Typically, consolidation lasts about five minutes. If you’re trying to sell fast, don’t just undercut the floor by 0.001—you’re not alone in sensing the stagnation. Everyone dumps at once, driving the floor down rapidly.
So you must undercut more aggressively—by 5% to 10%. For instance, if the floor is 0.38, list at 0.35 to stay ahead of the falling tide.
How to Identify Resistance Levels?
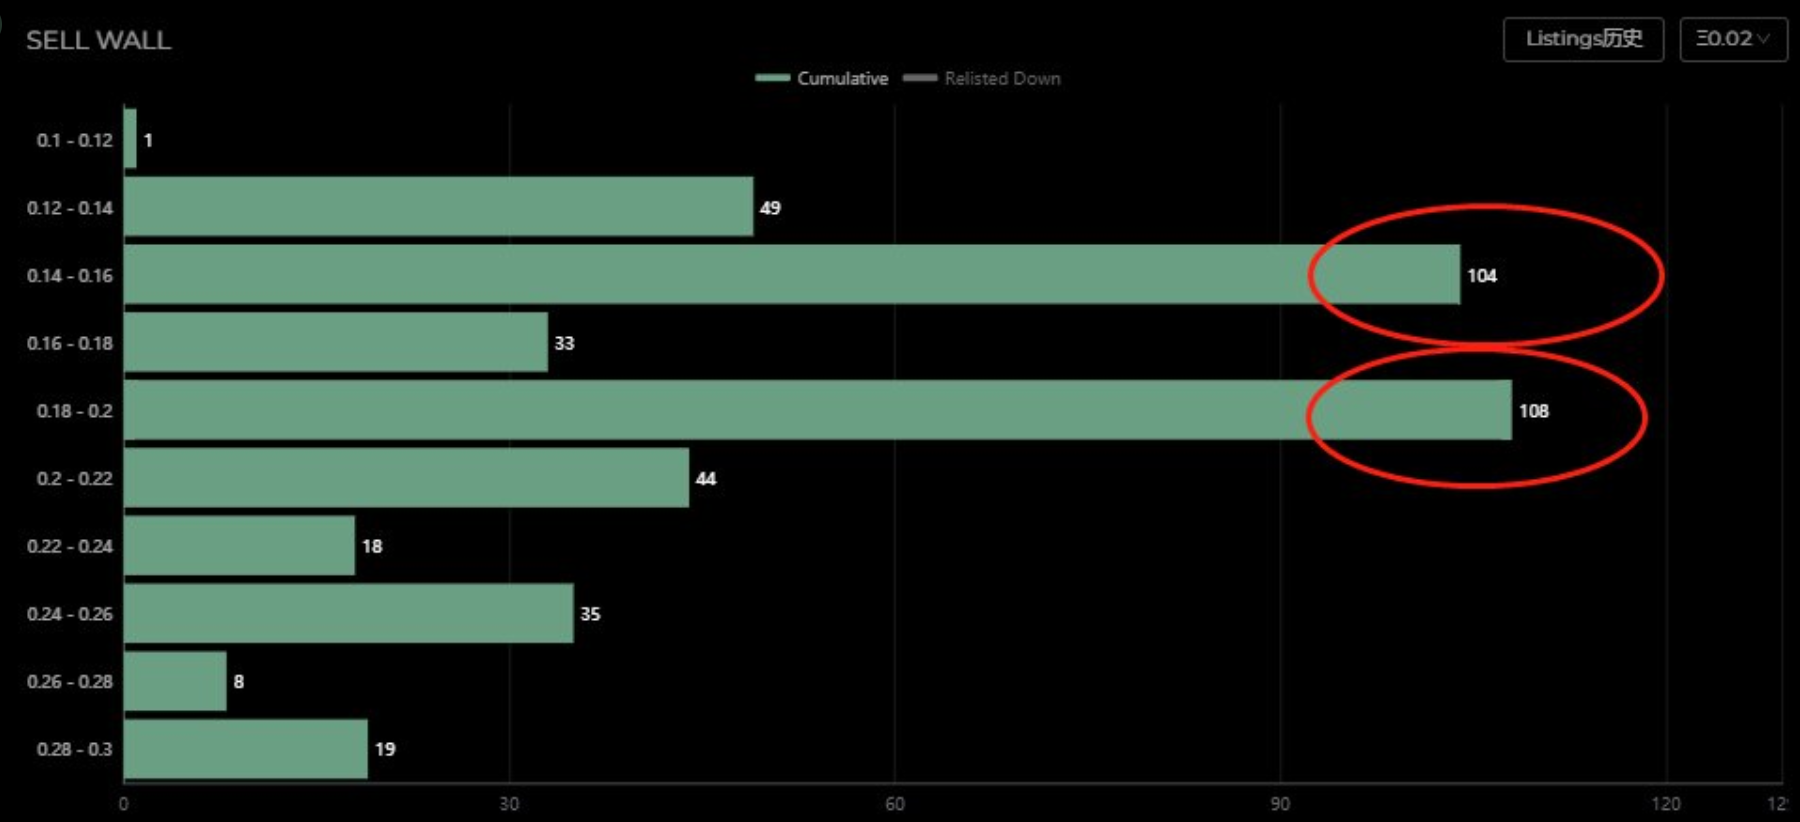
As shown in the chart, unusually long bars (highlighted by red circles) indicate resistance levels. Breaking the first resistance leads to the next.
Of course, if buy pressure is too weak, the price may reverse before reaching any resistance—a worse scenario. Understanding resistance helps you identify short-term peaks for timely exits.
Holder Concentration Rate
Number of unique holders / total NFT supply. For example, 3,000 holders across 10,000 NFTs gives a holder rate of 30%. Higher is generally better—it implies more distributed ownership and less risk of coordinated dumping.
A rate above 50% is considered healthy, though it also depends on project-specific distribution mechanics.
Profit Calculation
Include minting gas (~0.003 when gas is 15) and listing gas. Under normal conditions, combined they stay under 0.01.
Factor in platform and creator fees (OpenSea charges 2.5%, creators typically 5%–10%, so total 7.5%–12.5%; I usually estimate 10%).
I use a quick mental math: multiply expected sale price by 0.9, subtract ~0.01, and check if there's still profit before making a move.
Buying Tips
1. Avoid targeting the absolute lowest listed price. Most buyers watch the bottom price, but OpenSea has latency—someone else might already be purchasing it, or it could be gone by the time you click. Constantly chasing the cheapest listing wastes time.
2. When necessary, increase your gas fee slightly to speed up execution. Using tools makes this much easier.
Listing Tips
Start with a higher listing price—since lowering doesn’t cost gas (only cancellation does), this protects you if the floor rises quickly and you can’t cancel in time, avoiding missed profits.
During peak liquidity, set time-limited sales (e.g., one hour). Listings expire automatically, and short durations signal urgency—during FOMO phases, this can trigger faster buys.
Offer Strategies
Use offers strategically to acquire desired NFTs at lower prices. You can send multiple offers simultaneously as long as you have sufficient funds.
Target sellers listing at or near floor price—they’re often anxious to sell. As long as they make a small profit, they might accept an offer 15%–20% below market value. This gives you room for profit later.
Tools
-
NFTNerds, the leading secondary market tool. Premium pricing: 0.09 ETH/month or 0.45 ETH/half-year.
-
NFTFlip, a high-quality alternative to NFTNerds with better value: 0.05 ETH/month or 0.2 ETH/half-year.
-
OpenSea, built-in tools. Suitable for low-precision needs. Many other tools exist but aren't listed here due to market saturation.
Thanks for reading. Wishing everyone great success in the NFT market!
Join TechFlow official community to stay tuned
Telegram:https://t.me/TechFlowDaily
X (Twitter):https://x.com/TechFlowPost
X (Twitter) EN:https://x.com/BlockFlow_News