Bitget UEX Daily | US-Iran Temporary Ceasefire Expires, Oil Prices Surge; 30-Year US Treasury Yield Hits New High Since 2007; Microsoft & Meta Plunge Drags Down Tech
I. Hot News
Fed Dynamics
Long-end US Treasury Sell-off Intensifies, 30-Year Yield Hits New High Since 2007
- US 30-year Treasury yield rose nearly 6 basis points to 5.31% on Monday, hitting a new high since 2007; 10-year yield approximately 4.72%.
- Last week's 30-year new bond auction winning interest rate rose to 5.216%, the highest since 2001.
- Market worries about nearly $2 trillion annual fiscal deficit continuing to push up supply, coupled with inflation long-term above target, AI infrastructure driving increased corporate bond issuance.
Market Impact: Rapid rise in long-end yields pushes up financing costs, pressuring high-valuation growth stocks, while reinforcing cautious pricing of Fed policy path by the market.
International Commodities
US-Iran Temporary Ceasefire Agreement Expires, Hormuz Risk Heats Up Again
- US-Iran temporary ceasefire agreement signed in June expired on Monday, Trump stated it will not be extended.
- Iranian senior officials stated that if diplomatic efforts fail to reach a permanent arrangement, will shift to "full offensive" military posture, and prepare to take action on US naval blockade.
- Main differences between both sides focus on Strait of Hormuz control rights; Brent Crude closed up over $2 on Monday to $90.87/barrel, US average gasoline price rose to over $4 per gallon.
Market Impact: Geopolitical risk premium rebounds quickly, oil prices rise significantly, reigniting inflation concerns, short-term energy market volatility intensifies.
Macroeconomic Policy
Overseas US Treasury Holdings Decline; US Plans to Require Allies to "Choose Sides" Between US-China AI Frameworks
- In June, US Treasuries held by foreign investors decreased by $72.1 billion, Japan and China holdings declined simultaneously.
- According to US State Department internal letter draft seen by Reuters, US prepares to require relevant countries to choose US or China led framework on AI cooperation, if simultaneously joining China initiative may be excluded from US "Pax Silica" alliance.
- Anthropic annualized revenue run rate breaks through $65 billion, commercialization accelerates.
Market Impact: US Treasury supply concerns intertwined with geopolitics and AI geopoliticization increase market uncertainty; AI commercialization progress gains attention, but policy divergence risk rises.
II. Market Review
Commodities & Forex Performance
- Spot Gold: Approximately $4,432/oz, +0.37%
- Spot Silver: Approximately $66.46/oz, +1.05%
- WTI Crude: Approximately $84/barrel, +0.35%
- Brent Crude: Approximately $87.12/barrel, +0.29%
- US Dollar Index (DXY): Approximately 99.54, -0.02%
Driver Analysis: US-Iran temporary ceasefire agreement expires with unresolved differences, Hormuz risk heats up again, driving significant crude oil rise. Gold and silver supported by geopolitical safe-haven and weak dollar background. Asset correlation logic clear: Geopolitical stalemate → Oil price up → Inflation expectations rise → Long-end US Treasuries under pressure, meanwhile risk assets face valuation pressure. Short-term commodity volatility will highly depend on subsequent US-Iran statements and actual strait navigation status.
Cryptocurrency Performance
- BTC: Approximately $664,357, 24h change approximately +2.2%
- ETH: Approximately $1,910, 24h change approximately +1.7%
- Total Cryptocurrency Market Cap: Approximately $2.28 trillion, +2.5%
- Market Liquidation Situation: 24h total liquidation approximately $220 million, short liquidation $180 million
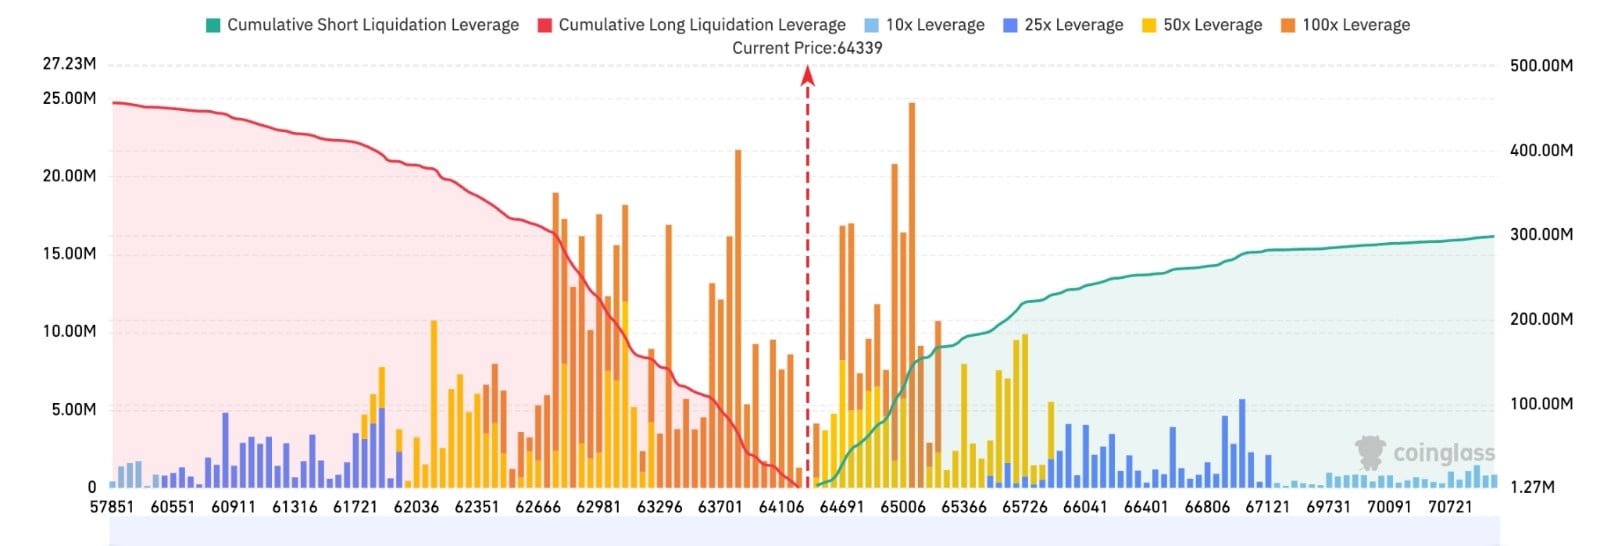
- Bitget BTC/USDT Liquidation Map: BTC current price approximately $64,339, below $63,700–$64,100 vicinity long liquidation relatively dense, if break below $63,700, may trigger long cascade liquidation. Above $64,700–$65,100 area short liquidation concentrated, if break through $64,700, may trigger short squeeze, short-term focus on $64,000–$65,000 range.
- Spot ETF Net Inflow/Outflow: BTC Spot ETF yesterday net inflow $137 million
Driver Analysis: Geopolitical risk heating up and oil price rise push up safe-haven sentiment, but crypto market overall follows risk preference with slight rebound. BTC reclaims above 63,000, ETH strengthens simultaneously. ETF fund flow turns to net outflow showing institutional short-term caution, leverage liquidation scale controllable. Macro level long bond yield rise and geopolitical stalemate form hedge, short-term crypto may maintain high-level oscillation, watch subsequent US-Iran progress and inflation data.
US Stock Index Performance

- Dow Jones: Close 53,459.78 points (-0.51%), slight close down
- S&P 500: Close 7,745.06 points (-0.52%), retreat from high
- Nasdaq: Close 26,644.91 points (-0.32%), tech under pressure
Tech Giant Dynamics
- NVDA: $225.01 (-0.07%)
- AAPL: $305.59 (-0.11%)
- MSFT: $480.35 (-3.04%)
- GOOGL: $344.00 (-0.55%)
- AMZN: $261.31 (-0.51%)
- META: $568.97 (-3.54%)
- TSLA: $339.30 (-0.87%)
Performance Summary & Driver Analysis: Monday US stock three major indices all closed down, Microsoft and Meta fell over 3% becoming main drag. Long-end US Treasury yield rapid rise pushes up valuation pressure, software and some large tech stocks under pressure. Meanwhile, storage and optical communication sectors counter-trend strengthen, showing AI infrastructure chain internal funds continue to rotate. Market weighs between geopolitical risk, long bond sell-off and AI performance realization, overall risk preference somewhat converges.
Sector Movement Observation
Optical Communication
- Representative Stocks: Credo (+8.82%), Coherent (+7.79%), Marvell (+5.54%), Lumentum (+4.62%)
- Drivers: Nvidia announced Spectrum-X Ethernet silicon optical switch enters full mass production, data center high-speed interconnect demand 获 funds confirmation.
Storage Concept
- Representative Stocks: SanDisk (+8.88%), Micron (+4.13%)
- Drivers: AI data center high bandwidth storage demand continues, funds continue to flow into performance realization chain.
Software/Large Tech
- Representative Stocks: Microsoft (-3.04%), Meta (-3.54%)
- Drivers: Long-end yield rapid rise pushes up discount rate, high-valuation software stocks under pressure.
III. US Stock Individual Stock Deep Interpretation
1. Microsoft (MSFT) - Fell Over 3%, Under Pressure from Long Bond
Event Overview: Microsoft stock price fell approximately 3.04%, becoming one of the largest decliners among large tech stocks. Long-end US Treasury yield rapid rise to multi-year highs, pushes up growth stock valuation pressure. Market Interpretation: Market worries about AI capital expenditure return cycle under high interest rate environment heats up again. Microsoft although possesses cloud business realization advantage, but in long bond sell-off dominated trading, high-valuation targets generally under pressure. Investment Implication: Watch subsequent cloud business growth rate and capital expenditure match degree, and whether long-end yield can stabilize.
2. Meta (META) - Fell Over 3.5%, Leading Software Sector Decline
Event Overview: Meta stock price fell approximately 3.54%, performance weaker than most tech giants. Market Interpretation: Long-end yield rise impact on high-valuation software stocks relying on future cash flow more obvious. Early stage capital expenditure scale worries and macro interest rate environment superimposed, funds choose to reduce exposure. Investment Implication: Need to continuously track advertising business resilience and AI monetization progress, short-term volatility may increase.
3. SanDisk (SNDK) - Rose Nearly 9%, Storage Continues to Lead
Event Overview: SanDisk stock price rose approximately 8.88%, storage sector overall strengthens. Market Interpretation: AI data center high bandwidth storage demand continues realization, funds within tech rotate from software to hardware infrastructure chain. Early stage larger gain targets still pursued. Investment Implication: AI storage medium-long term logic still exists, but need to guard against profit taking after high gains and supply-demand data verification.
4. Optical Communication Sector - Collective Surge
Event Overview: Credo rose 8.82%, Coherent rose 7.79%, Lumentum rose 4.62% etc optical communication targets collectively strengthen. Nvidia announced Spectrum-X Ethernet silicon optical switch has entered full mass production. Market Interpretation: Data center high-speed optical interconnect demand gets direct catalyst, funds confirm AI infrastructure from compute to network layer extension logic. Investment Implication: Optical communication as AI infrastructure key link, short-term elasticity outstanding, need to watch subsequent order visibility.
5. SpaceX (SPCX) - Rose Over 4%, Relatively Independent
Event Overview: SpaceX stock price rose approximately 4.45%, performance significantly stronger than most tech stocks. Market Interpretation: In overall risk preference converging environment, SpaceX凭借 itself business progress and analyst positive evaluation, shows relative independence. Investment Implication: Watch Starlink and AI related business progress, and liquidity impact after lock-up expiration.
IV. Market & Project Dynamics
- Cathie Wood owned Ark Invest on Monday bought value $15.4 million of Block Inc. stock, $1 million of Securitize stock, and $22.8 million of Nvidia stock.
- Bitcoin mining enterprise transforming to AI infrastructure IREN has delivered to Microsoft a five-year, total value $9.7 billion cloud service contract down four "Horizon" AI deployments first one. Horizon 1 is located in Texas Childress campus 50MW direct chip liquid cooling deployment, remaining three phases will be delivered sequentially this year, four phases total 200MW IT capacity and Nvidia GB300 GPU.
- Strategy Executive Chairman Michael Saylor Monday stated, company currently prioritizes STRC preferred stock, cash reserves and credit business, rather than stock buyback. Affected by Bitcoin decline, MSTR this year has fallen approximately 38%. Saylor said if MSTR relative net asset value appears "very deep discount", may consider buyback, but currently temporarily not priority.
- Anthropic annualized revenue run rate breaks through $65 billion, commercialization progress accelerates, and has secretly submitted listing documents.
- Nvidia will with SB Energy cooperated Ohio AI data center credit guarantee cap down adjusted to $105 billion, and invest $1.5 billion to obtain equity.
- Quantitative trading giant Jane Street in SEC regulatory file disclosed its holds value approximately $990 million of Bitcoin spot ETF, at current price converted approximately 15,394 BTC, among which $828 million invested in BlackRock iShares Bitcoin Trust. This holding through ETF rather than directly holding digital asset way realized.
- The Kobeissi Letter on X platform posted analysis stating, 2026 US stock market shows unprecedented resilience, current may become at least 30 years first no appear New York Stock Exchange (NYSE) "80%+ decline volume day" complete year. So-called "80% decline volume day" (80%+ NYSE downside-volume days), refers to that day New York Stock Exchange at least 80% volume comes from declining stocks, usually viewed as market appears widespread sell-off pressure important signal. Data shows, 2008 Global Financial Crisis period, NYSE appeared 49 times such trading days; 2022 bear market period appeared 33 times; 2025 then appeared 9 times. Since 1997, this indicator average annually appears approximately 21 times, and previously never had any complete year below 5 times. Kobeissi Letter pointed out, up to now, 2026 market almost no appear widespread sell pressure, shows investor sell-off behavior relatively limited, market structure shows stronger support. The institution stated, current US stock market shows "unprecedented resilience", but this phenomenon also means market risk may more concentrate on future potential liquidity changes or sudden events.
V. Today's Market Calendar
Data Release Schedule
| This Week | US | Retail Sales etc Consumption Data and Corporate Earnings | ⭐⭐⭐⭐ |
| Focus | Global | US-Iran Ceasefire Follow-up and Hormuz Progress | ⭐⭐⭐⭐⭐ |
Important Event Preview
August 18 (Tuesday)
- US announces July Housing Starts and Building Permits, Import/Export Price Index, Industrial Production and Capacity Utilization, Pending Home Sales;
- ★★★★ Home Depot (HD) pre-market releases earnings, core verifies housing improvement demand, large item consumption resilience and real estate related expenditure under high interest rate environment; Baidu (BIDU) pre-market;
- Toll Brothers, Keysight Technologies (KEYS, Test & Measurement Equipment) etc after-market.
August 19 (Wednesday)
- ★★★★★ Fed announces July FOMC Minutes (UTC+8 timezone evening), taking over from last week CPI becomes this week most important macro event. Focus observe July meeting 3 votes oppose maintain interest rate hawkish divergence details, on inflation stickiness, labor market and September policy path discussion depth;
- Target (TGT), Lowe's (LOW), TJX, Analog Devices (ADI) pre-market release earnings, test retail consumption health and semiconductor/AI related demand (ADI focus industrial, data center power and communication end);
- EIA Crude Inventory Data.
August 20 (Thursday)
- US announces August Philly Fed Manufacturing Index, Weekly Initial Jobless Claims, July Leading Indicators;
- ★★★★ Walmart (WMT) pre-market releases earnings, core tests low-end consumption resilience, grocery and general merchandise demand; Alibaba (BABA), NetEase (NTES), Deere (DE) etc synchronize;
- Ross Stores etc after-market.
August 21 (Friday)
- ★★★★ US announces August S&P Global Manufacturing/Services PMI Preliminary, verifies economic expansion momentum and soft landing continuity;
- Other major events less.
*Last week CPI/PPI slowed after rate hike expectations already obviously cooled, if minutes show divergence limited and retail/housing data robust, soft landing trading and growth stocks hope to continue; conversely if minutes hawkish or consumption guidance weak, then may re-raise tightening pricing and test high-valuation sectors. Expected market volatility medium-high, focus watch minutes wording and retail earnings beat or miss pricing reaction.
Institutional Views:
Analysts generally believe, US-Iran temporary ceasefire agreement expires and differences unresolved, Hormuz risk heats up again, oil prices significant rise and re-pushes inflation worries. Meanwhile, 30-year US Treasury yield hits new high since 2007, long-end sell-off on high-valuation tech stocks constitutes direct pressure, Microsoft and Meta decline front. Storage and optical communication counter-trend strengthen, shows AI infrastructure chain internal funds still rotating. Overall consensus is geopolitics and long bond yield will become short-term dominant factors, market volatility may increase.
Disclaimer: The above content is organized by AI search, manual verification only for publication, not as any investment advice. Data in the text inevitably has deviations, please refer to market real-time data.