Weekly Data Review: S&P Pantera Index Launches, Robinhood Chain Trading Volume Breaks into Top Four
TechFlow Selected TechFlow Selected
Weekly Data Review: S&P Pantera Index Launches, Robinhood Chain Trading Volume Breaks into Top Four
Most of the funds on the Robinhood chain are not Robinhood's.
 Navigating Web3 tides with focused insights
Author: Artemis Analytics
Compiled by: TechFlow
TechFlow Editor's Note: S&P and Pantera launched the first crypto index screened based on protocol revenue, supported by data from Artemis. Although Robinhood Chain's DEX trading volume has ranked among the top four in the industry, the reality is: 70% of TVL on the chain comes from Morpho and Ethena, stock tokens account for only 4.2%, and the memecoin casino still contributes 75% of trading volume. This chain, which was supposed to handle RWA tokenization, is currently seeing third-party protocols make money, with Robinhood only collecting base fees.
Market Overview
Risk assets traded sideways, but internal structures adjusted violently. Bitcoin closed at $64,444, down 0.7%. Ethereum rose 0.6%.
ETF fund outflows lasting six weeks finally stopped:
- Spot Bitcoin ETF: Net inflow of $75.5 million from July 13–17, net inflow of $33.9 million from July 20–24
- Total Bitcoin ETF AUM: $78.9 billion
- Ethereum ETF: Net inflow of approximately $104 million per week in the last two weeks
The real repricing happened in the interest rate market. The probability of a Fed rate hike on July 28–29 surged from 10.7% on July 15 to nearly 35% on July 22, almost entirely due to the Iran conflict pushing Brent crude close to $100.
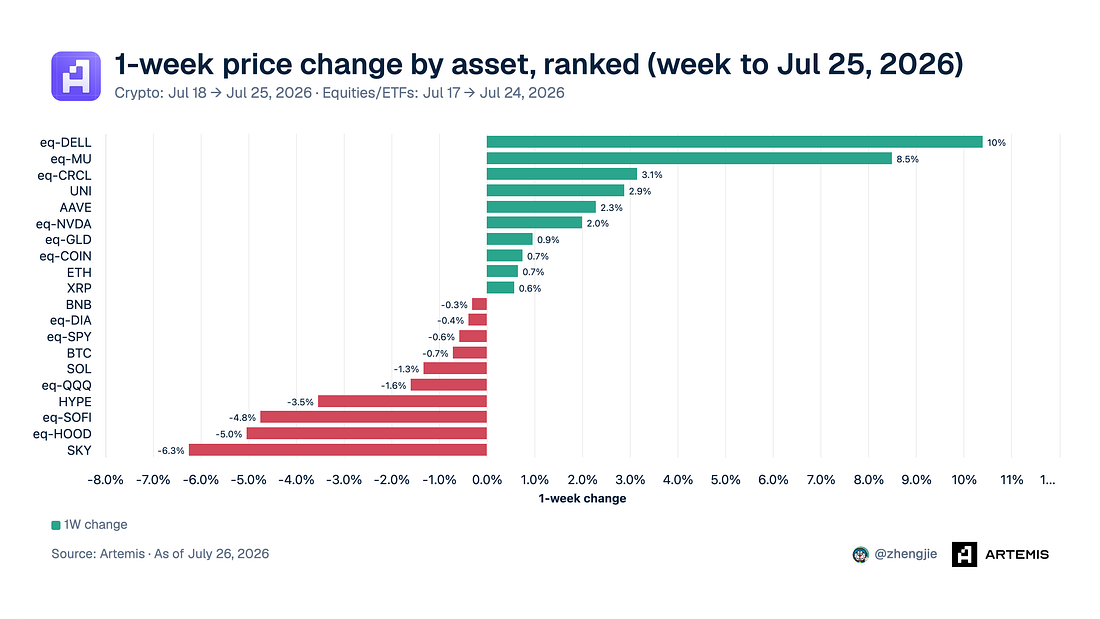
Chart: One-week asset price performance, crypto and stocks/ETFs mixed, eq-DELL led gains around 10%. Source: Artemis
Unlike last week, semiconductor stocks rebounded. Dell (+10.4%) and Micron (+8.5%) led gains, marking a sharp reversal for memory chips after Micron plummeted 28% from its June high. Nvidia (+2.0%) outperformed its anchor index Nasdaq 100 (-1.5%). DeFi continued its rise, with UNI (+2.9%) and AAVE (+2.3%).
Crypto stocks were mixed. Circle (+3.2%) was the only stock with substantial gains. Coinbase (+0.75%) completely gave back all gains from the 9.6% rise on July 21 due to the CLARITY Act.
The hardest hit were retail fintech stocks: SKY (-6.2%), HOOD (-5.0%), and SOFI (-4.8%), followed closely by HYPE (-3.5%). Bitcoin (-0.7%) and the broader market barely moved (SPY -0.5%, Dow Jones -0.3%).
A basket of stocks rose an average of 0.41%, median +0.18%.
S&P Pantera Digital Asset Index Launches, Data Provided by Artemis
S&P Dow Jones Indices and Pantera Capital launched the S&P Pantera Digital Asset Index (SPPDA) on July 20.
This is an 18-token benchmark index that screens projects with protocol revenue from the S&P Crypto Broad Digital Asset Index, then weights them by market cap.
Artemis provides revenue classification, circulating supply, and total supply data. Lukka provides pricing.
The top five component tokens by weight are ETH, BNB, SOL, TRX, and HYPE.
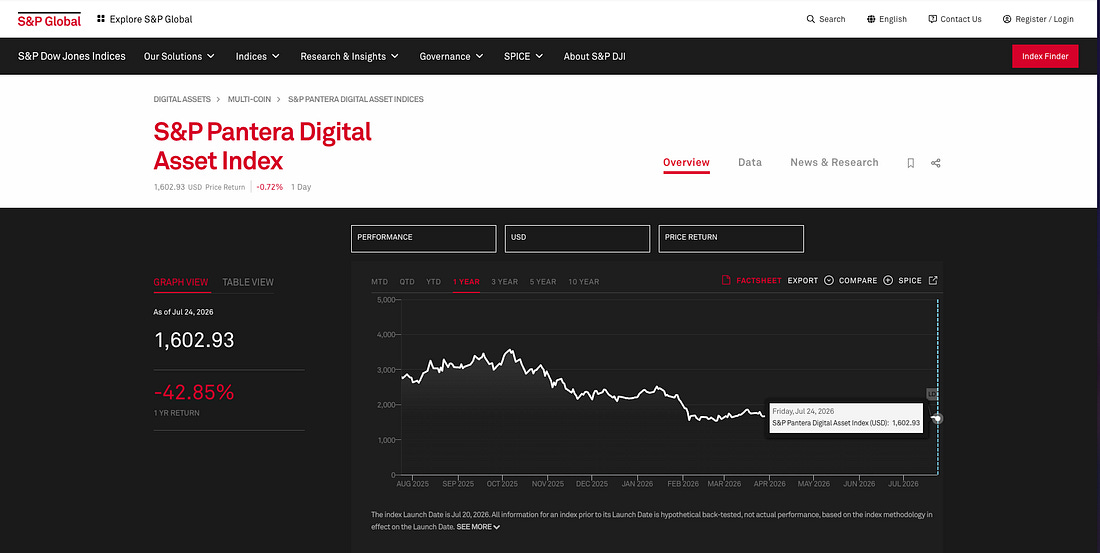
Chart: S&P Pantera Digital Asset Index (SPPDA), revenue data provided by Artemis, screened by protocol revenue, market cap weighted. Source: Artemis
Bitcoin and XRP both directly failed the revenue test. For scale: XRP's entire 14-year burn history totals approximately $16 million, while the 18 selected tokens generate over $3 billion in revenue annually.
S&P is cautious about the positioning of this index. The methodology refers to protocol revenue as an "objective, rules-based metric of economic activity" and explicitly states it does not imply investment return or cash flow.
Simply put, revenue determines which tokens are selected, and market cap determines how much you hold. So if you read the headline and thought this was a way to hold the biggest earners in crypto, you would be wrong.
Additionally, tokens need at least 30% of supply actually circulating to be selected, which quietly excludes projects whose valuations are built on tokens not yet unlocked.
This rule operates based on Artemis's circulating supply data, which no one has reported on yet. The first component adjustment will be decided on the third Friday of August and take effect on September 18.
Robinhood Chain: What Actually Happened
Let's clarify what Robinhood Chain is first, because most people skipped this part.
Robinhood Chain is an Arbitrum Orbit L2, meaning Robinhood rents Ethereum's security to run its own cheap, fast transaction layer on top. It launched on July 1.
The marketing pitch was tokenizing real-world assets: putting stocks, ETFs, and private equity on-chain. Robinhood's customers can trade them 24/7, including in places where US brokerage accounts cannot be opened. However, what actually launched was a memecoin casino, and what is happening now is that this casino is slowly becoming what it was supposed to be (RWA tokenization).
Just last week, we showed that Robinhood Chain became the leading chain in DEX trading volume on peak days. For the entire week of July 18–25, it ranked fourth with $4.7 billion, behind BSC, Ethereum, and Base, and ahead of Solana.
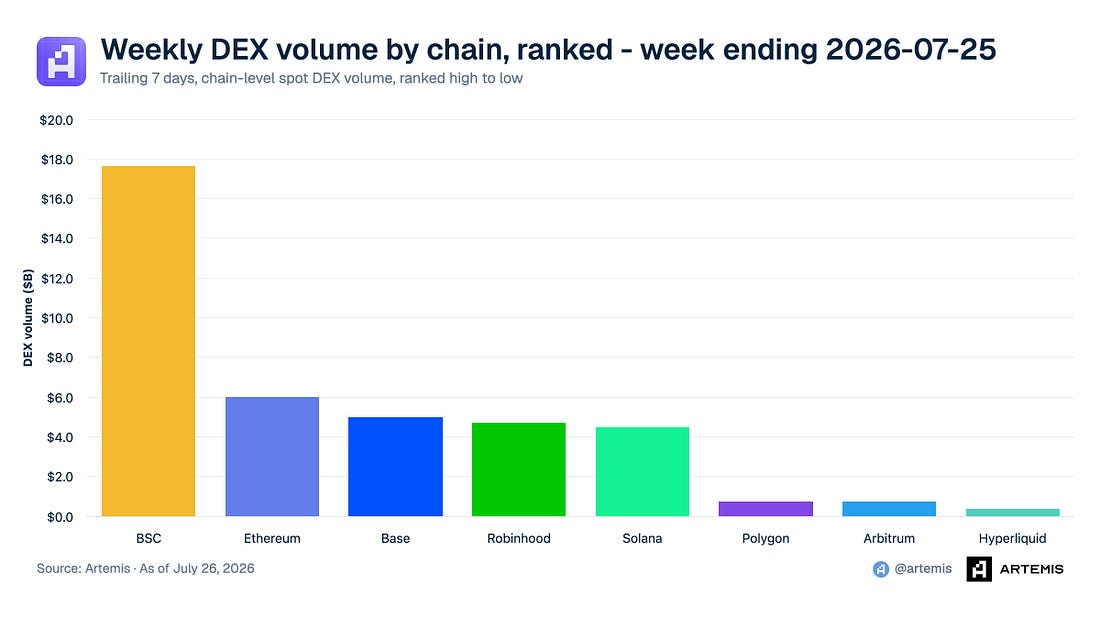
Chart: DEX volume ranking by chain from July 18–25, Robinhood Chain ranked fourth with $4.7 billion, behind BSC, Ethereum, Base. Source: Artemis
Activity on Robinhood Chain:
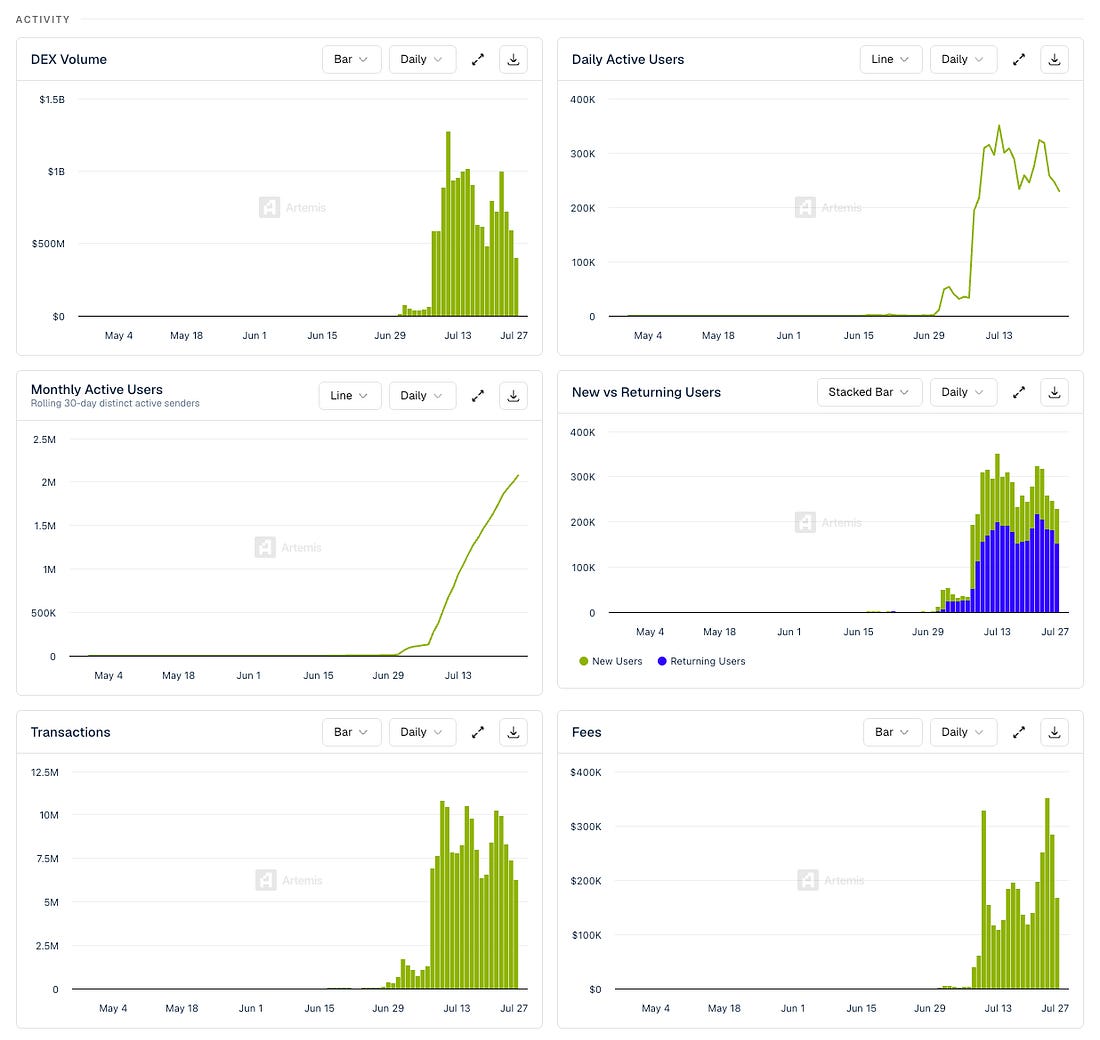
Chart: Robinhood Chain activity metrics—DEX daily average trading volume approx. $500 million, DAU approx. 250k, MAU 2.1 million. Source: Artemis
- DEX trading volume daily average approx. $500 million
- Daily active users daily average approx. 250k
- Monthly active users reached a record high of 2.1 million
- Approximately two-thirds of DAU are returning users
- Transaction count daily average approx. 6 million
- Fees daily average approx. $200,000
Most Funds on Robinhood Chain Are Not Robinhood's
As of July 25, TVL was $595.1 million, a significant increase from nearly zero in mid-June. The composition is key:
- Morpho: $236.2 million
- Ethena: $177 million
- Uniswap: $48.3 million
- Maple: $48.1 million
- Lighter: $25 million
- Robinhood Stock Tokens: $24.7 million
Morpho and Ethena combined account for 70% of funds on the chain. Robinhood stock tokens account for only 4.2%.
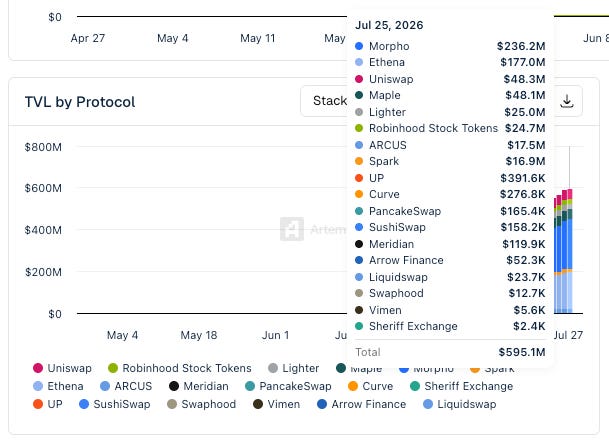
Chart: Robinhood Chain TVL composition as of July 25, Morpho + Ethena account for 70%, Robinhood stock tokens only 4.2%. Source: Artemis
Uniswap Completely Monopolizes the Trading Layer
Of the $397.4 million DEX trading volume on July 25:
- Uniswap V3: $251.9 million
- Uniswap V4: $80.1 million
- Uniswap V2: $58.4 million
- All other protocols combined: Less than $7 million
This is 98% Uniswap. Arcus, PancakeSwap, and all forks on the chain share the remaining share.
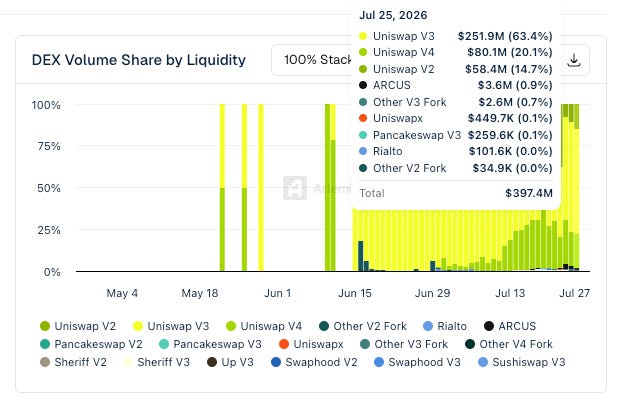
Chart: DEX volume by liquidity share on July 25, Uniswap V3 accounts for 63.4%, V4 accounts for 20.1%, total 98%. Source: Artemis
Memecoins still account for the majority of all DEX trading volume:
- Memecoin trading pairs: $297 million (74.7%)
- Ethereum: $64.2 million (16.1%)
- Robinhood stock token trading pairs: $36 million (9.1%)
- Protocol token trading pairs: $219,600 (0.1%)
One Launchpad Occupies Most Activity on the Chain
On July 25, pons.family accounted for:
- $99.7 million of $155.8 million launchpad trading volume (64%)
- 1.3 million of 1.6 million launchpad transactions (81%)
- 11,200 of 17,600 tokens deployed (64%)
The second largest platform Bankr accounted for $13.1 million.
In seven days, pons.family generated $7.86 million in total fees on $826 million trading volume. During the same period, gas fees for the entire chain were approximately $1.51 million.
Application layer revenue is approximately five times that of the L2.
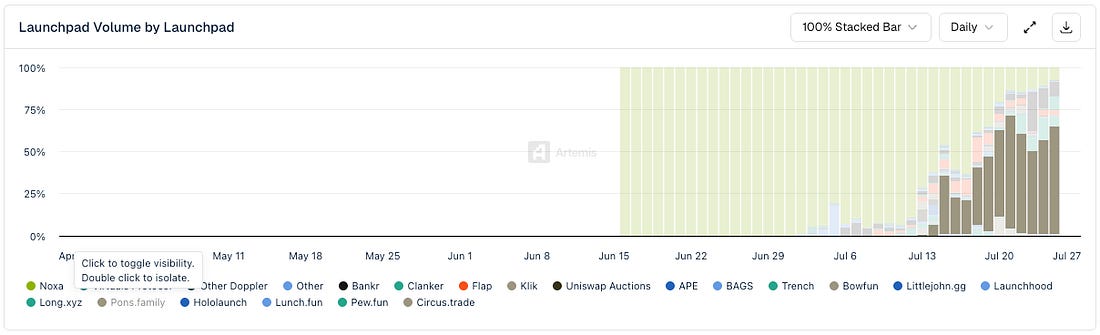
Chart: Launchpad volume distribution, pons.family accounts for 64% of launchpad trading volume and 81% of transaction count. Source: Artemis
What It Was Built For: Small Scale, Fast Growth, Broader Than Stocks
Total market cap of on-chain tokenization is $24.8 million:
- Stocks: $19.1 million
- Private Equity: $1.9 million
- ETFs: $1.5 million
- Commodities: $1.2 million
- US Treasuries: $800,100
This is a growth of approximately 4.5 times from about $5.5 million on June 29, in less than a month. Tokenized equity holders grew from 29,407 to 48,470 in five days. Stock token trading pairs now account for 9.1% of DEX volume, $36 million daily average, while memecoins are 74.7%.
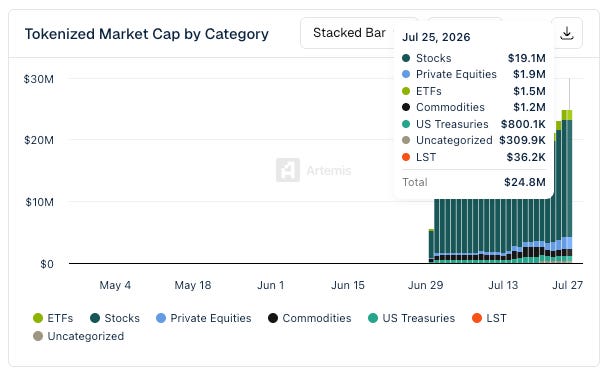
Chart: Total market cap of on-chain tokenization by category, stocks lead with $19.1 million, overall $24.8 million. Source: Artemis
Robinhood built the distribution channel. Third parties captured the economic benefits. Morpho and Ethena hold deposits. Uniswap clears trades. Pons.family earns fees. Robinhood collects base fees of approximately $78 million annualized.
This is an instance of the Fat App, Thin Chain theory accompanied by a public company income statement.
Chart of the Week
Hyperliquid Open Interest reached a record high of $11.4 billion on July 24, 2026.
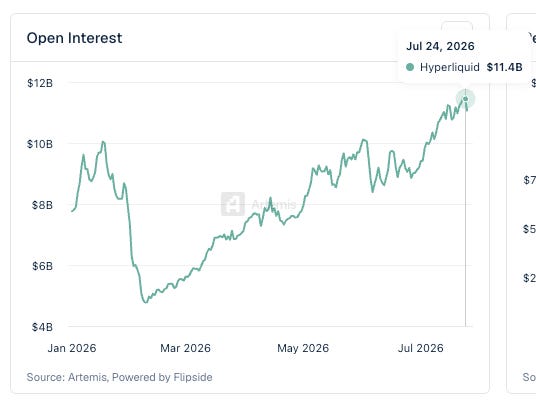
Chart: Hyperliquid Open Interest reached a record high of $11.4 billion on July 24. Source: Artemis / Flipside
Ethereum net inflow was approximately $104 million in the past two weeks, while Bitcoin fund flows were more volatile.
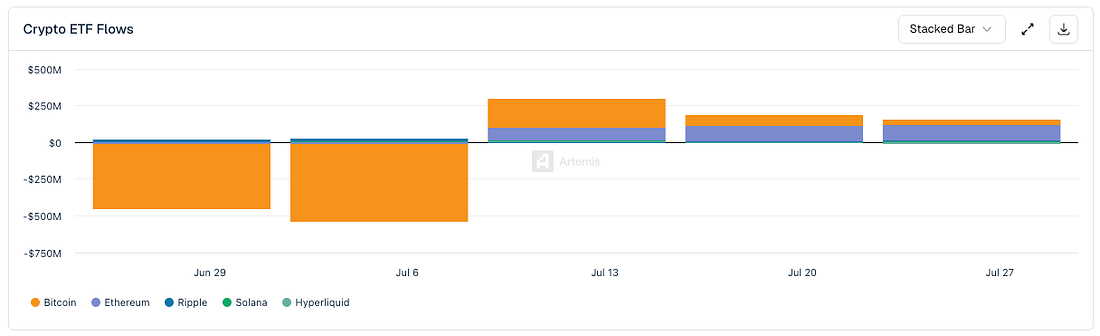
Chart: Crypto ETF fund flows, Ethereum net inflow approx. $104 million in recent two weeks, Bitcoin more volatile. Source: Artemis
Other News Worth Watching
- London Stock Exchange announced the launch of LSE 24 on July 21, a 24/5 trading venue supporting native access for AI agents and on-chain settlement; two days later the SEC announced a roundtable on 24-hour US stock trading to be held on September 17.
- Strategy sold $263.5 million of MSTR stock between July 13 and 19, marking the fourth consecutive week without buying Bitcoin, raising its USD reserves to $3.225 billion, corresponding to approximately $1.76 billion in annual preferred stock and interest obligations.
- Nine companies including Strategy, BlackRock, Coinbase, and Galaxy committed to investing $15 million over three years for Bitcoin post-quantum research, with over 7 million BTC in outputs with exposed public keys.
- Regulators missed the GENIUS Act rulemaking deadline on July 18, with none of the six agencies issuing final rules, delaying full effectiveness to January 18, 2027, while stablecoin supply still grew 18.6% to $308.1 billion.
- PayPal's board formally rejected the acquisition offer of $60.50 per share from Stripe and Advent, hired Goldman Sachs and Evercore, and is seeking a price close to $70 before earnings release on July 28.
- The CLARITY Act still has not submitted a motion to end debate, with the August 7 recess being a key node.
Join TechFlow official community to stay tuned
Telegram:https://t.me/TechFlowDaily
X (Twitter):https://x.com/TechFlowPost
X (Twitter) EN:https://x.com/BlockFlow_News
 @artemis__xyz