Bitcoin Shifts to Bottoming Out, Long-Term Holder Selling Pressure Significantly Eased
TechFlow Selected TechFlow Selected
Bitcoin Shifts to Bottoming Out, Long-Term Holder Selling Pressure Significantly Eased
Bitcoin macro drivers shift, short-term resistance test approaching.
 Navigating Web3 tides with focused insights
Written by: Glassnode
Compiled by: AididiaoJP, Foresight News
Bitcoin's bottom is still being constructed, but its characteristics are quietly shifting. Capitulation selling by long-term holders is beginning to cool off, buy orders successfully absorbed the June lows, and prices are gradually rebounding, challenging the zones that previously suppressed them.
Executive Summary
- The market has begun testing resistance levels above.
- Bitcoin's reaction to weak inflation data was far stronger than any major stock index, marking the most positive response to bullish news in weeks.
- Correlation with the stock market is loosening, while the inverse correlation with the US dollar is deepening further—current drivers are liquidity, not risk appetite.
- Long-term holder selling—the main source of selling pressure this year—has retreated from its peak.
- Profit-taking behavior has decreased significantly, buy orders fully absorbed the sell-off at the June lows, reducing supply pressure facing each rebound.
- Short-term holder cost basis is near $69,000, which is the breakeven line for recent buyers and will become the next major resistance; a strong reaction is expected there.
- Derivatives traders are unwinding short positions, but spot buying has not yet followed, which is the missing link in the current recovery.
Macro Insights
The pressure facing Bitcoin this quarter is essentially a real rate story, not risk aversion. The 10-year real yield has risen to near 2.4%, a 2026 high point, and the US dollar has remained above the 200-day moving average since May. However, broader risk assets are not showing stress: stock markets are near highs, credit spreads are low, and volatility remains moderate.
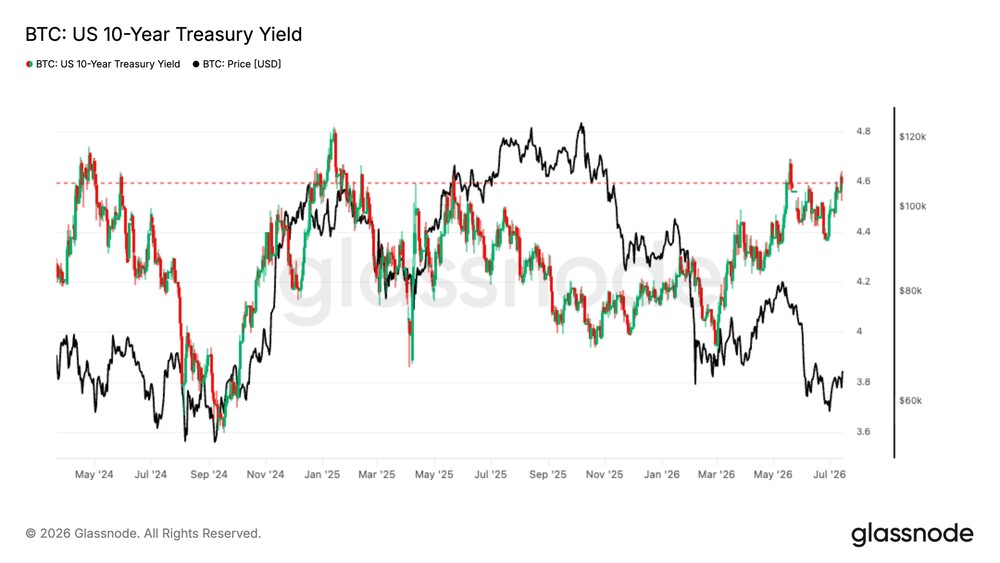
Bitcoin Leads the Rebound
Following the release of moderate inflation data on Tuesday, Bitcoin's gains exceeded those of any other major asset. It jumped quickly after the data release, significantly outperforming US and European stocks for the week. After consolidating at low levels for a month, the market has begun reacting positively to bullish news again.
This sensitivity itself is a signal: a market eager to rise on just one inflation report often means sellers are exhausted, and buyers are just waiting for a reason.
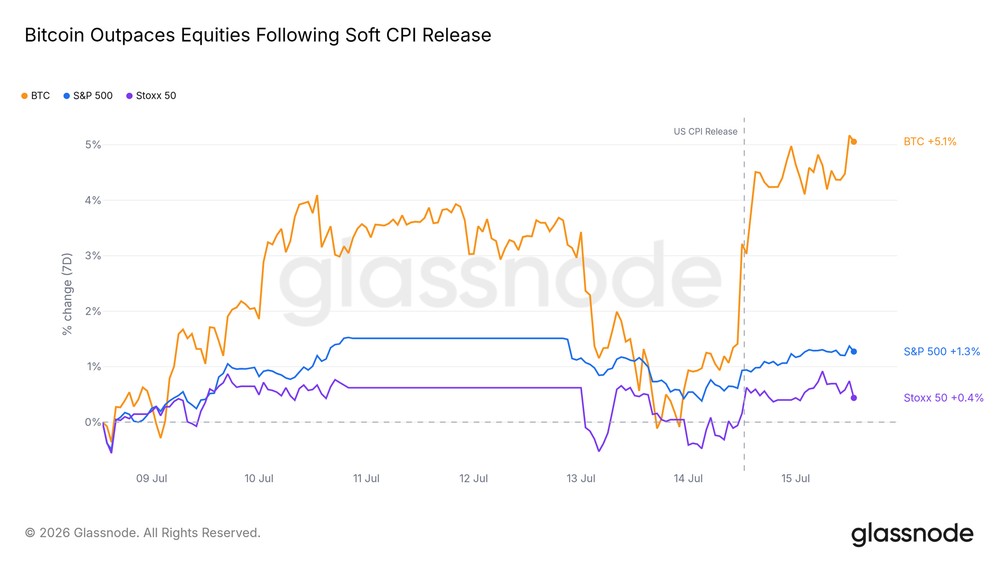
Shift in Macro Driving Logic
Beneath the rebound, Bitcoin's drivers are changing. Since winter, its correlation with US stocks has continued to weaken, while the inverse relationship with the US dollar has deepened. Bitcoin is increasingly less like a stock proxy and more like an asset that strengthens when the US dollar weakens.
It has not departed from the risk asset category, but the influence of the US dollar and liquidity channels now exceeds stock market sentiment. If the macro environment loosens from here, this channel is most likely to transmit first.
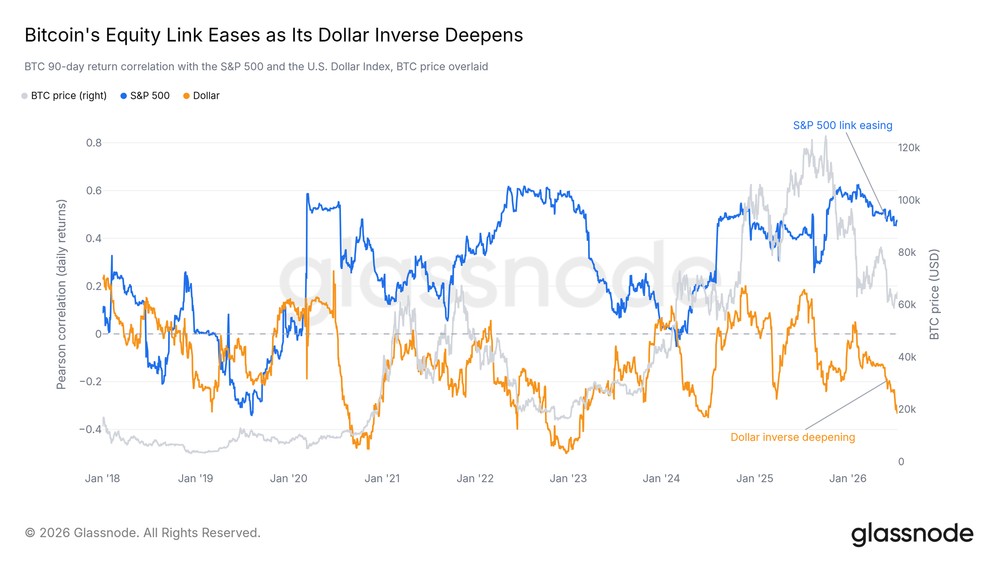
On-Chain Insights
Between Floor and Ceiling
The cost basis chart precisely depicts the current position. Bitcoin's price is above the network-wide average Realized Price—this is the natural bottom support in a bear market; meanwhile, it is below the Short-Term Holder Cost Basis (near $69,000)—this is the average entry price for buyers over the past five months. The current recovery is climbing towards this breakeven resistance level, with a large number of trapped buyers above waiting to break even.
The first touch of this level is likely to trigger a strong reaction, as the group most inclined to sell is exactly those about to break even. Successfully reclaiming it will open space for recovery; if rejected, the range-bound pattern continues.
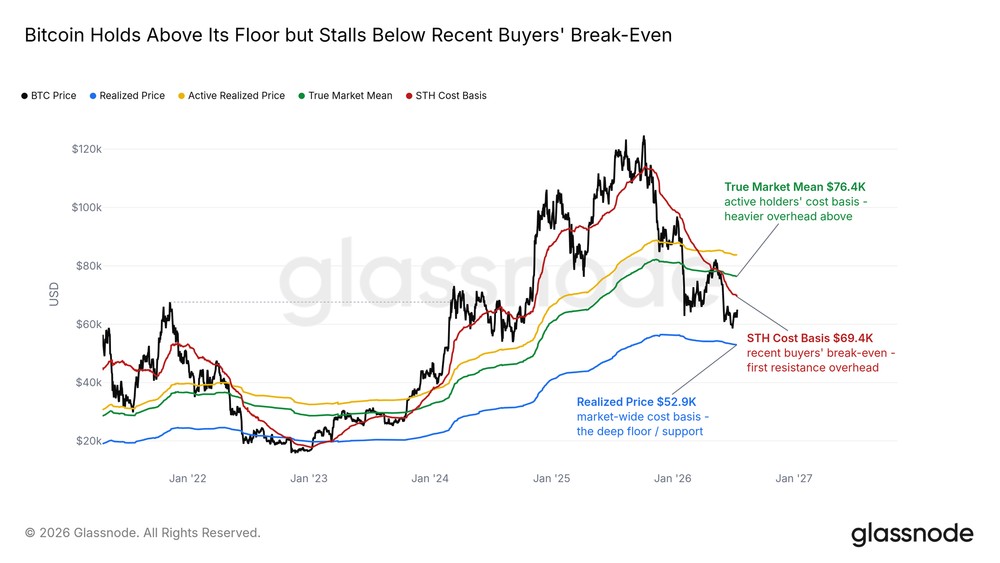
Sellers Stop Profit-Taking
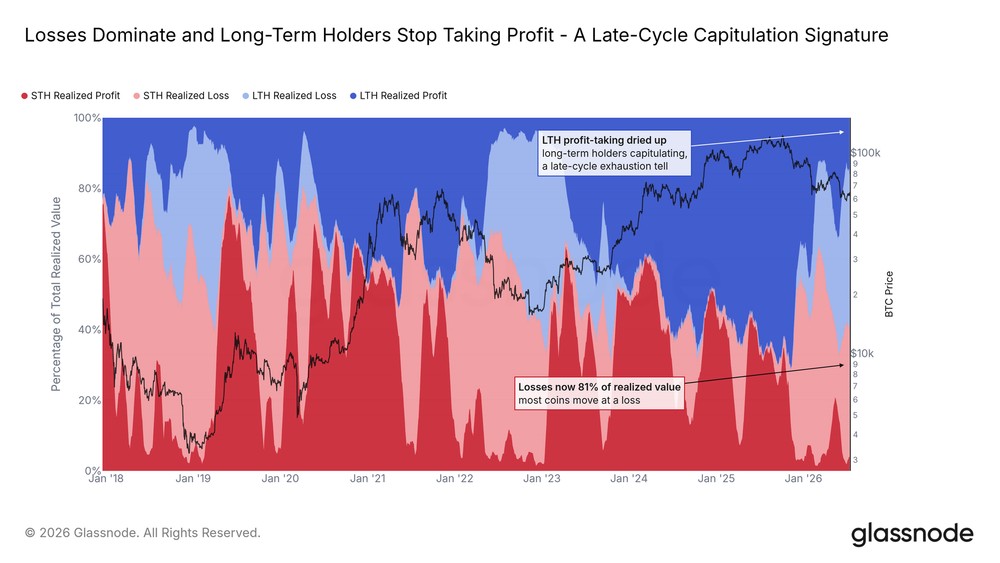
The Long-Term/Short-Term Holder Realized Profit/Loss Relative Metric divides all on-chain selling behavior into four categories: veterans and newcomers, each selling in profit or loss states. For most of this cycle, long-term holder profit-taking dominated the sell side. Now this flow has almost completely dried up; what veterans are selling now are basically loss-making positions.
Loss-making sales from both groups constitute the main transaction characteristic on-chain, a typical signal of late bear market. The key change is that the proportion of long-term holder selling has stopped growing. The wave of selling pressure encountered during every rebound this year is no longer expanding.
Capitulation Selling Begins to Cool
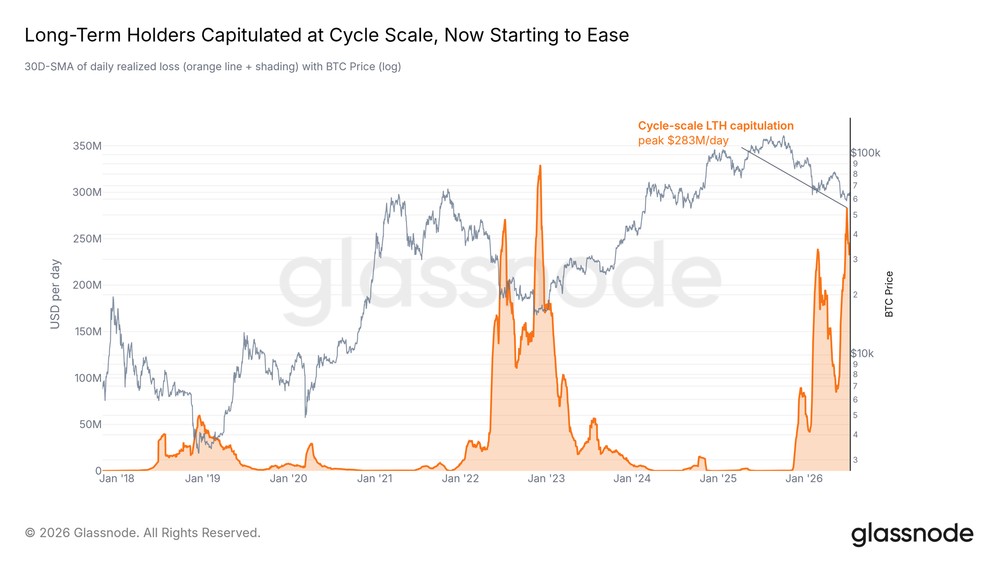
This capitulation rhythm is the most important indicator currently. The Entity-Adjusted Long-Term Holder Realized Loss metric excludes internal transfers, truly reflecting the volume veterans actually give up daily. This indicator hit a cycle peak two weeks ago; in last week's report we clearly pointed out that the cooling of this indicator is a prerequisite for any lasting recovery.
Now it has begun to fall back. One decline cannot prove exhaustive depletion; new shocks could still restart selling. But in this cycle, this is the first time a core indicator defining the bottoming process has turned from rising to falling. The main sellers driving this bear market are drying up on the margin.
Demand Absorbs Low-Point Sell-Off
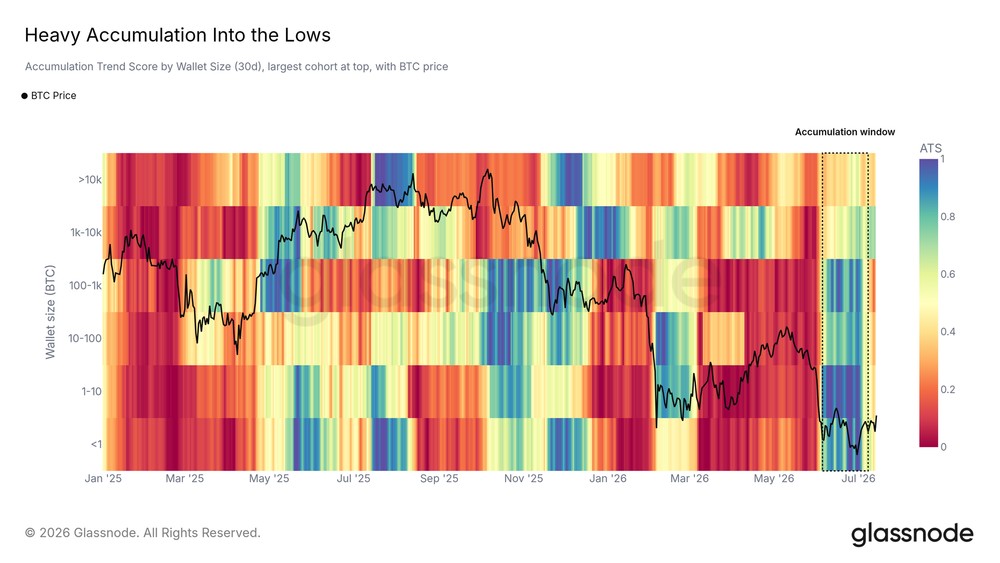
While veterans capitulated, buyers entered in time. The Accumulation Trend Score by wallet size shows a broad and strong wave of buying during the June lows, covering everything from small to large wallets. After prices stabilized, this intensity weakened, and the market entered wait-and-see mode.
Coins sold at the lows found buyers. In the next volatility, whether these buyers can return with equal intensity will determine whether this bottom can hold.
OTC / Derivatives Insights
ETF Outflows Slow Down
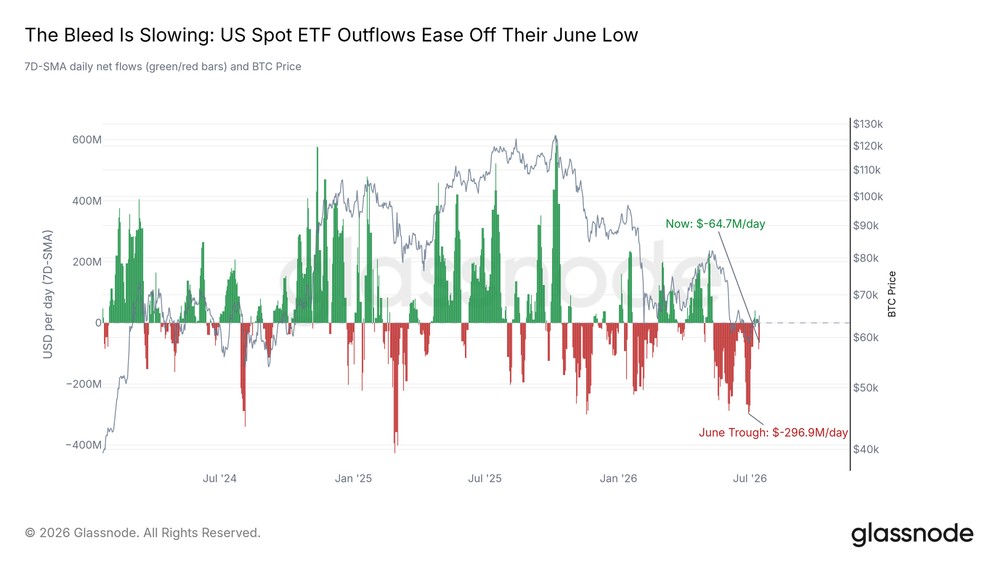
US spot ETFs tell the same story of pressure easing but not yet resolved. Redemption pressure has fallen significantly from June extremes, with trends pointing to stabilization. However, the channel is not fully repaired: one day this week still saw the largest single-day outflow in weeks, followed by partial recovery the next day.
Before inflows truly return and stabilize, this remains a market where institutions have stopped fleeing but have not yet started buying.
Shorts Give Up Resistance
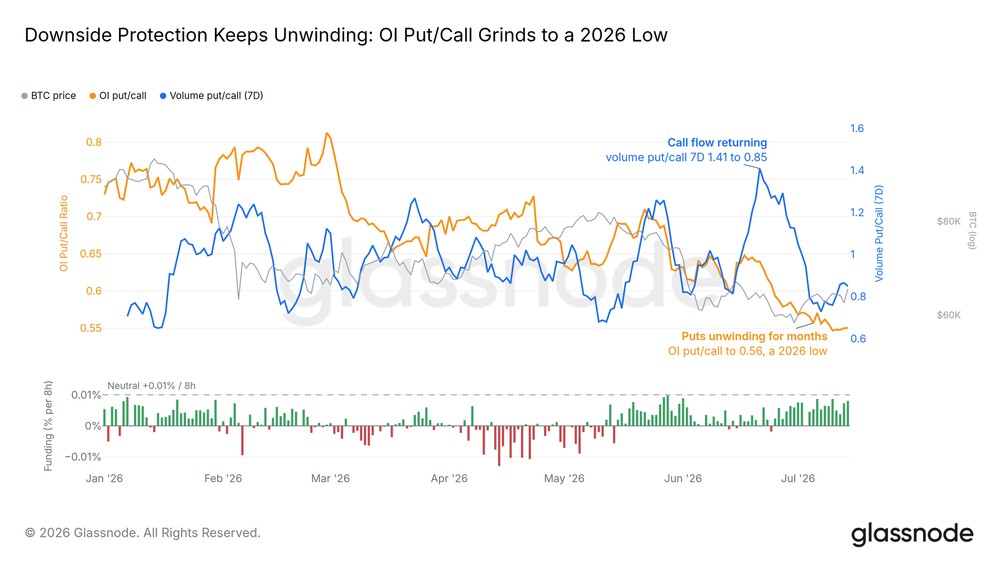
The derivatives market has moved in the opposite direction for weeks. The options put/call ratio has dropped to the lowest level of the year, traders are letting bearish protection expire; perpetual contract funding rates are only slightly above neutral, far from crowded long levels. Bearish bets are quietly and steadily exiting.
But this unwinding has not brought actual buying. Position adjustments by futures and options traders do not equal capital entering the spot market, which is the clearest warning in the current recovery.
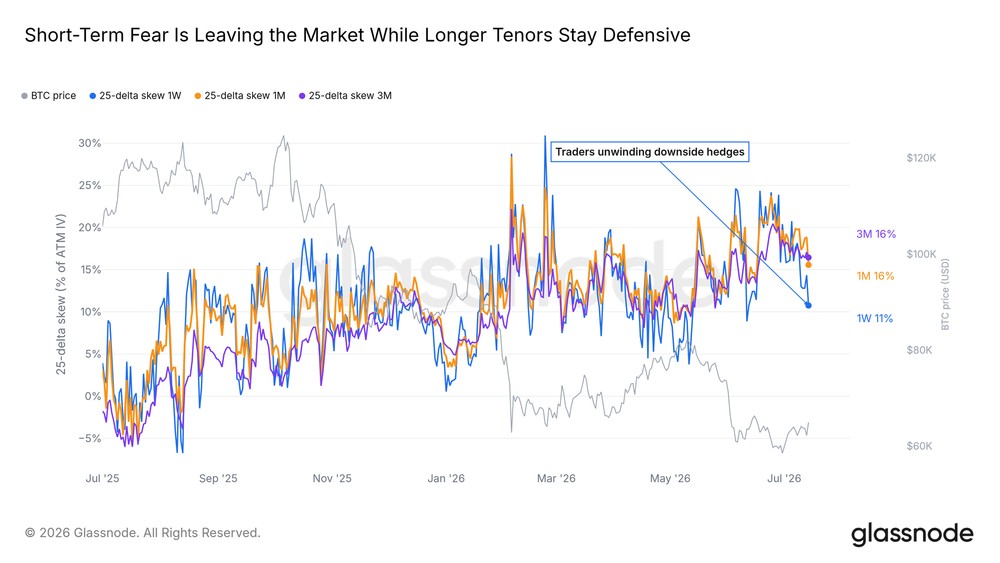
Panic Premium Eases
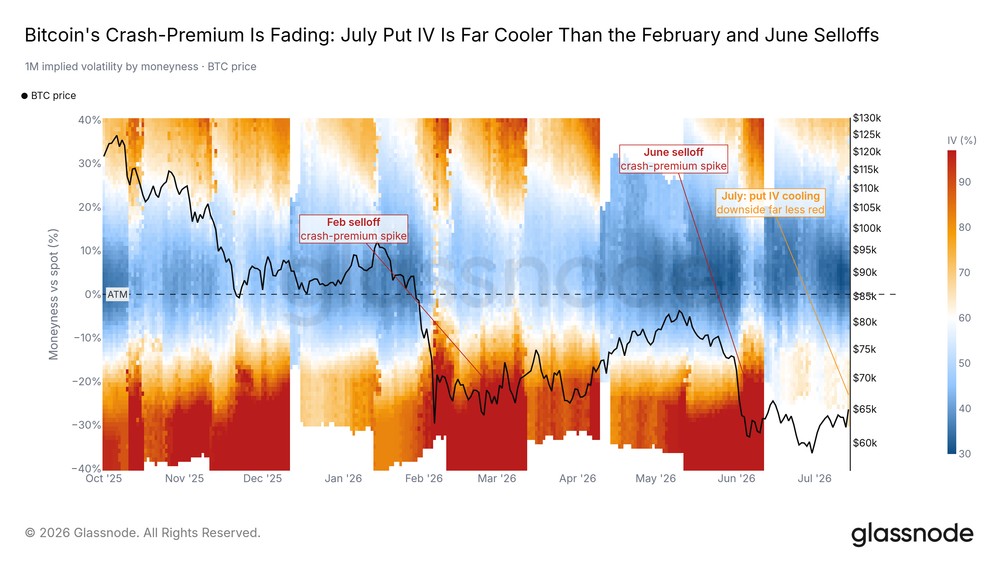
The premium for crash protection in the options market (measured by 25-Delta Skew) surged during the June sell-off, has since continued to fall, and is now far below February extremes. Hedging costs for each pullback are significantly lower than a month ago.
Protection demand still exists—as it should while lows are unconfirmed—but the overall direction is trending towards normalization.
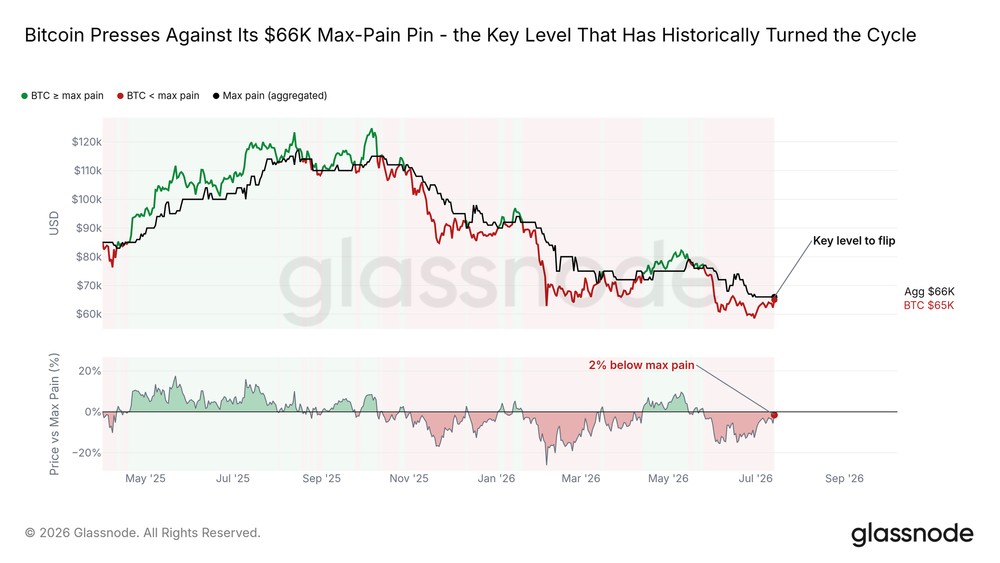
Approaching Max Pain
Max Pain is the price at which the largest share of open options expire worthless; spot prices have fluctuated around it this year. Bitcoin is currently just below this level and is challenging it for the first time in weeks.
Historically, reclaiming Max Pain often aligns with the market shifting to a more friendly environment, although the transition takes time. Cleanly standing above this position will be the first structural signal of a breakout from the range; if rejected, it confirms the cautious sentiment still priced by the options market.
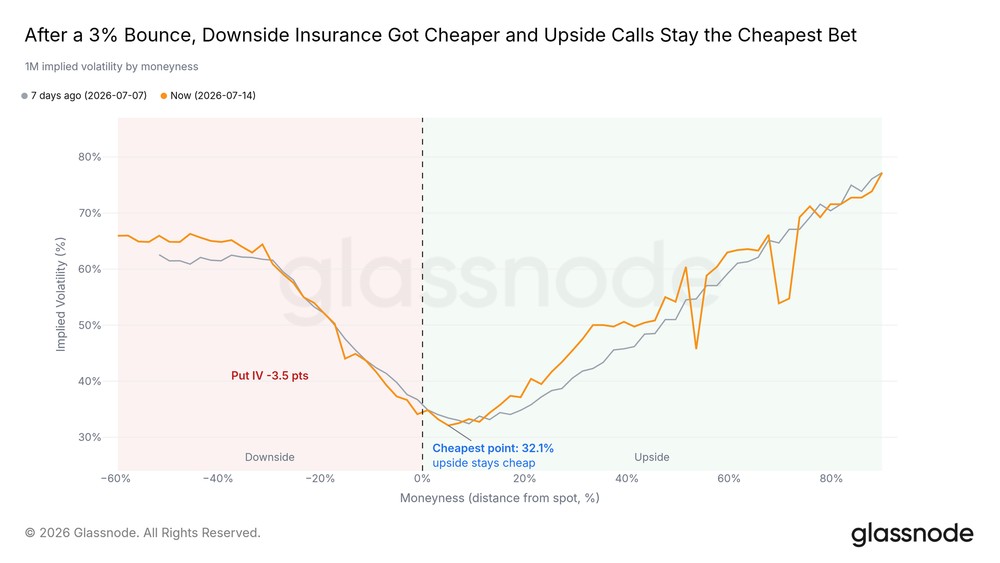
Crash Protection Costs Decline
Absolute protection costs also confirm the easing trend. During the recovery process, one-month crash protection prices have steadily fallen, and hedging demand has weakened. The market is still paying a premium for the downside, but far below levels at the lows.
Volatility Enters Calm Period
A longer-term perspective shows how calm the market has become. The Bitcoin Volatility Index (DVOL) is near one-year lows, and the deep put pressure that erupted in February and June has receded from the volatility surface. This compression rarely lasts; it is usually the backdrop before the next decisive move launches.
Conclusion
The bottom is still being constructed, and this week it began to respond. Long-term holder capitulation has retreated from its peak, profit-taking has dried up, and the June lows were absorbed by broad buying. Bitcoin's reaction to macro bullish news is stronger than other assets, it is approaching Max Pain from below, and nearing the Short-Term Holder Cost Basis above—there lies the first real test facing the recovery.
Confirmation signals have not yet appeared: ETF outflows are slow but not reversed, derivatives unwinding lacks spot follow-through, volatility compression awaits a catalyst. The key signal to change judgment is spot-driven buying pushing prices to effectively break through and hold the Short-Term Holder Cost Basis. If long-term holder losses accelerate again, or prices are beaten back near the Realized Price, the market will return to range-bound oscillation.
The foundation has been laid, the follow-through has not yet arrived.
Join TechFlow official community to stay tuned
Telegram:https://t.me/TechFlowDaily
X (Twitter):https://x.com/TechFlowPost
X (Twitter) EN:https://x.com/BlockFlow_News
 @glassnode